Counting Crashes to Improve Device Reliability
The first step to making reliable IoT devices is understanding that they are inherently unreliable. They will never work 100% of the time. This is partially because we firmware engineers will never write perfect code. Even if we did, our devices need to operate through various networks and gateways, such as cellular modems, mobile phone Bluetooth applications, Wi-Fi routers, cloud backends, and more, and each of these may introduce unreliability. The devices may work with today’s Wi-Fi routers and mobile phones, but whether they function with tomorrow’s is a mystery.
The second step in building reliable IoT devices is understanding how often they are not working as expected. If your answer is “I don’t know,” this post is for you. To get to the mythical 99.9% uptime IoT device makers shoot for, you must know if there’s even a 9.
This post will cover the most common reliability metrics that hardware manufacturers use. It will explore which are best for IoT devices, including a novel measurement, Crash Free Hours. We’ll cover exactly what you’ll need to collect on your devices within firmware to measure device reliability and ensure your devices are working as expected.
With the article contents put into action, you can confidently ship new firmware to devices and ensure that there are no regressions in your core metrics and that your devices are happy clams.
Table of Contents
But I’m Just a Firmware Engineer!
When I started my career as a firmware engineer in 2014, I had one job: do what my manager and product leads told me. This meant fixing some bugs that have existed for a while, adding unit tests where they were needed, and slowly improving or rewriting old subsystems of the Pebble firmware. Life was easy, and all I had to do in my day job was write code that worked and get it into the subsequent firmware releases.
As I grew as an engineer, I wanted to learn more and was asked to investigate what happened after shipping the firmware to our customers. Was the filesystem performance change I made improving our display’s frames-per-second? Did average uptime dramatically improve after fixing the bug that topped our crash leaderboard? How did the battery life of the devices change after fixing the CPU sleep bug? These were all questions I started having, and I wanted to know the answers!
Thankfully, we firmware engineers could add and access device diagnostic data easily and write SQL queries to answer our questions. I’ve always found that some of the best firmware engineers I know are also proficient in SQL, and they spend a large chunk of time building and looking at dashboards!
The three core metrics that we cared about at Pebble were the following:
- Average time between firmware crashes
- Average battery life
- Percentage of time the watch was connected via Bluetooth to the phone (we’d often have connectivity regressions!)
The easiest metric to improve upon was the average time between crashes since we had a pretty slick diagnostics system akin to Memfault’s product offering. Internally, at Memfault, we’ve been calling the various metrics related to crashes Stability Metrics, and crash free hours as Stable Hours, which we have found to be better understood by our customers.
Let’s dig into some Stability metrics.
This article primarily talks about crashes. If you’d like to track other failures, read up on how you might adjust these metrics to work for you.
Stability Metrics
In an ideal world, the firmware on a device never crashes. This is only realistic for some modern firmware operating on even the most basic MCUs, especially since we keep writing in C, which lacks robust compile-time checks and memory safety features. The best we have is offensive programming practices and liberal usage of asserts.
With this acknowledged, we need a way to measure how often our devices crash in the field. Sounds simple! I only wish it was. To compare the different metrics we can collect on the device and compute in a data warehouse, we’ll develop a few criteria.
We want to collect a stability metric that:
- Can quickly assess the reliability of a group of devices: We want to get a signal from a metric within hours and days after releasing a new firmware version, not wait weeks or months. We also want to compare this metric with previous firmware releases to determine whether there is a regression.
- Handles expected vs unexpected reboots: We want to be able to separate crashes from user shutdowns or the battery being depleted.
- Not susceptible to a small subset of misbehaving devices skewing the metric: A handful of devices crashing many times an hour should not drastically skew the metric if 99.9% of all other devices behave normally.
- Works well with session-based devices: The metric needs to handle devices used or powered on intermittently. An example of an intermittently used device is a handheld gaming device or a home espresso machine. The gaming device would track a game session, and a coffee machine would track a brew session.
Getting metrics from the device can be relatively simple, but if you are looking for a place to start, I recommend reading a previous post on heartbeat metrics.
Before we dig into each possible metric to collect from the device and how to aggregate it, here’s a summary table of all the ones I’ll talk about today and their strengths and weaknesses.
| Metric Criteria | Uptime | Mean Time Between Failure | Crash-Free Sessions | Crash-Free Hours | Crash-Free Devices |
|---|---|---|---|---|---|
| Can assess the reliability of devices & software quickly after firmware updates | ❌ | ❌ | ⚠️ | ✅ | ⚠️ |
| Handles expected vs unexpected reboots | ❌ | ✅ | ✅ | ✅ | ✅ |
| Not susceptible to a small subset of misbehaving devices skewing the metric | ❌ | ❌ | ❌ | ✅ | ✅ |
| Works well with session-based devices | ❌ | ⚠️ | ✅ | ⚠️ | ✅ |
- ✅ - works great
- ⚠️ - works well with a caveat
- ❌ - does not work well
Uptime
The most frequent way I see engineers try to understand device reliability is by tracking uptime and sending it as a metric periodically or after a reboot. This is because it’s usually directly built into the operating system. Zephyr RTOS includes the function k_uptime_get, and you can even run the uptime command on any UNIX command line:
$ uptime
15:52  up 14 days,  7:10, 2 users, load averages: 2.04 1.97 1.93
To calculate average uptime, add all the uptime measurements (assuming only one per boot is sent) and divide by the number of measurements.

Here’s a diagram to show how some uptime measurements could be collected and aggregated.
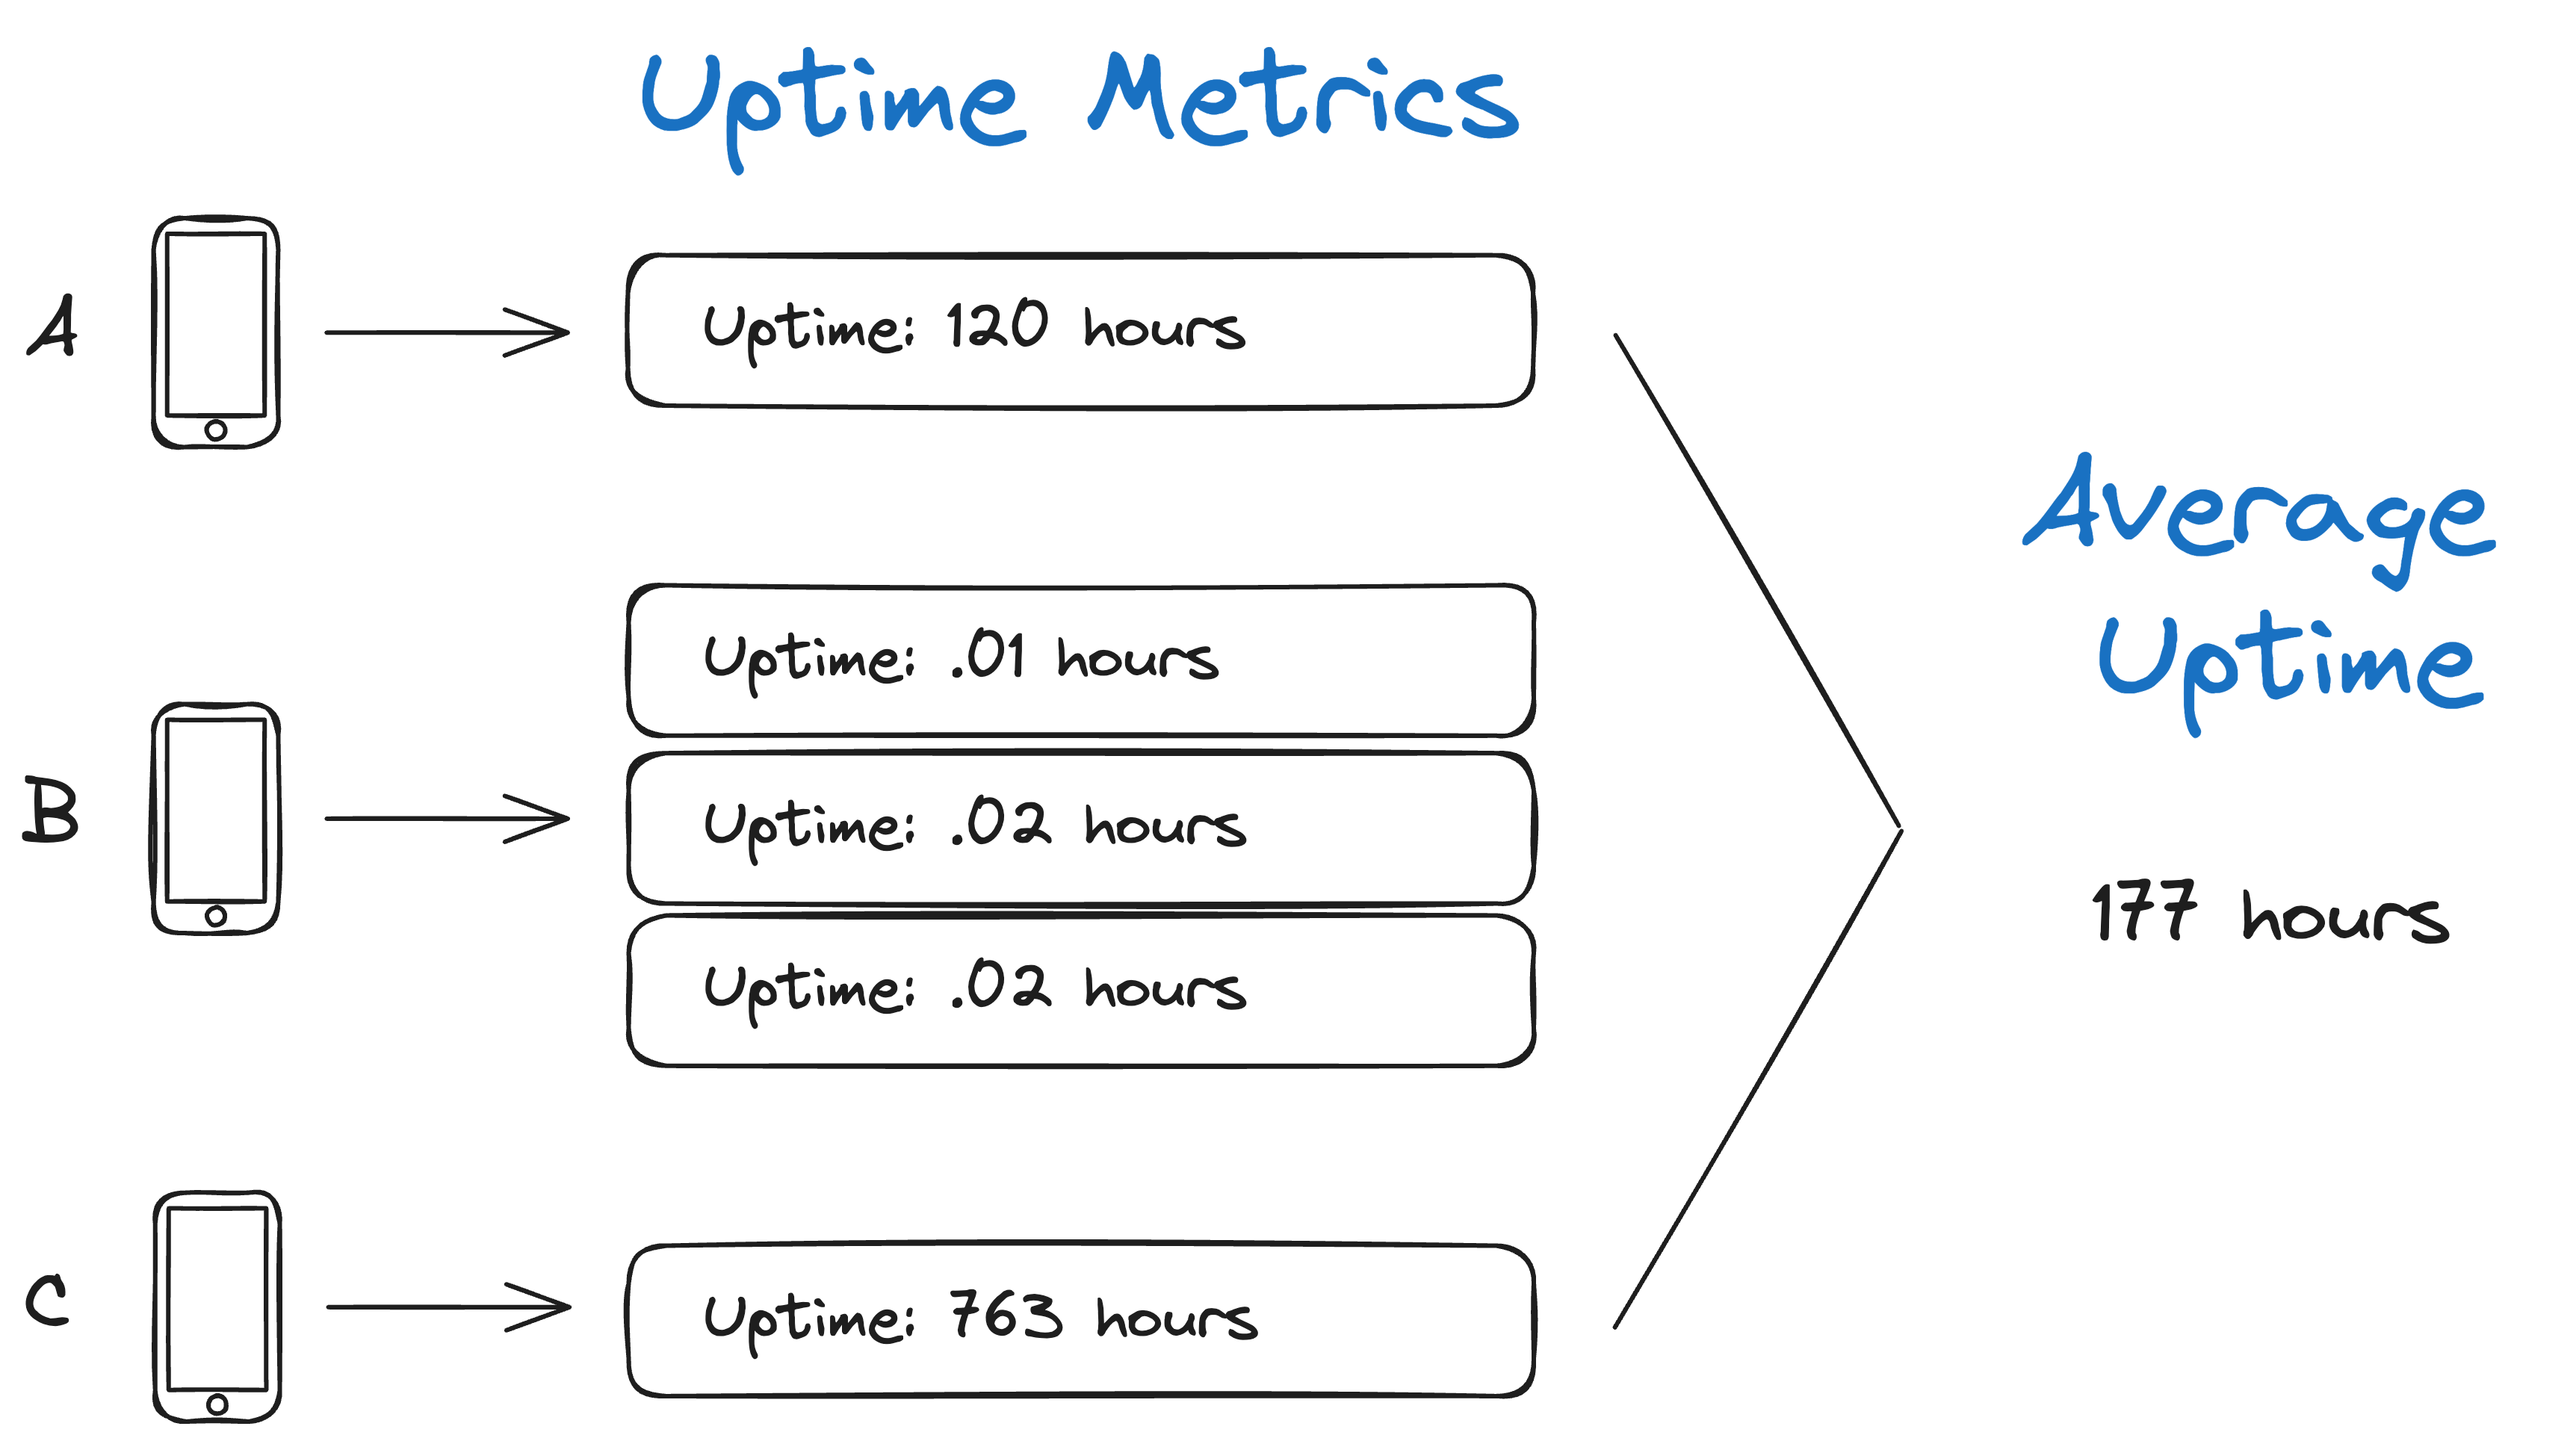
Although very easy to collect, there are two significant problems with using device uptime as a metric for reliability.
First, if you want to know if your devices can be ‘up’ for 30 days on average, you need to wait at least 30 days to compute it. This problem is similar to estimating the battery life, where if a device is supposed to last 30 days, you may need to wait 30 days to know if it will. Just like we talked about in our battery life measurement post, there is a better way here to determine uptime.
The second issue with uptime is that users sometimes shut off devices themselves! With the stability metric, we only want to track failures, which leads us to the classic metric, Mean Time Between Failures.
Collection
If you only have uptime as a metric, try to send it once per boot. It’s too cumbersome to try and calculate average uptime if a device is sending multiple uptime metrics per boot, as it will require comparing timestamps and trying to find the last known measurement for a boot.
I would implement this when the device crashes or shuts down, get the current uptime, and store it in persistent storage. Then, upon reboot, collect the recorded uptime and send it as a metric.
Summary
I do not recommend using uptime to measure device reliability, and I would use it only for customer support reasons. It’s nice to verify how long a device was operational when talking to customers.
| Criteria | Rating | Notes |
|---|---|---|
| Can assess the reliability of devices & software quickly after firmware updates | ❌ | Need to wait N days to see if uptime averages to N. |
| Handles expected vs unexpected reboots | ❌ | Expected resets (user shutdowns, firmware updates, etc.) will reset the uptime counter. |
| Not susceptible to a small subset of misbehaving devices skewing the metric | ❌ | One device resetting often will cause the metric to skew lower. |
| Works well with session-based devices | ❌ | If a device is powered on once a day for N hours, its uptime will only be N hours. |
Mean Time Between Failure (MTBF)
MTBF is a standard metric for assessing how long it takes for a device or component to fail catastrophically. This metric is most helpful in evaluating individual component failures, like a light bulb burning out, a sensor malfunction, or large machines on assembly lines needing human intervention for repairs. The device being measured is either working or not working, and a failure prevents the device from functioning.
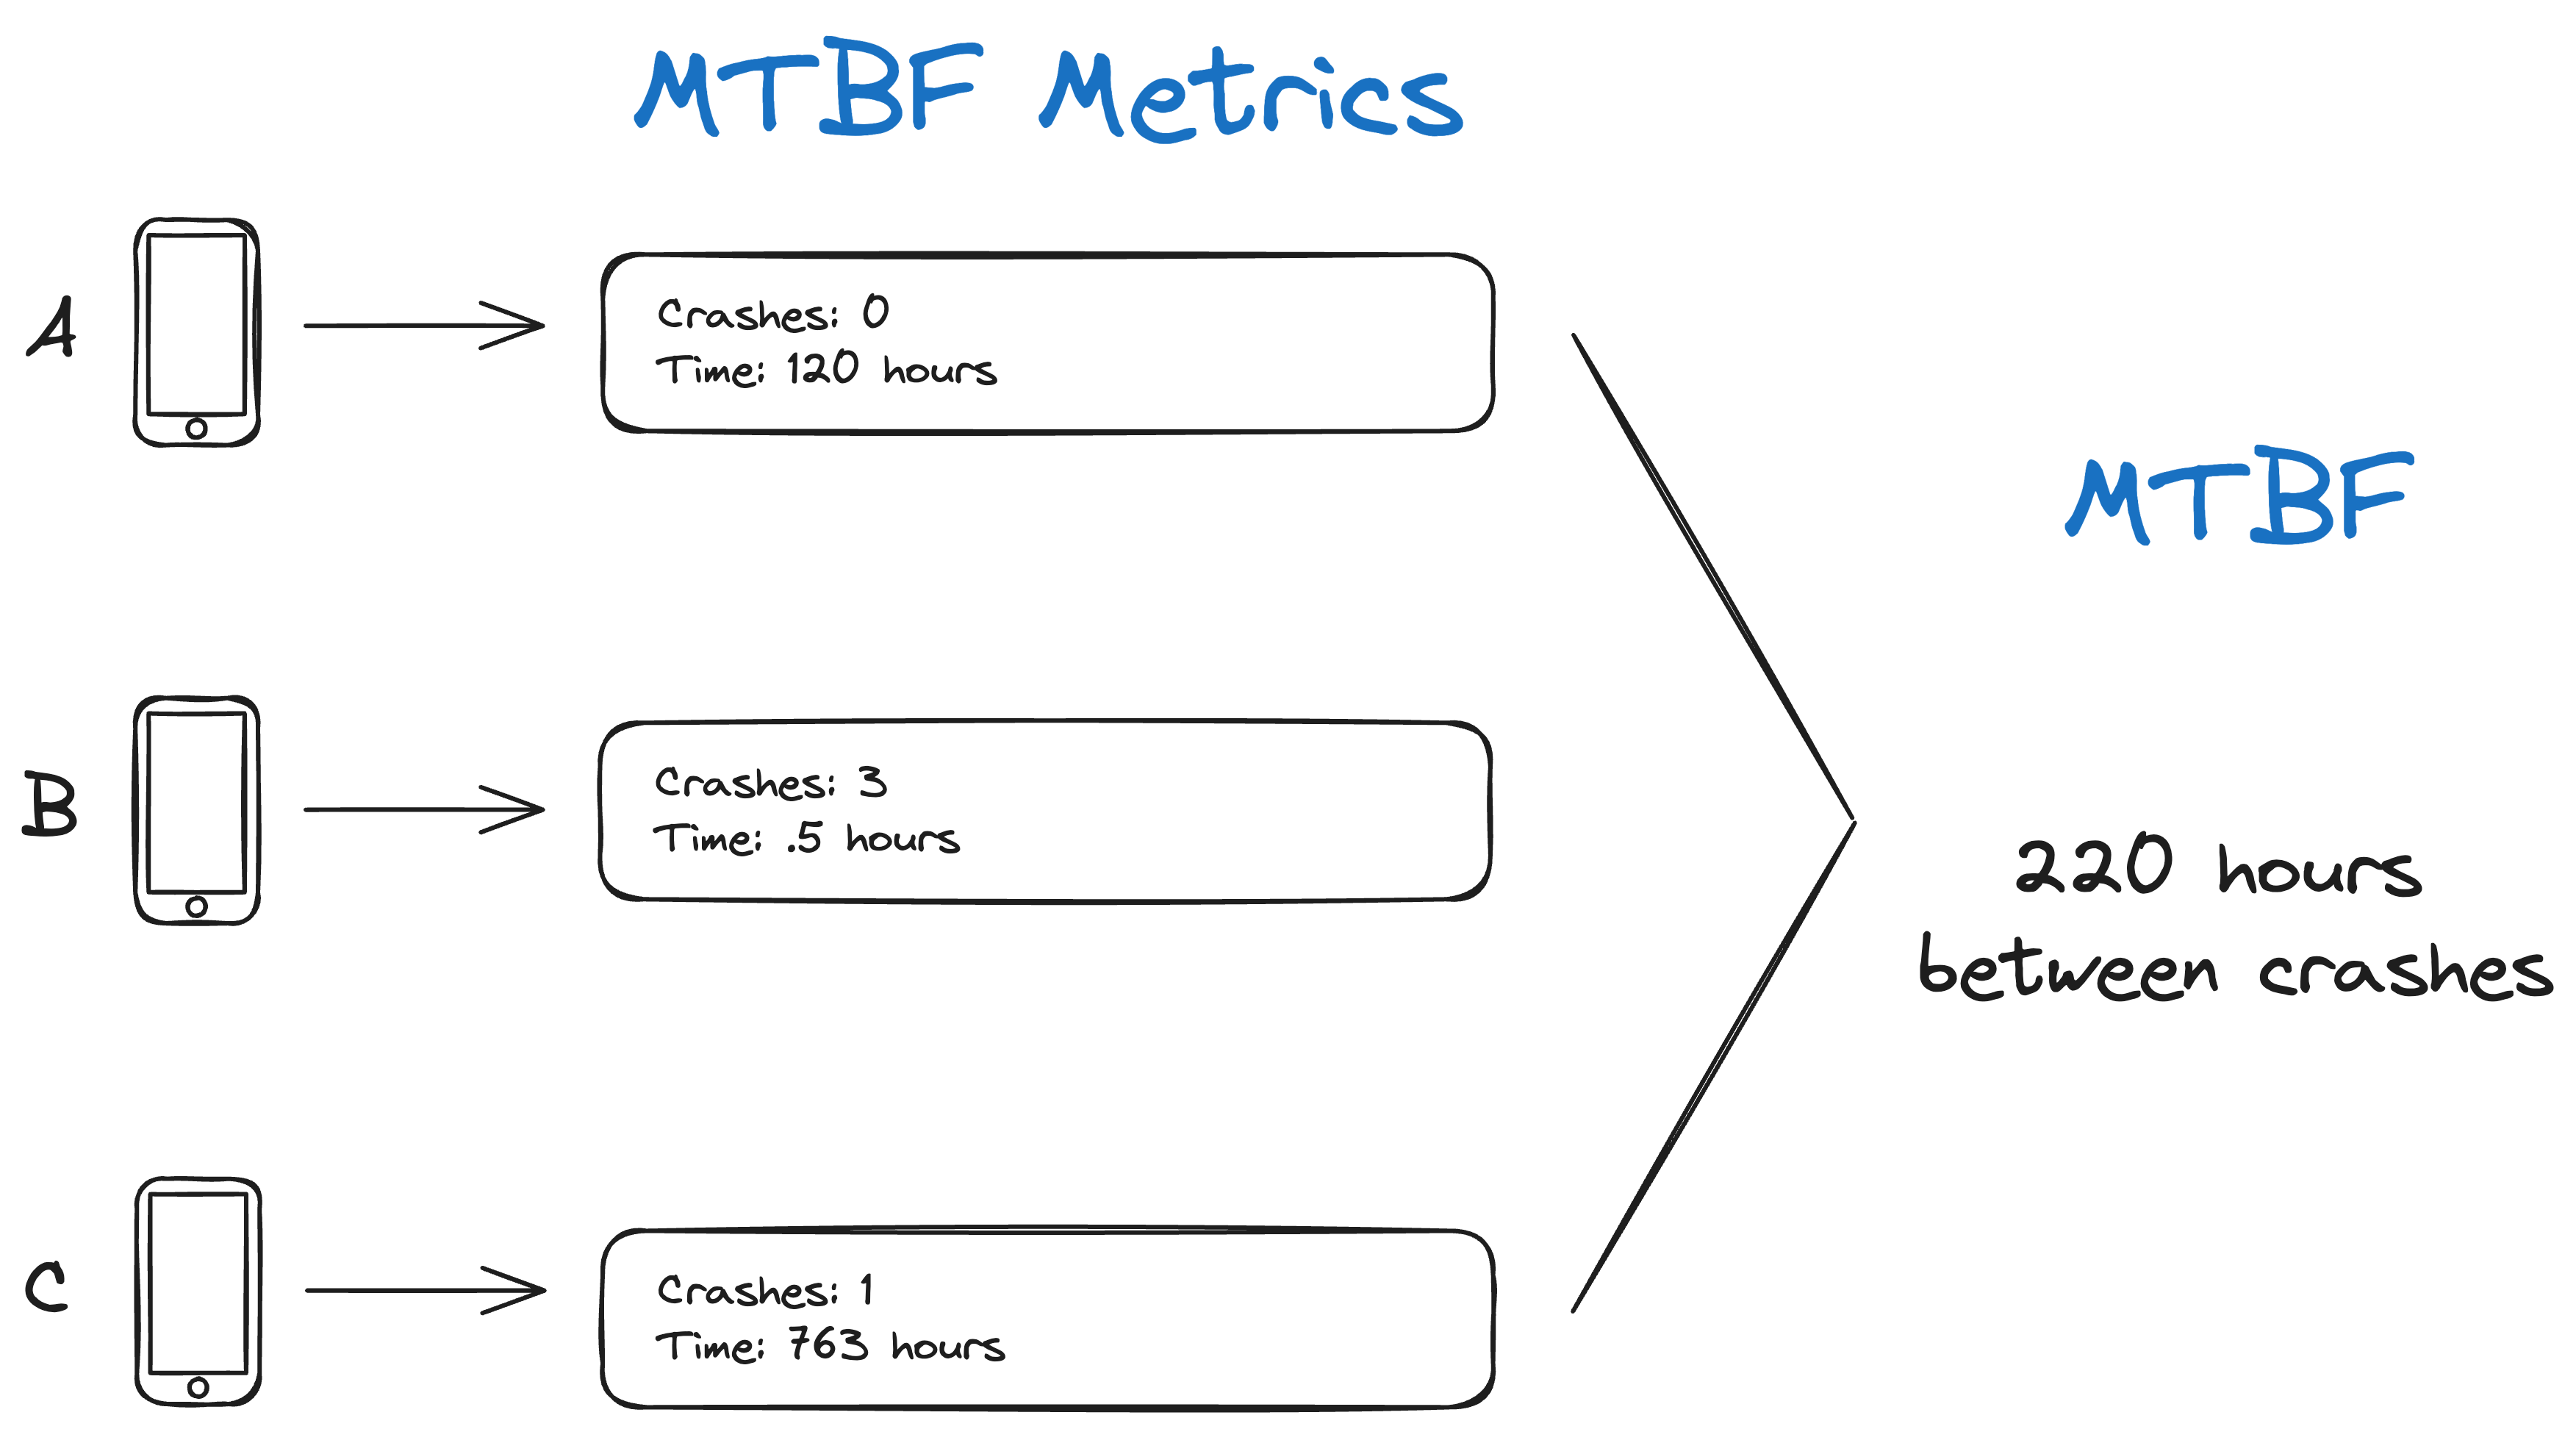
MTBF is almost the same as the uptime metric above, but this isn’t obvious at first glance. To calculate MTBF, devices will send how often they crash and the total amount of operating hours. The number of operating hours is divided by the number of crashes, producing MTBF.

MTBF and the uptime calculation above break down when devices crash frequently. If Device A crashes once a week, but Device B crashes 100 times an hour due to a hardware problem, the MTBF becomes heavily skewed by a single crashing device. If we have a few thousand devices in the field, just a handful of outlier devices can bring down the average if we don’t adjust how this metric is calculated. I’ve never tried it myself, but maybe median time between failures works better at times.
Below is an example of 3 devices sending their crash rate and operating time metrics, and we calculate the MTBF. Notice how Device B crashes 3 times, bringing the resulting average down. Also, MTBF has a more excellent value than our average uptime above since Device A didn’t crash.
Collection
To collect MTBF from the devices, record the last boot’s uptime according to the instructions in the uptime section. To make sure that only crashes are counted when calculating MTBF, send alongside this metric whether or not the last boot ended in a crash.
Summary
I do not recommend MTBF as a reporting metric and would instead opt to use any one of the metrics listed later in this article.
| Criteria | Rating | Notes |
|---|---|---|
| Can assess the reliability of devices & software quickly after firmware updates | ❌ | Like uptime, we need to wait N days before being confident our devices can go N days between crashes. |
| Handles expected vs unexpected reboots | ✅ | Expected reboots performed by the user are properly ignored. |
| Not susceptible to a small subset of misbehaving devices skewing the metric | ❌ | One device resetting often will cause the metric to skew lower. |
| Works well with session-based devices | ⚠️ | MTBF can work well with session-based devices, but it’s not intuitive. If a device is used 1 hour a day and its MTBF metric is 24 hours, it’s expected to crash every 24 days, not every day. |
Crash Free Sessions
This metric is typically used in the mobile and web application world. A session is the time between a user opening and closing an application or navigating to and away from a website. If a crash did not occur in that time window, it’s a crash free session!
IoT devices often operate within a session world. These devices might include an e-bike, a smart coffee maker, or a pair of headphones. For these devices, tracking crash free sessions would be ideal, as the ultimate metric the manufacturer wants to know is whether the device crashed when the user was using the product. If it did, it probably resulted in the user noticing - You wouldn’t want an e-bike to ‘crash’ while riding it!
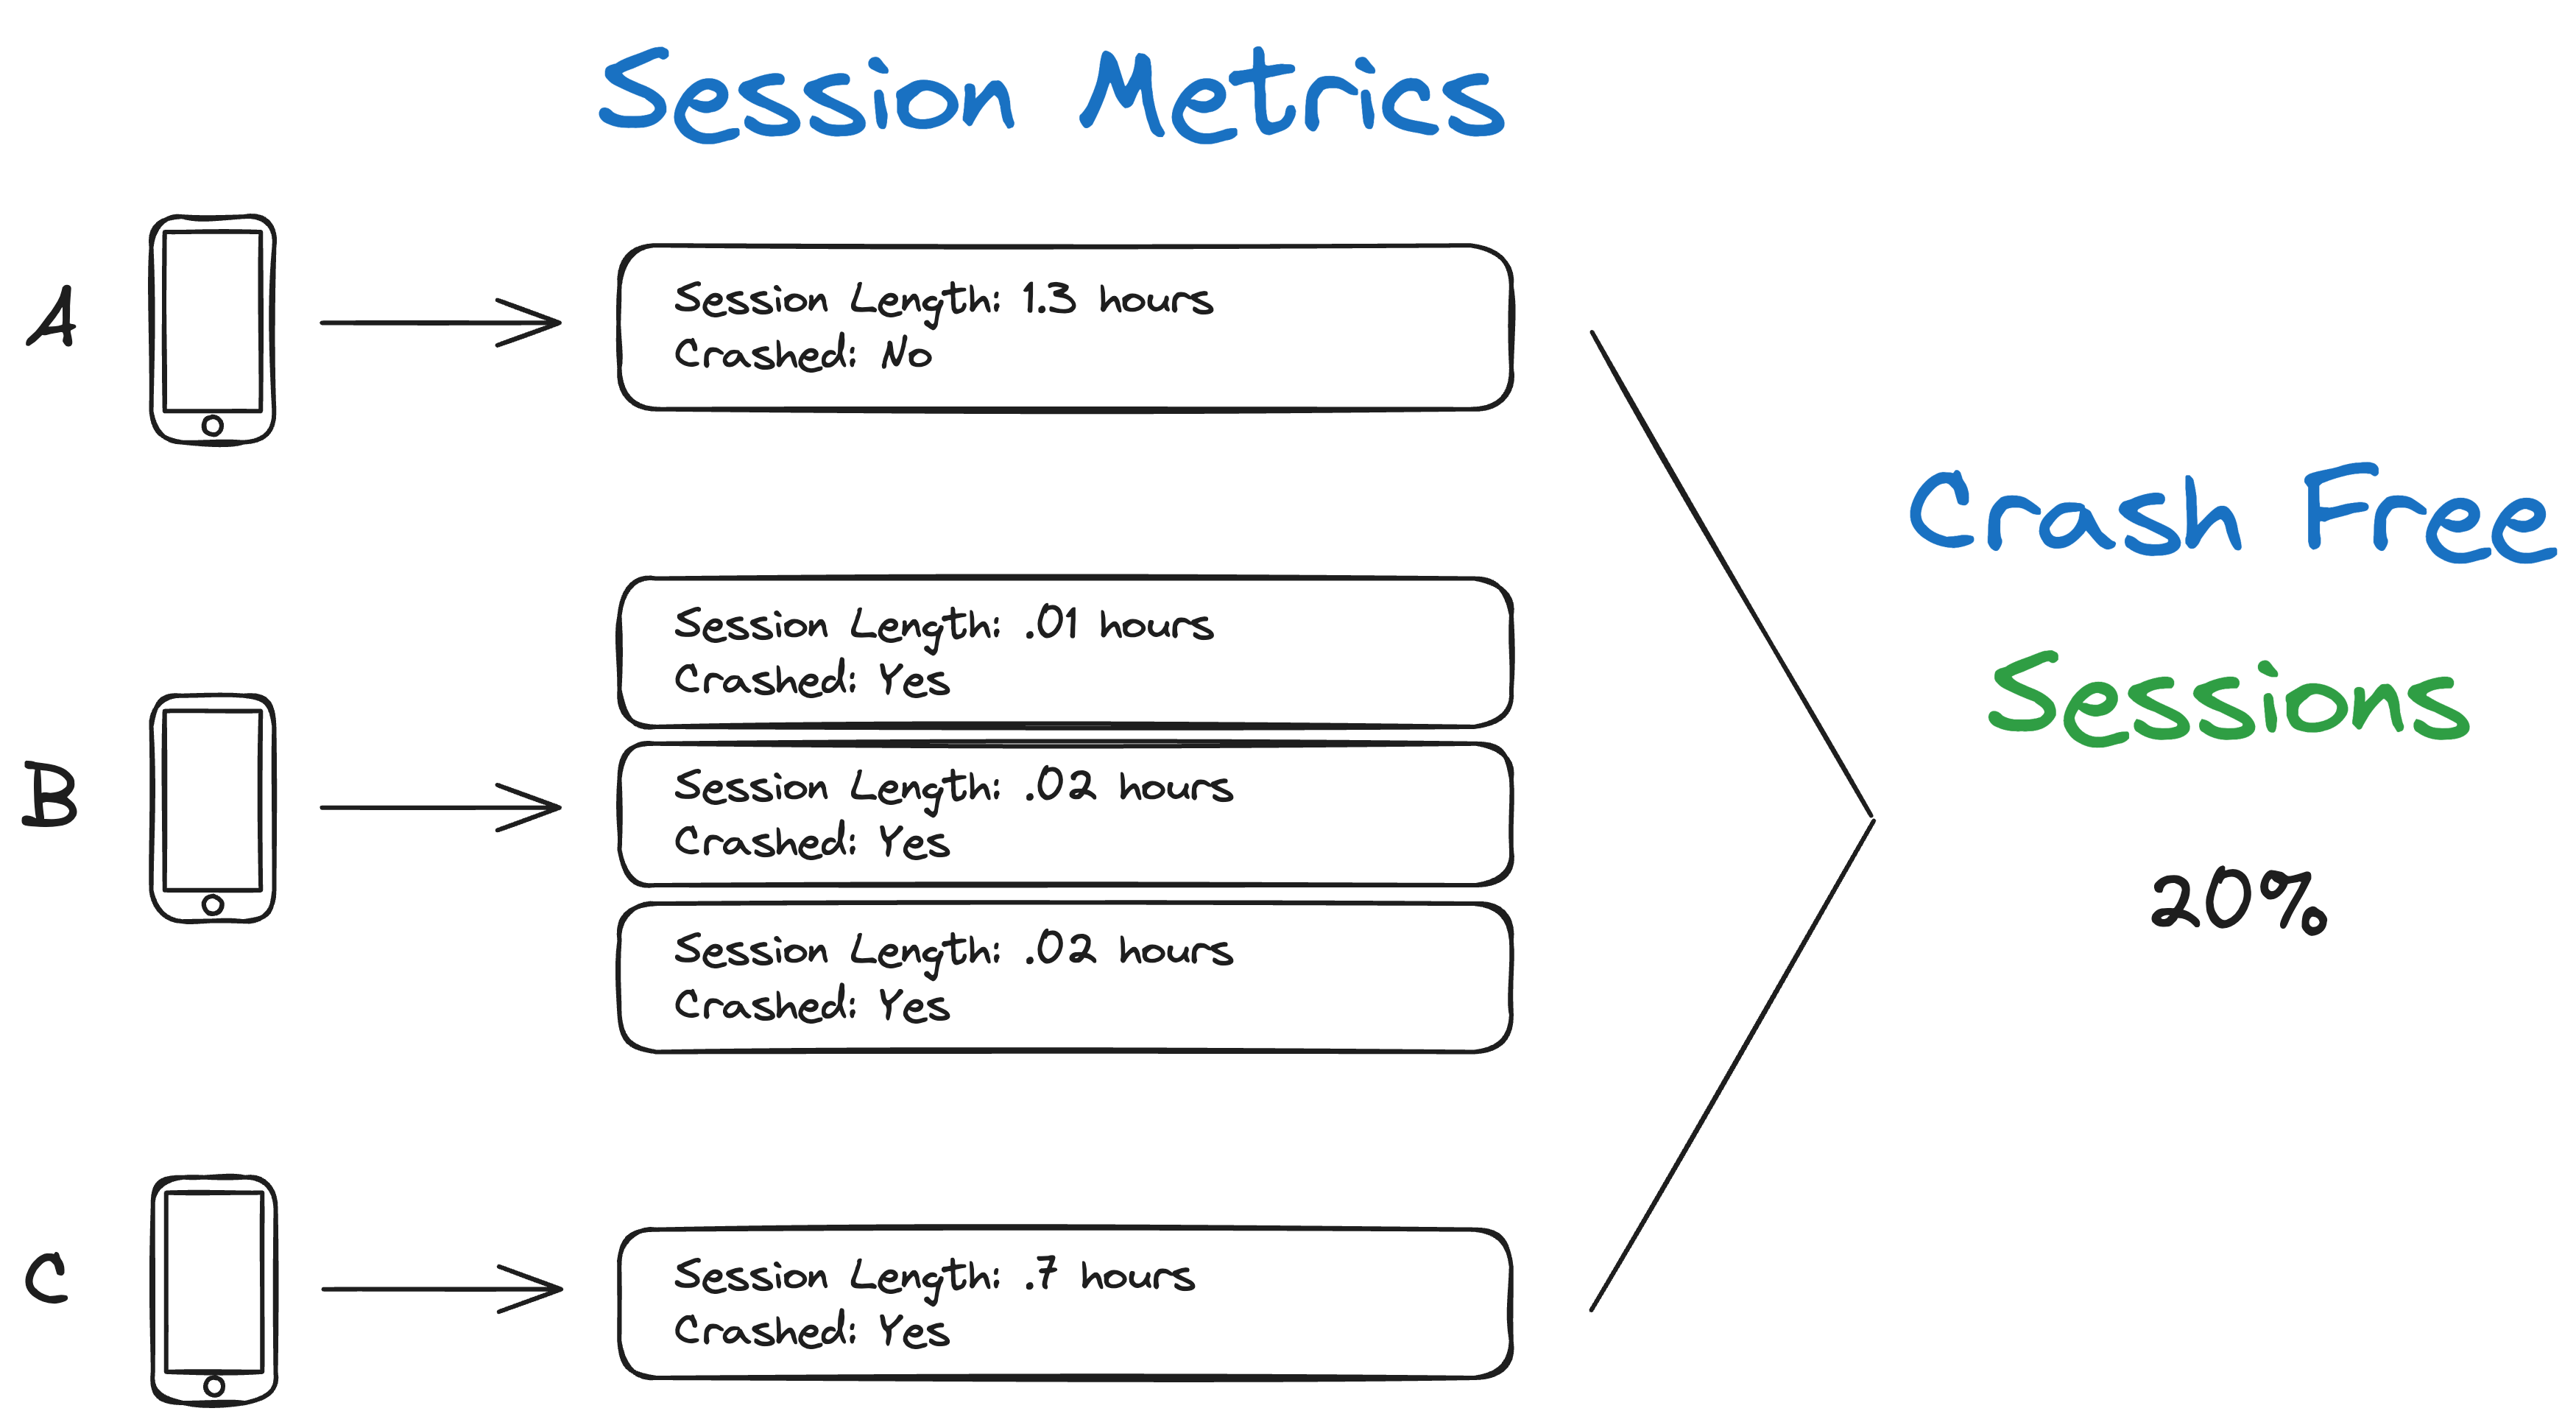
Calculating the percentage of crash free sessions is self-explanatory - divide crash free sessions by the total number of sessions across all devices.

In the mobile and web application space, a metric of 99.9% crash free sessions is considered great. This translates to only 1 in 1,000 sessions, resulting in a crash. If a device’s session is typically 1 hour in length and is used 24 hours a day, this would mean that one can expect the device to operate for 41 days before crashing.
Below is an example of a handful of sessions reported from devices.
I appreciate how intuitive the crash free sessions metric is. If the device is a pair of Bluetooth headphones, you can quickly see how many audio sessions were interrupted by a crash. After each firmware release, you can compare the previous software’s crash free session percentage to the latest and see if things are better or worse.
The primary issue with crash free sessions is that the metric can be skewed by a small number of devices often reporting crashed sessions.
A minor issue with this metric is that if sessions are long, getting a signal on the data will take a while. However, if devices are session-based, the sessions are likely shorter than a day, so the metric can be calculated within the first few days of a new release.
Collection
There will likely be two code paths for collecting crash free sessions. The first is where the session does not result in a crash. In these cases, record that a session took place immediately when the session finishes and send the metric.
If a crash disrupted the session, you need to persist in storage, likely during the fault handling, that the device was in the middle of a session and that the session ended in a crash. Upon rebooting, the firmware should then report that a session had crashed.
Summary
I like using crash free sessions, especially if the devices operate in a session world and are short. The metric that is ultimately calculated is clear and understandable by all. I recommend teams track this metric.
| Criteria | Rating | Notes |
|---|---|---|
| Can assess the reliability of devices & software quickly after firmware updates | ⚠️ | The metric can only be calculated once the normal session length has elapsed on the majority of devices. |
| Handles expected vs unexpected reboots | ✅ | Expected reboots performed by the user are properly ignored. |
| Not susceptible to a small subset of misbehaving devices skewing the metric | ❌ | One device resetting often will cause the metric to skew lower. |
| Works well with session-based devices | ✅ | It’s designed for sessions! |
Crash Free Hours (Stable Hours)
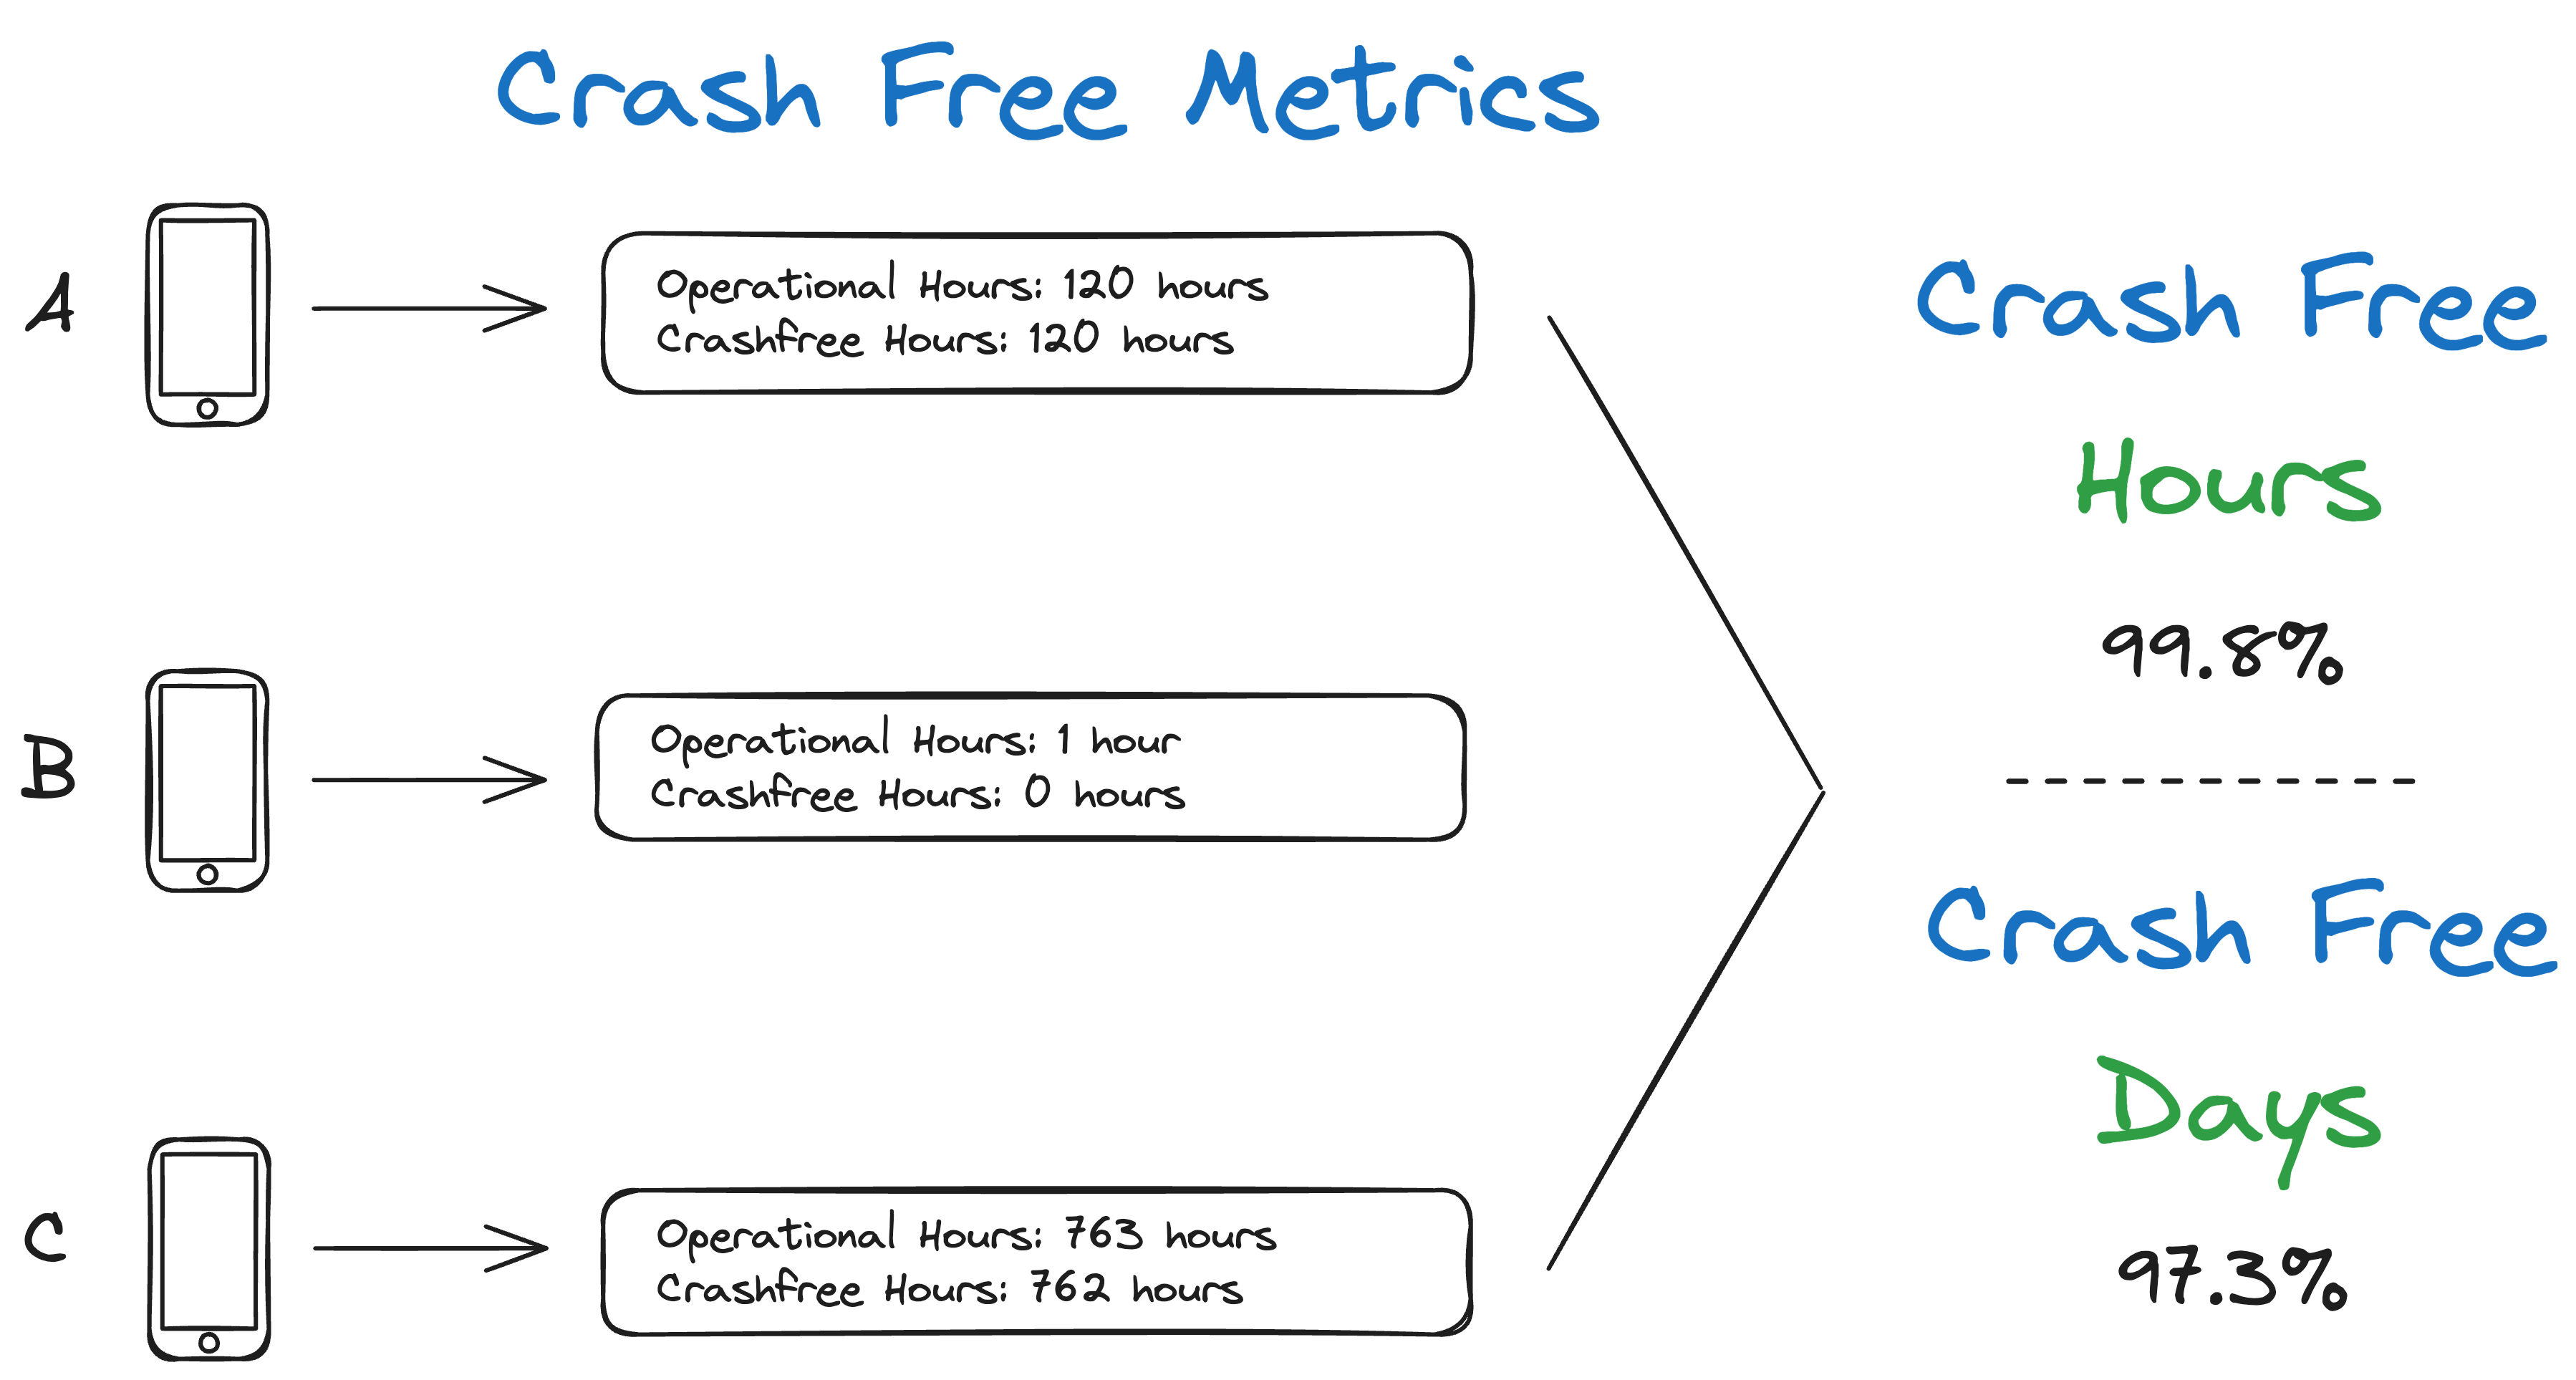
When IoT devices are not operating within sessions, they typically run 24 hours a day, 365 days a year. They constantly monitor and react to their environment, and they ideally never turn off or break down. This is the type of device I’m most familiar with, having worked in the wearables space building smartwatches that never came off our user’s wrists except for charging.
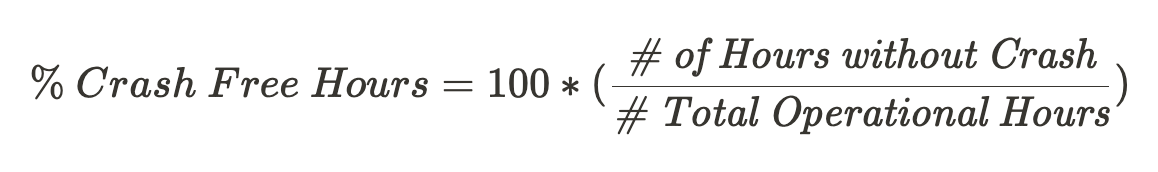
Calculating crash free hours is about as simple as crash free sessions. Divide the total number of hours without a crash by the number of operational hours and convert it into a percentage.
The best part of crash free hours is that it prevents devices that are rebooting multiple times per hour from skewing the metric drastically. If a device crashes once a minute for an hour, it does not report 60 crashes. It only reports that it was not a crash free hour.
The second reason I like crash free hours compared to the other metrics is that you don’t need to wait very long until the data can be aggregated - just a few hours! This is because the metric is gathered hourly instead of daily, by sessions, or after rebooting.
The one thing I don’t love about crash free hours, is that even a lousy rating (99% for example) feels like a good stat to the uneducated. This can be solved by either education or inverting the stat and essentially showing MTBF (but this time, with devices crashing a lot, not wreaking havoc on the metric).
- 95% crash free hours = 1 crash a day
- 99.4% = 1 crash a week
- 99.9% = 1 crash a month
Collection
The Memfault firmware SDK has had crash free hours built-in for the last year, and the Memfault product can calculate crash free hours out of the box! The metric is also currently being implemented into the Android and Linux SDKs and will ship soon.
For those not yet using Memfault for firmware reliability, here is some pseudo-code that can help explain best how to capture crash free hours.
// persisted_time_without_crash is saved in noinit RAM
static uint32_t time_without_crash = persisted_time_without_crash ?? 0
static uint32_t crash_free_hours = 0
static uint32_t operational_seconds = 0

void metrics_on_second__callback(void) {
  time_without_crash++;
  if (time_without_crash >= 3600) {
    crashfree_hours++
    time_without_crash = 0
  }
}

void metrics_on_crash__callback(void) {
  time_without_crash = 0;
}

void metrics_on_shutdown__callback(void) {
  // Since it's not a crash, we'll save
  // the value for the next boot
  persisted_time_without_crash = time_without_crash;
}

void metrics_on_heartbeat__callback(void) {
  heartbeat.operational_hours = floor(operational_seconds / 3600);
  operational_seconds = operational_seconds % 3600;
  heartbeat.crash_free_hours = crash_free_hours;
  crash_free_hours = 0;

  // serialize and send metrics
})
In summary, for every hour that ticks by, we’ll increment crash_free_hours by one. If we safely shut down, we’ll save our current second counter. If the device crashes, we’ll reset it. When metrics are collected, we’ll send off both crash_free_hours and operational_hours so that the metric can be calculated for the entire fleet of devices.
Summary
| Criteria | Rating | Notes |
|---|---|---|
| Can assess the reliability of devices & software quickly after firmware updates | ✅ | Since the metric is collected and sent hourly, a few thousand hours from a few thousand devices and provide signal within a few hours |
| Handles expected vs unexpected reboots | ✅ | Expected reboots performed by the user are properly ignored. |
| Not susceptible to a small subset of misbehaving devices skewing the metric | ✅ | 1 crash is the same as 100 within an hour. |
| Works well with session-based devices | ⚠️ | Some devices have very short sessions, so it might take a long time to gather up an hourly data point. |
Crash Free Devices
Crash free devices is my second favorite metric out of the bunch. This is because device manufacturers typically care about impacted users the most, and this stat will tell you exactly that.
If 10 out of 1000 devices crash 100 times a day, that’s not that bad, as only 10 users are impacted. However, if 1000 devices each crash once per day, that’s catastrophic! It means that every user of the device could be annoyed about the device crashing at an inopportune time.
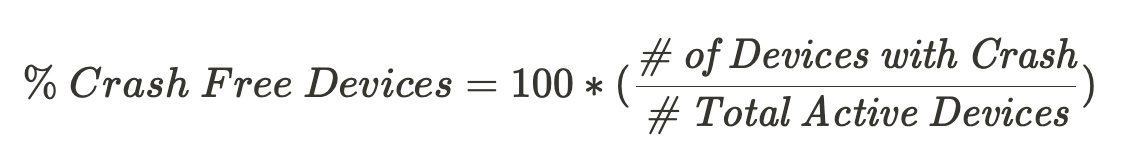
To calculate crash free devices, you need three things: a chosen time window to aggregate the data by (daily, weekly, or monthly), the number of devices that experienced a crash in that window, and the total number of devices active.
Each device will send data points about when it crashed, and the heavy lifting is done in the data warehouse. One can use the following SQL query to calculate crash-free devices in the last 7 days.
SELECT
    count(DISTINCT device_id),
FROM
    device_crashes
WHERE
    crashed_at > NOW() - INTERVAL '7 days';
Below is an example of what the data from the device might look like and the resulting stat.
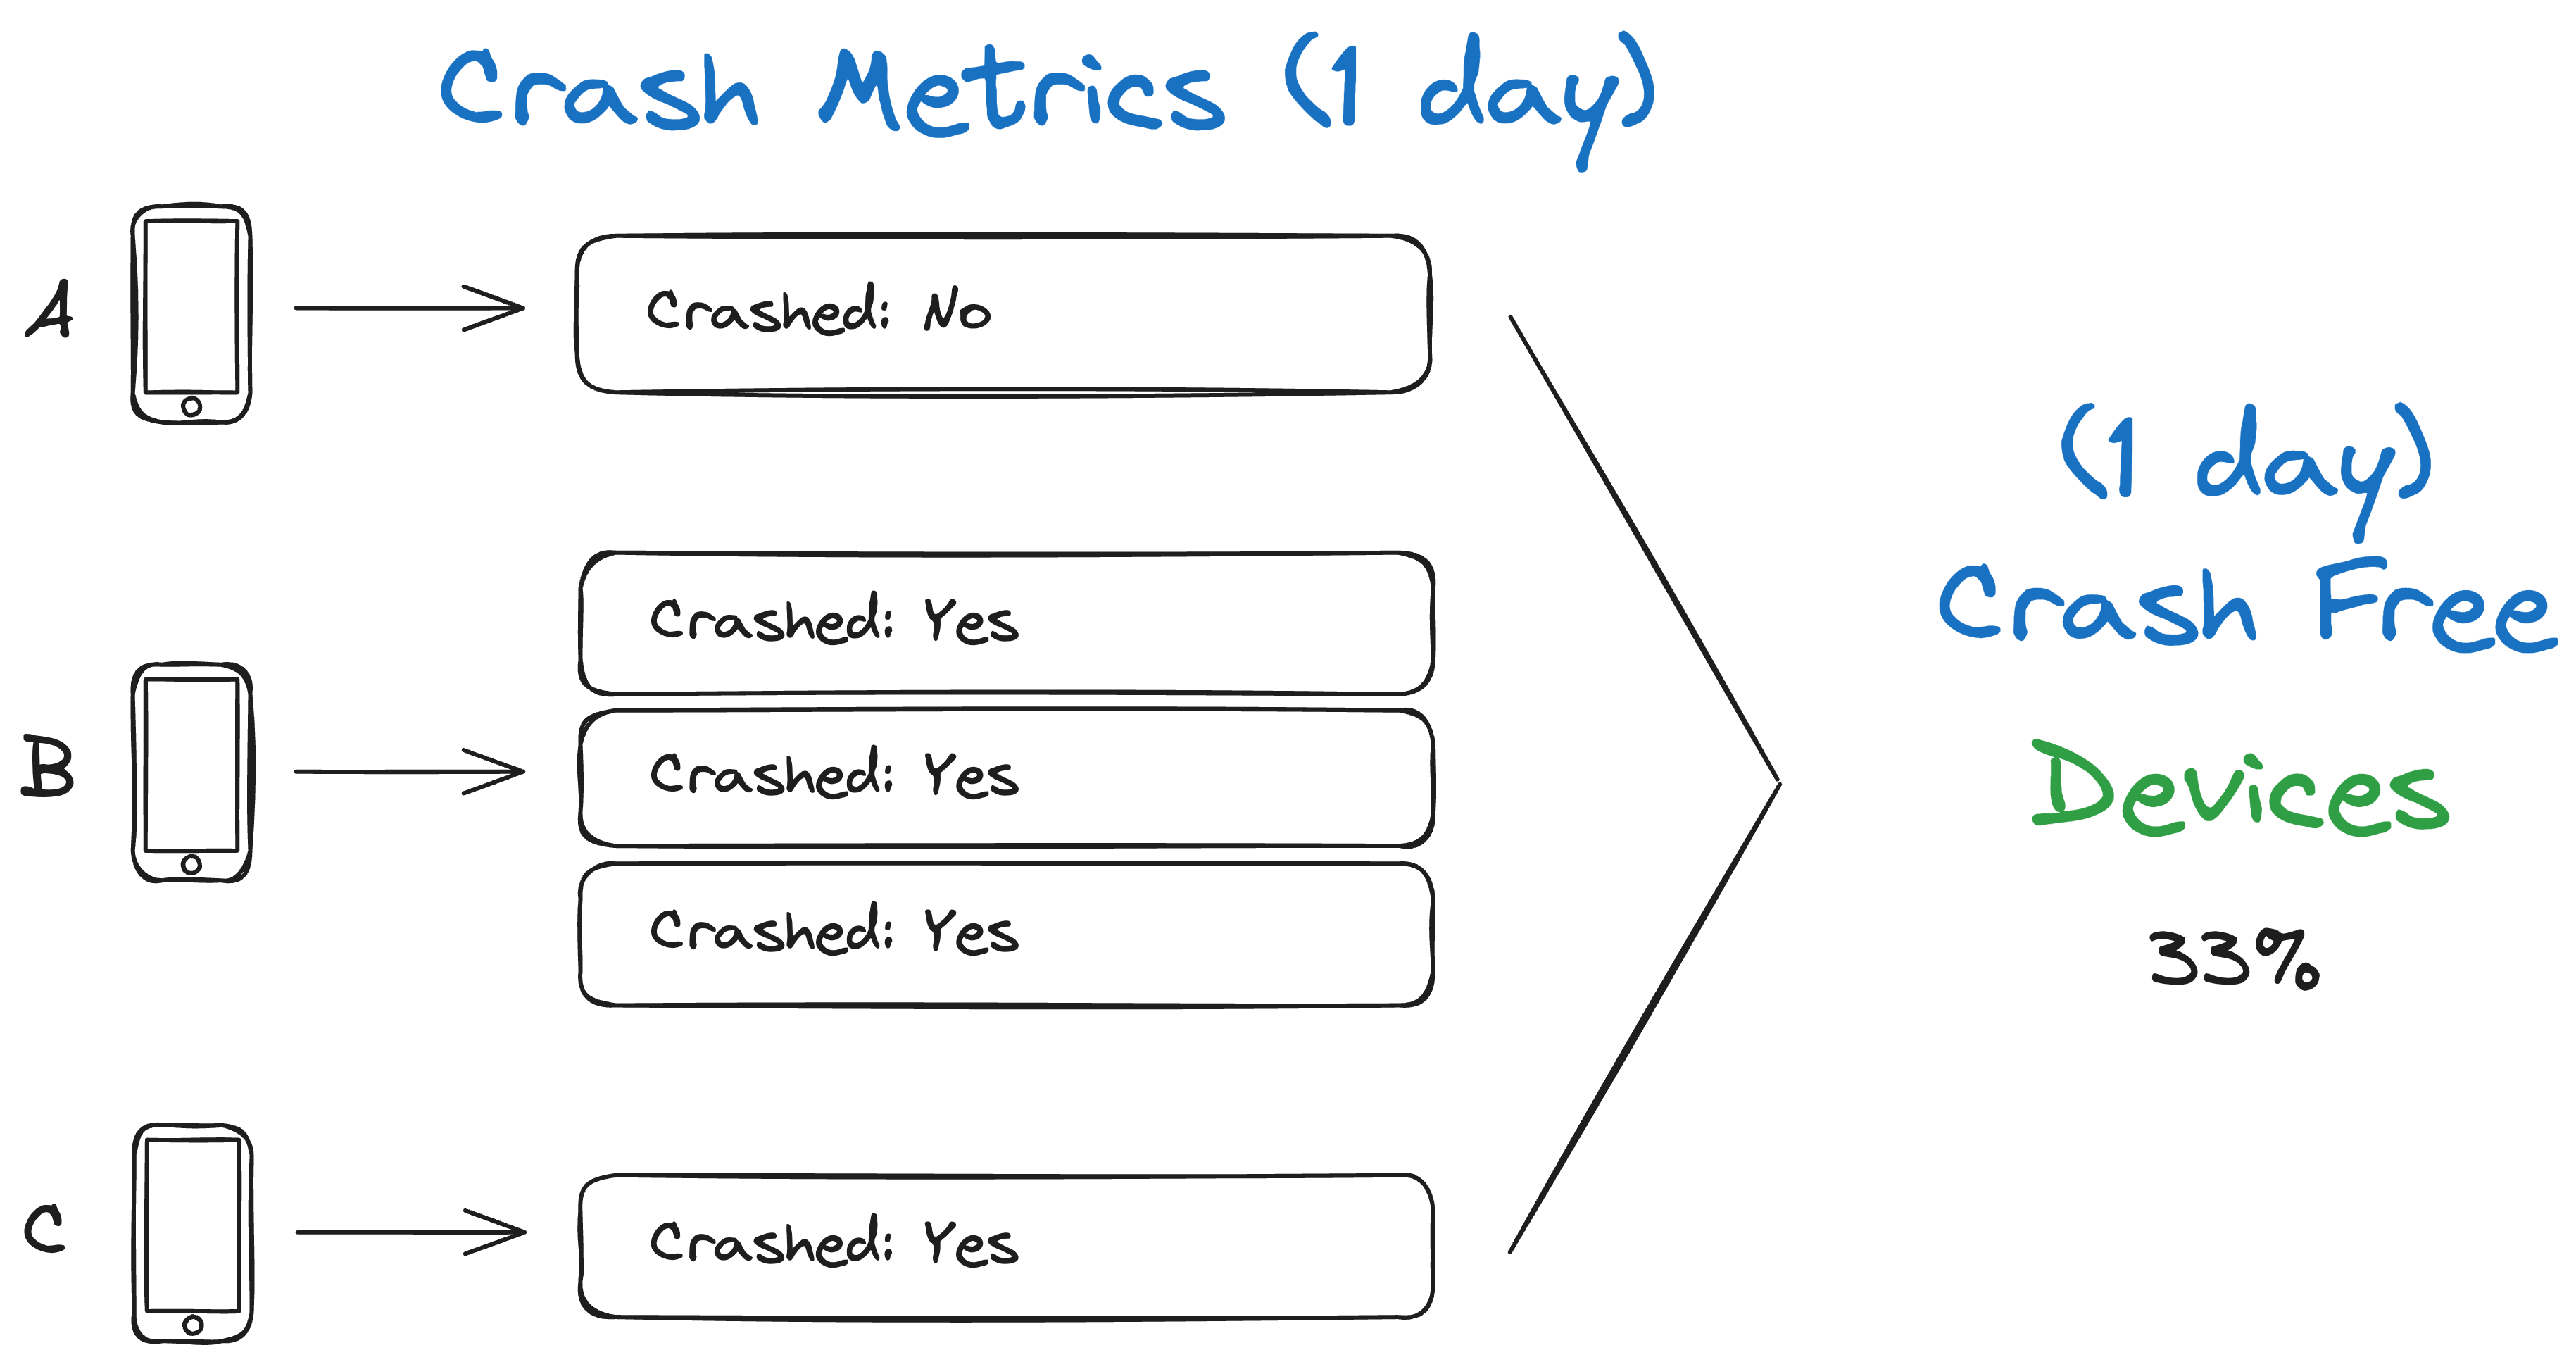
This metric will show your firmware’s true reliability score, as it only takes one crash on each device to get to 0%! The other metrics are not this sensitive, so only show this metric to your manager and CTO if you are committed to improving it.
Collection
Upon boot, send whether the device reset due to a crash and a time stamp to help place the crash into the correct day bucket.
Summary
Below is the standard comparison chart, but there is one final note about crash free devices that I need to make. This metric does not work well to compare device reliability between firmware releases. To determine whether your firmware update is better or worse than the one it’s replacing, use a different metric.
| Criteria | Rating | Notes |
|---|---|---|
| Can assess the reliability of devices & software quickly after firmware updates | ⚠️ | To get crash free devices over N days, you need to wait N days, so it’s slow. |
| Handles expected vs unexpected reboots | ✅ | Expected reboots performed by the user are properly ignored. |
| Not susceptible to a small subset of misbehaving devices skewing the metric | ✅ | 1 crash is the same as 100 over N days. |
| Works well with session-based devices | ✅ | No issues. |
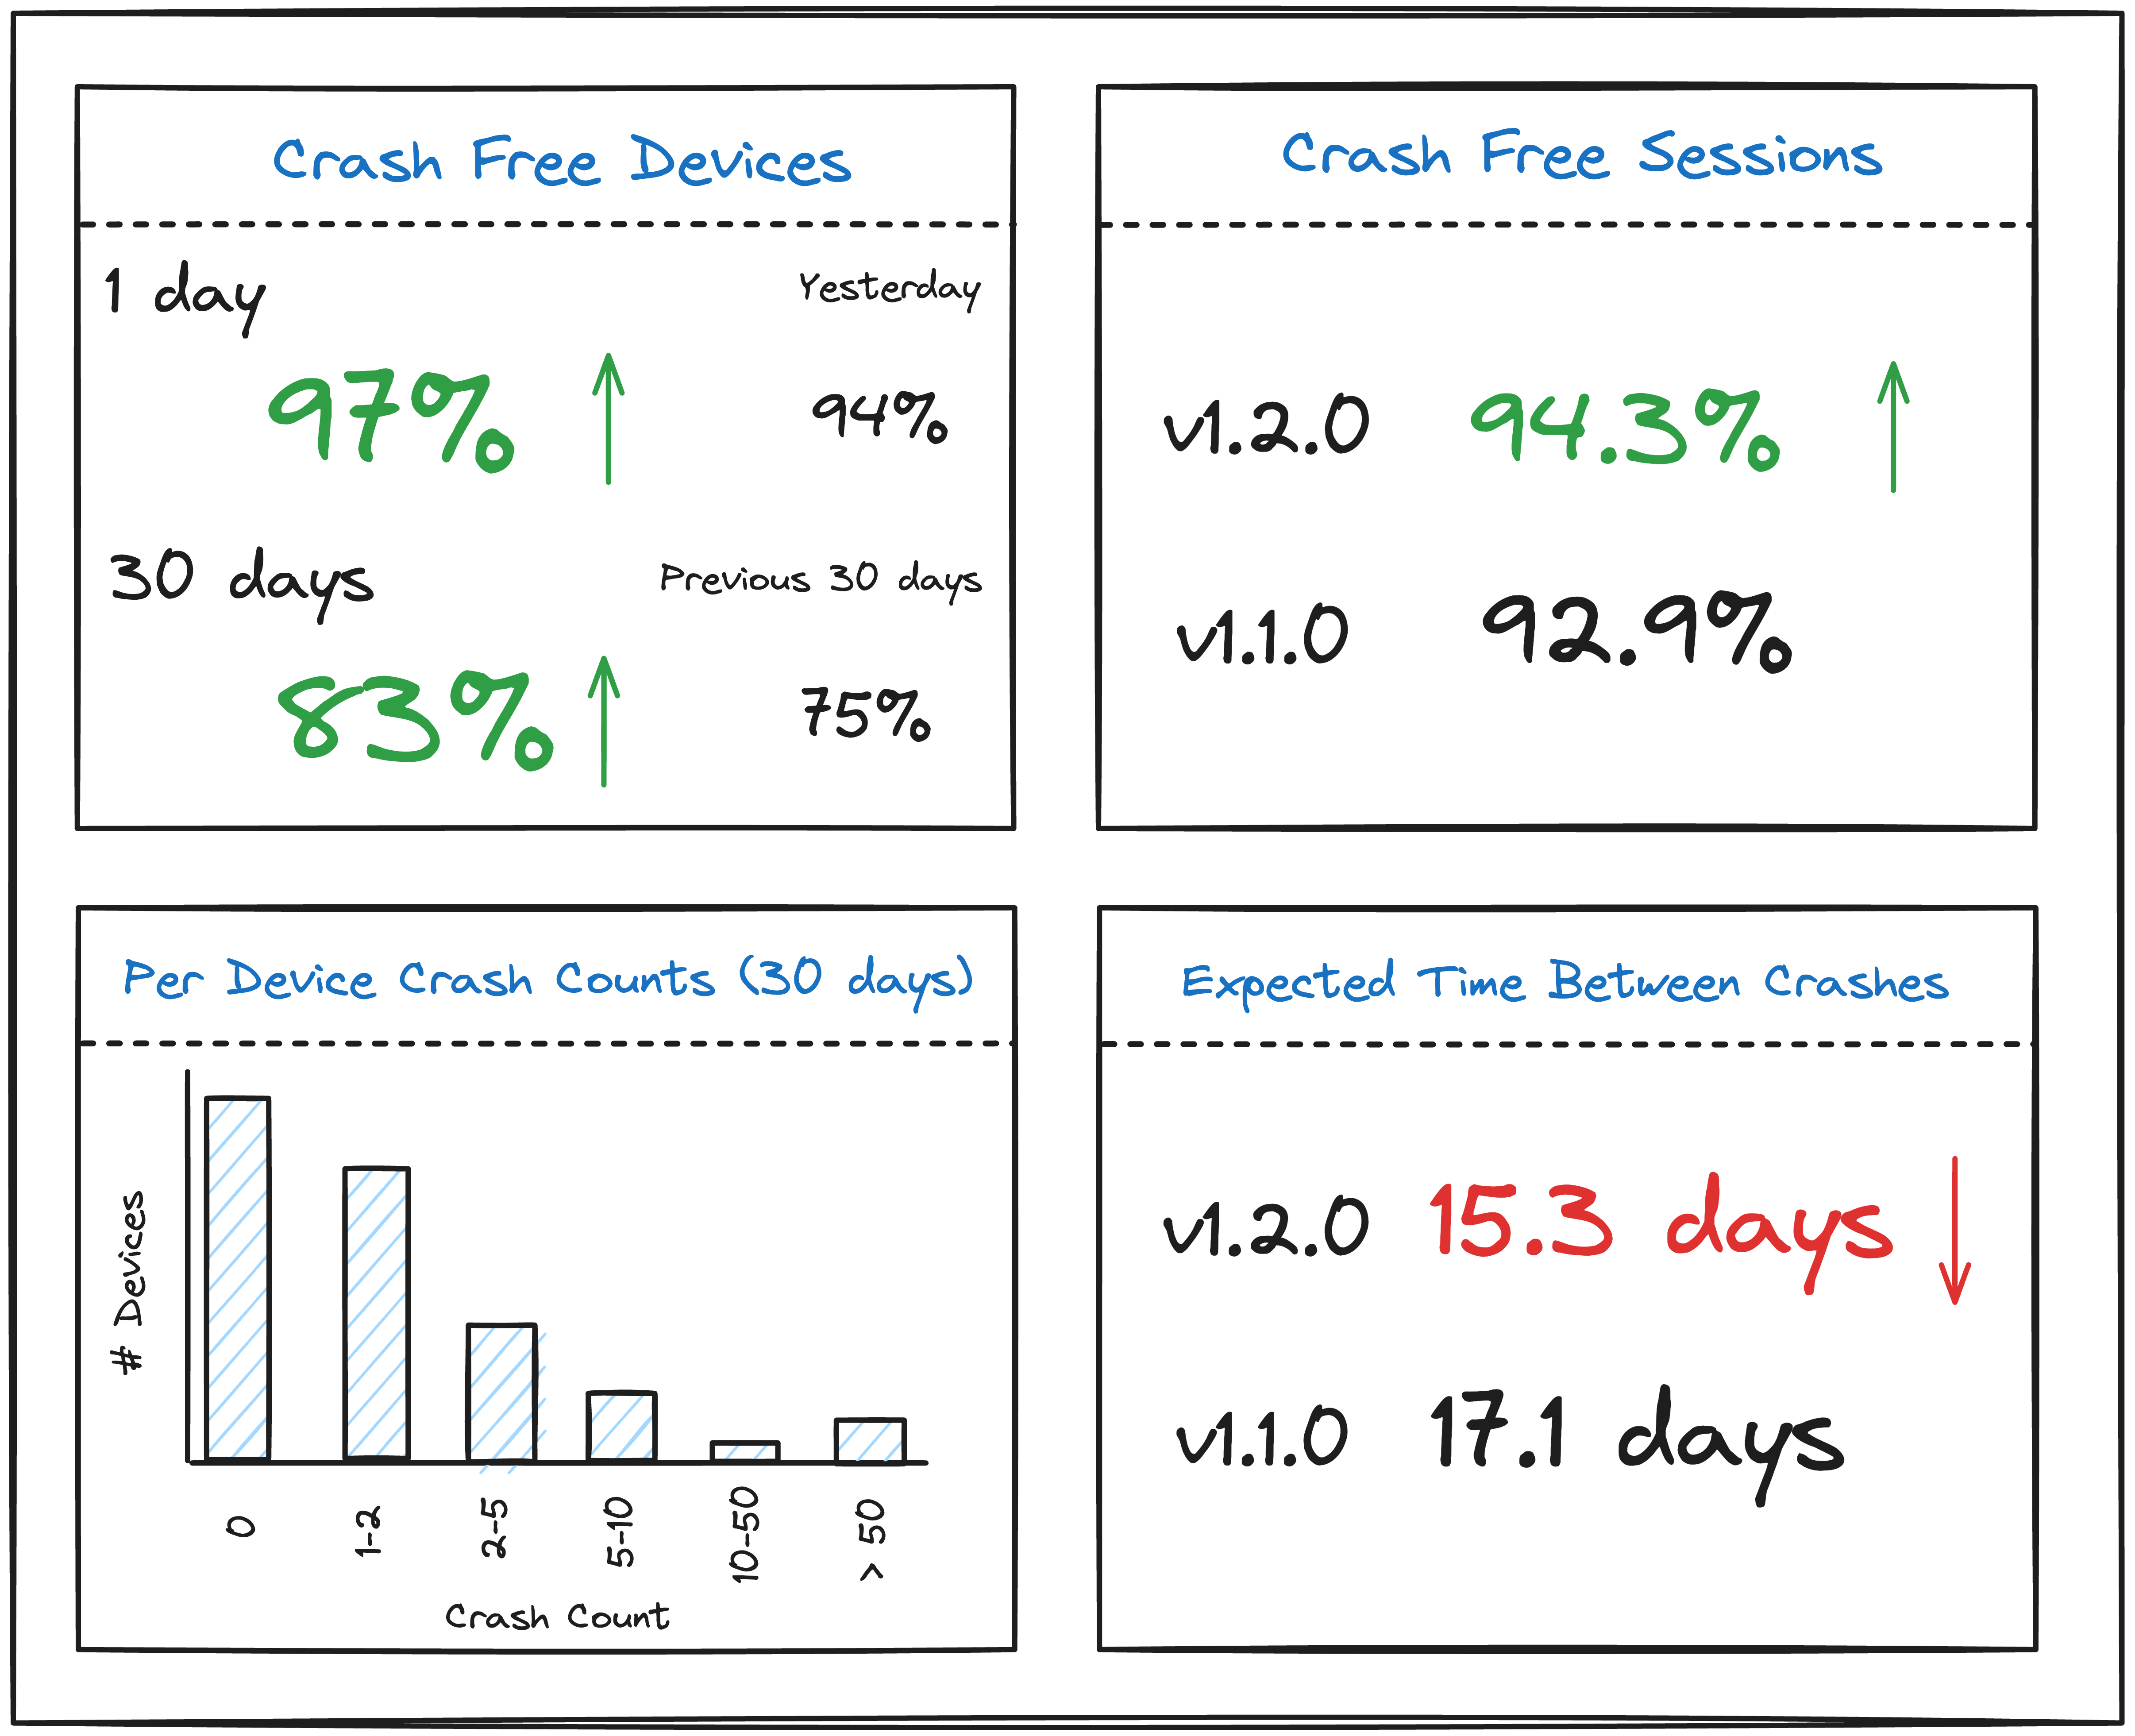
Metrics to Give the Boss
If I were Head of Hardware or Firmware at an IoT company, I would want the following information in real-time:
- How many devices have experienced a crash in the last 1 day and week? A device that crashes directly impacts the customer experience, and a crash that occurs on a large percentage of the fleet might crater (gasp!) Amazon review ratings or the perception of quality. Shoot for 99% crash-free devices as a north star.
- Of all sessions on firmware version X, how many end in a crash? Shoot for 99.9% crash-free sessions - it’s the standard in the mobile application world.
- How long, on average, for firmware version X, does it take for a device to experience a crash? If devices crash more than a few times a month, users will notice and care.
This information lets me know when the firmware is stable enough to release to beta users or the entire fleet. I would also like to know whether new firmware versions that are shipped are improving reliability or making it worse. If I see that many devices are experiencing crashes, I could then roll back the firmware release, gather more metrics and coredumps from the updated devices, and create a subsequent release with the necessary fixes.
Fixing the Crashes
Once you take steps to monitor how often devices in the field crash, you’ll see that the number is non-zero. It might be a relatively small number of crashes, or it could be astronomical and surprising. Regardless of the result, you’ll need to figure out how to fix the firmware crash. Here are a couple of articles to help you out with this stage:
- Embedded Artistry - Ending the Embedded Software Dark Ages: Let’s Start With Processor Fault Debugging! This article talks about how to collect coredumps from the field in a roll-your-own manner.
- Interrupt - How to debug a HardFault on an ARM Cortex-M MCU. This post is relevant once a crash is reproduced locally or captured in a coredump.
- Interrupt - Using Asserts in Embedded Systems. To help track down memory corruption issues, stack overflows, and watchdogs, use asserts liberally!
Tracking Failures That Aren’t Crashes
This article is focused on tracking crashes to assess reliability and stability. However, what is great about these fundamental metrics is that they can apply to any failure your company wants to monitor closely.
For example, if my company makes an IoT weather sensor that needs to send data back every minute, I will want to track how often it fails. Instead of recording crashes as a failure, I would record the number of times the device fails to send a weather-related reading. Then, I would calculate “weather sync failure” free hours and “weather sync failure” free devices.
As long as there is an event that can fail, and you have a count of the number of attempts, you can use this methodology to measure any time of failure!
Towards Stable, Crash Free Firmware
By collecting and constantly obsessing over these metrics at Pebble, we produced reliable firmware despite the complexity of being crammed into a 1MB flash part full of C code. Our firmware still crashed occasionally, but our average was around 14 days between crashes, which was pretty good.
I hope this post was a good primer on measuring device reliability related to crashes and that you have the information and tools to get these metrics into your firmware and data warehouse.
If you’re feeling overwhelmed by having to build all the intricate libraries in hooks in firmware, the serialization and protocol, processing and data pipeline, SQL queries, and dashboarding-fu necessary to surface these stability metrics, reach out to us at Memfault. We’d love to help or steer you in the right direction.
See anything you'd like to change? Submit a pull request or open an issue on our GitHub
 Tyler Hoffman has worked on the embedded software teams at Pebble and Fitbit. He is now a founder at Memfault.