Understanding Battery Performance of IoT Devices
I’ve been a firmware engineer at two wearable companies in the past, Pebble and Fitbit, and there was always one class of customer support tickets and user complaints that never went away: issues around battery life. It was a constant game of whack-a-mole with every new firmware version introducing a battery regression.
Battery life is essential for many products we use in our daily lives: our phone, car, vacuum, watch, headphones, ring, mouse keyboard, and more are all becoming battery-operated devices. Although some of us might want to keep these things plugged in, an overwhelming number of customers are demanding wireless and battery-operated devices, so hardware companies are selling them.
The ideal situation is that for every new hardware release, each new firmware update, and for 99% of customers, there are no surprises around battery life.
In this post, I’ll cover how to start thinking about collecting metrics that contribute to battery life, how to dig into this data for individual devices, and finally how to aggregate all metrics from devices in the field to accurately predict the battery life of devices in the field for a given firmware release. All of these abilities will help projects optimize battery life and combat issues quickly when they arise, whether you have ten or a million devices in the field.
📺 Watch the Webinar Recording
Do you tend to favor video content over written materials? This topic was also the subject of a Memfault Webinar: An Empowering Endeavor - Predicting and Improving Device Battery Life.
Table of Contents
- Why is battery life is important
- But batteries are hard
- Measuring power consumption of the hardware
- Brief Primer on Metrics
- Metrics that typically contribute to power consumption
- Battery metrics for a single device
- Battery Life Metrics for an entire fleet
- Comparing battery life across software versions
- Best Practices
- Using Memfault as your monitoring stack
- Conclusion
Why is battery life is important
Users of IoT devices expect them to be set-it-and-forget-it devices. Once connectivity is set up and the product is onboarded, that should be it except for occasionally changing out the batteries. Batteries should then be replaced or recharged as infrequently as possible, and they should last the expected number of days. At Pebble, the packaging said our 130mAh watch should last 7 days, so that was our target. If a watch lasted less than 7 days consistently, an RMA was warranted.
It’s also important that the battery behaves in ways the customer expects. It was one thing for the Pebble watch to linearly drop from 100% to 0% over 6 days. It was an entirely different issue if the watch reported 90% for 3 days then dropped to 10% and died on the 4th day.
Users expect batteries to be reliable and not lie to them, but as engineers who work with hardware often, we know this isn’t the case. Batteries are hard, and it’s our job to make them seem reliable.
But batteries are hard
It’s true. Batteries make our lives a little more miserable for a variety of reasons. To start, to measure the remaining capacity left in a battery, we typically only have voltage, which is a brittle measurement.
Here are just a few other ways in which batteries will be one of the most painful parts of building a hardware product.
Battery performance changes with temperature
Batteries have different properties when acting under different temperature conditions. For example, when Li-ion batteries are operating under cold temperatures, performance is greatly reduced, as shown in the chart below.
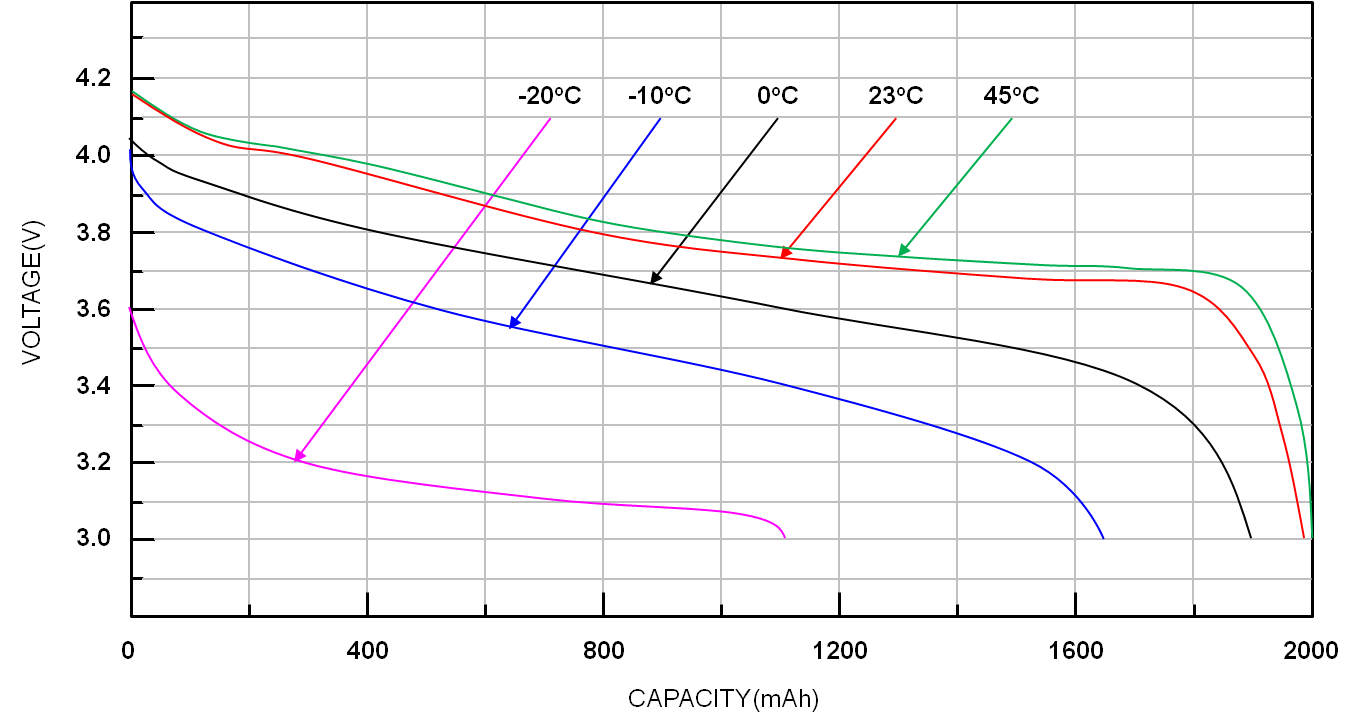 Image: Ricktek
Some batteries may also be damaged from overheating and some by charging when too cold! They are temperamental creatures, and it’s best to try and give them a stable operating environment if possible, but that is a pipe dream.
Thankfully at Pebble, the devices we worked on were almost always on a wrist so we had a good form of temperature stability.
Batteries behave differently under load
The voltage reported by batteries may differ depending on the current draw from the batteries during the time of the measurement, as you can see in the chart below for Li-ion batteries.
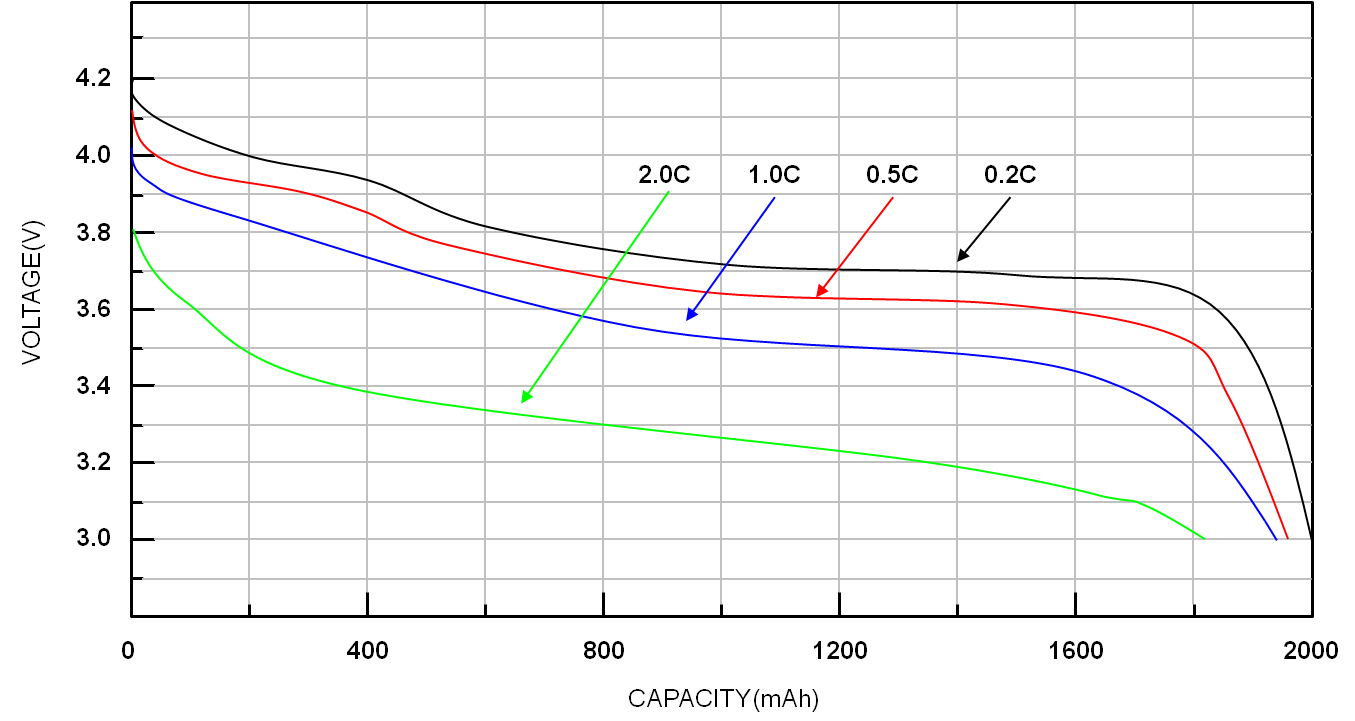 Image: Ricktek
It’s ideal to measure the voltage during known or expected amounts of current draw.
For our Pebble watches, we did two things. First, we tried to optimize when we sampled the battery voltage to make sure that there was no massive current draw at the time of the reading. The biggest current draws were during LCD backlight usage, vibe motor events, and intense CPU and graphics computations (such as Heiko Behrens’s Intrinsic Gravelty demo1).
Second, for each battery voltage reading, we reported and used in calculations, we sampled the voltage many times in a short period and took the average of the samples. This helped filter out any noise from high power draws and low voltage readings that might have skewed our readings. In our case, the vibe motor and backlight display were the two that would really mess up our voltage readings.
Not all batteries are equal
There will be both good and bad batches of batteries purchased from a vendor. Some might also be exceptional super-hero batteries, and others might barely hit the threshold of the minimum Ah ratings. That’s just how it is, especially when projects are counting cents on their BOM.
Also, as you likely already know, batteries age over time and lose capacity with the number of cycles they go through. At Pebble, we took this into account by slowly updating the battery curve over time for different revisions of the hardware and then year over year to make sure that we tried our best to account for battery aging.
Measuring power consumption of the hardware
Let’s start trying to build a model for how long our hardware device will last when operating on battery power. The first step to take is to measure how much power the hardware consumes at a base level. This is when the device is operating in all three major states: minimal capacity, normal capacity, and under strenuous load.
Having all three of these power consumption profiles help paint a picture of how much power this piece of hardware may consume, and therefore how quickly it might drain a battery.
Power Profiles for each component
The first step is to create baselines for how much power each component will consume over time. Although the spec sheets from the hardware vendor are great and will generally tell you power consumption - they aren’t always accurate, and different components from different batches will have different power usage characteristics.
The general steps to accomplishing this are:
- Ensure that your development boards have power rails so that you can isolate many of the components and you can easily attach probes to them.
- Get a nice multimeter that can measure µA and mA.
- Write a special firmware that instruments a single component in various power modes, and determine the current draw for each mode. This should be the simplest possible firmware and ideally only contain driver code.
- Rinse and repeat with every component that could have a big impact on power consumption.
For example, the accelerometer was a component in a wearable device that could consume a lot of power if left in the wrong state for periods of time. We wrote a firmware that would set it to different sampling rates and record the current consumption and then used this to determine at what sampling rate we could keep the accelerometer while still achieving our desired 7-day battery life.
State of Charge (SoC) over Time
Once we determine whether or not our hardware can successfully meet our minimum requirements for battery life, now we need to put this to the test from the other direction. The primary thing we’ll look into now is how to measure the state of charge (SoC) of the battery over time to ensure that the device can last as long as required.
One of the most common and simplest ways to measure the current capacity within a battery, or the SoC of a device, is by measuring the voltage of the battery during a known and consistent power draw, but it’s not the only way.
Coulomb Counting with Fuel Gauges
At Pebble, we had a fuel gauge on one of the watches. A fuel gauge is a nifty hardware component that can indicate the battery’s SoC and health. It can understand the battery’s current capacity in two ways: measuring the voltage from the battery and Coulomb counting, which measures how much current passes in and out of the battery over time.
For devices with large batteries, such as phones, e-mobility, cars, etc., fuel gauges are probably the way to go. They are reliable, and you can hand off the difficult task of measuring the current battery’s capacity to a device that was built to measure it.
So with all the praise of fuel gauges, why spend so much time talking about using voltage to measure a battery’s capacity? Because at Pebble, we were unable to use the fuel gauge, as it consumes more power than we would have liked. There are thousands of products out there that might run into the same issues, especially as people are wanting to build sensors and IoT devices that last months and years on small batteries.
If you happen to be lucky enough to be able to use a fuel gauge and happen to be using Zephyr RTOS, definitely check out their new Fuel Gauge API2, announced recently in Zephyr v3.3.
State of charge with voltage
This is most commonly what companies have, as it’s very simple to get from the battery system and doesn’t consume any extra power. The problem with only tracking the voltage is that it’s not easily human-understandable, does not increase or drop linearly, and will change under operating conditions, as mentioned above.
We need something better if possible.
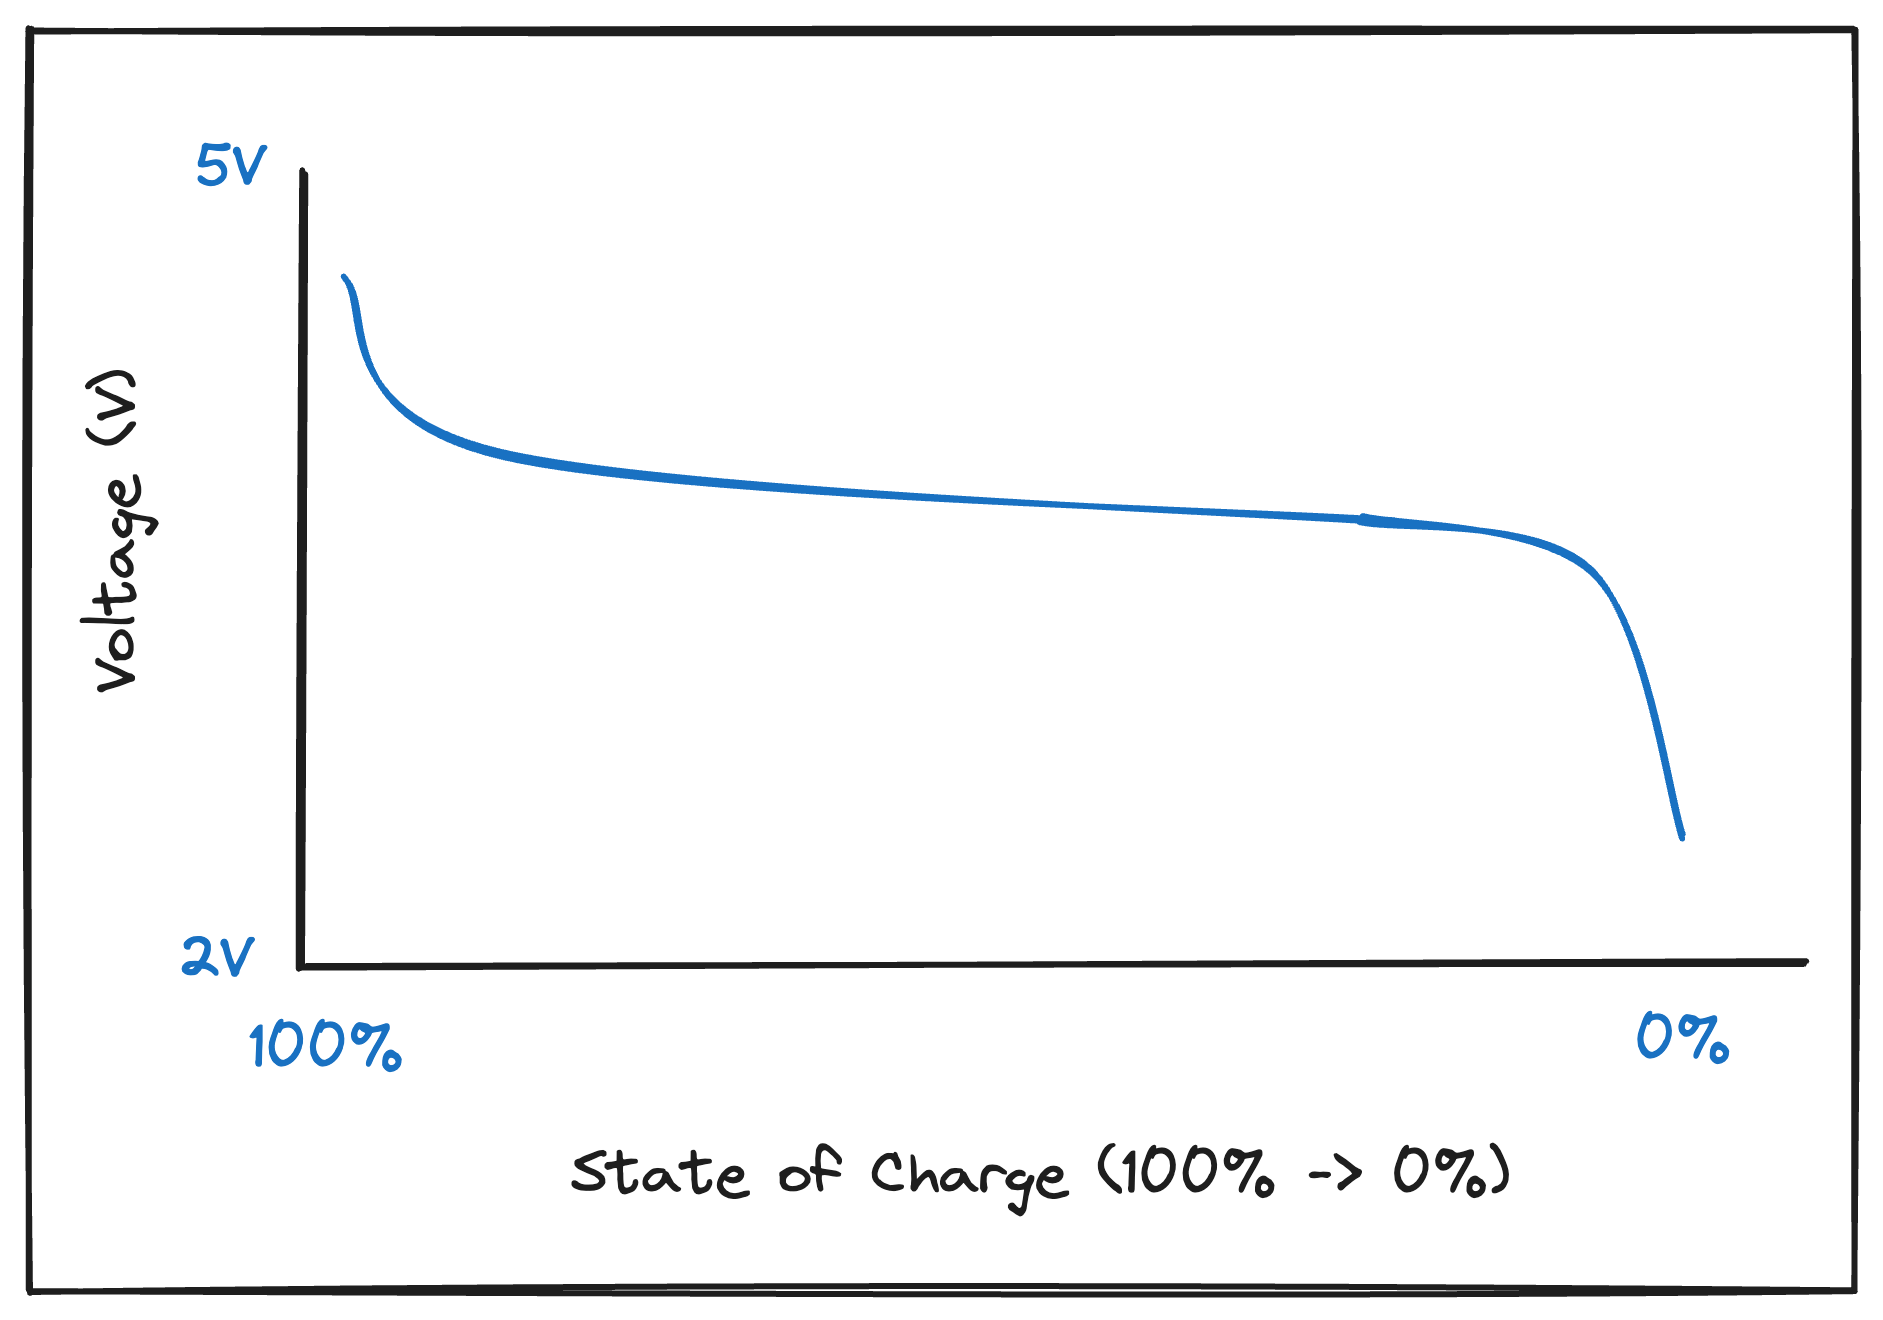
State of charge with voltage and battery curve
One thing that can be done to help convert voltage to a percentage is to come up with a battery curve. A battery curve is simple: it’s a map between a battery’s voltage and the relative percentage that likely pertains to that voltage. Products also usually have both a charge and a discharge curve.
A battery curve is what companies will have after they have a good understanding of their battery’s properties and enough data to generate a curve. It is more easily understood by customer support teams and engineers that aren’t directly involved with the battery subsystem.
A nice tool that I came across this year at Embedded World was Qoitech3, which builds a product to help users build charge and discharge curves4 under different environments. I believe their product is well worth the money if it can help companies translate a cryptic voltage reading to a percentage that everyone can understand.
Brief Primer on Metrics
Before delving into the subsequent sections concerning capturing and aggregating metrics around battery life, let’s take a moment to briefly discuss what a metric is. It’s essential because I’ve encountered firmware engineers who haven’t given them much consideration.
A metric is a measurement captured at runtime, and the process of combining large numbers of metrics and calculating statistics is known as aggregation.
You can capture metrics about almost anything in your system. Common things that I like to measure in firmware are task runtimes, count of connectivity errors and time connected, peripheral utilization for power estimation, and more. Once all of these metrics are flowing out of a device and into a data warehouse, you can uncover trends in them!
However, capturing and aggregating metrics is not always as easy as it sounds. I recommend checking out a few sources if you want to learn more about best practices for collecting metrics.
- Interrupt - Firmware Heartbeat Metrics, which advise pre-aggregating metrics on the device and sending them up at fixed intervals.
- Memfault Webinar - The Power of Metrics - Monitoring Battery Life, Connectivity, Power Consumption & More, which covers which metrics are most useful to capture to help with connectivity and battery life.
- Memfault Docs - Data Serialization Overview, which covers how Memfault built its event serialization layer to make it as easy as possible to add new metrics and compress them to be as small as possible.
One of the most important strategies from the above content is that these device and firmware metrics are typically sent up in a regular heartbeat, which is sent at a fixed interval, usually an hour, and ultimately deposited into a data warehouse.
For example, if you want to track BLE disconnections, you send the number of disconnections that occurred during the interval and only that interval. Same thing with how long the BLE chip was on. Send the number of seconds during the interval it was on. By generating metrics at a fixed interval, it makes it trivial to perform aggregations on them since it’s just simple math.


Take the total time connected and divide by the number of heartbeats, and you get the average total time connected per heartbeat.
But we aren’t here to talk about Bluetooth disconnections, let’s talk about power!
Metrics that typically contribute to power consumption
Here’s a semi-exhaustive list of items that I’ve tracked in the past that would help paint a picture for me and my colleagues about what was consuming battery life.
Connectivity & networking
This would cover any sort of wireless radio, such as Wi-Fi, LoRa, Bluetooth, ZigBee, LTE, etc.
- packets sent & received
- bytes sent & received
- number of connections and disconnections
- time spent in each state (advertising, connecting)
- radio strength & power settings
- throughput
- number of retry attempts
Peripheral usage
Here, we try to measure any peripheral that might consume significant amounts of power.
- sensor on/off time (acceleromter, gyroscope, GPS, cameras, compass, etc.)
- actuator on/off time
- actuator total distance
- display & backlight on/off time
- number of display refreshes
- camera on/off time
- storage read/writes/erases
CPU & Code usage
- CPU awake, sleep, and deep-sleep time
- time spent running each task in the system
- time running power-hungry blocks of code
- boot time
- number of logs written
- time spent blocked on mutexes or queues
- number of context switches to detect thrashing
Battery metrics for a single device
The most important use case of metrics is being able to debug individual device issues that come up, either internally or via customer support. I see most companies start with logs to diagnose customer issues, but using metrics is where the real value comes in. You can see visualize and collect much more data, especially if the bandwidth limitations are strict (satellite connections, LTE, etc.)
For measuring battery life, the most important metric to capture is, of course, the SoC of the device. As stated above, this is typically sent first as a voltage reading, and eventually as a percentage once a battery curve is adopted. With both of these plotted alongside other metrics, you can quickly and easily see what metrics contribute to battery drain.
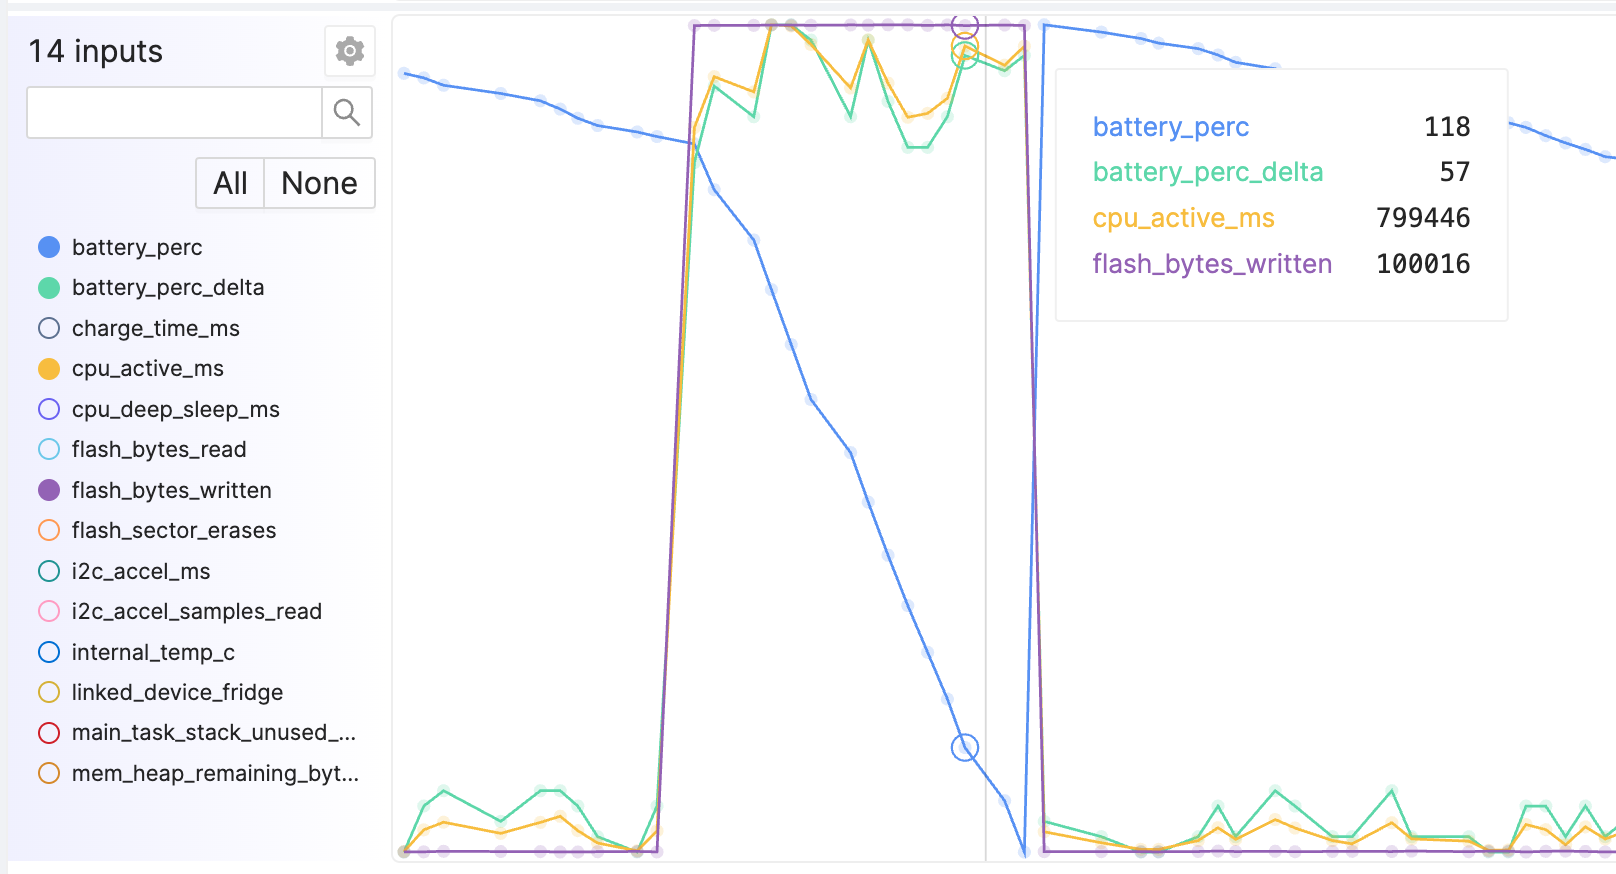
For instance, in the example above, our battery SoC % (blue line) is dropping rapidly. This can be likely attributed to the fact that the CPU is much more active during this window than it normally is, and that might be related to the number of bytes being written to the flash chip.
Knowing this, we can start digging into the other existing metrics, or adding more metrics! We should start capturing metrics for each module that writes to the flash, or maybe track which tasks are running while the high CPU utilization is taking place. You can of course track too many metrics within a single firmware, but that number is honestly really high. With each metric only taking up 4-8 bytes per measurement per hour, I’ve worked on firmware that captures between 50-200 metrics.
As mentioned throughout the article, some projects will only record the voltage and send that as a metric. This works relatively well when digging into a single device, especially if the period of the battery only lasts a few weeks and the metrics can be viewed over the entire time. It is much more advantageous to record a percentage if possible, so try to build that battery curve!
Battery Life Metrics for an entire fleet
Trying to solve all battery problems on a per-device basis will only get you so far. No engineer has time to look at every device’s metrics every day to understand if battery life is getting better or worse over time, or whether a new firmware version introduced a regression or improvement, which is why we need to aggregate these battery metrics across an entire fleet of devices.
At the fleet level with a million devices, average battery life can be very difficult to determine. It can be made easier as long as you follow the do’s and don’ts outlined in the rest of the article and take some inspiration from my previous company’s learnings.
Don’t: Record the state of charge directly
Reporting the battery’s instantaneous voltage or percentage will not be able to be aggregated across the fleet.
Imagine your database receives the following data points from 4 devices each hour. Note that bold means an increase in the SoC percentage.
| Device A | Device B | Device C | Device D |
| 75% | 23% | 92% | 5% |
| 72% | (missing) | 89% | (missing) |
| 67% | (missing) | 85% | 10% |
| 34% | 19% | 100% | 7% |
| 78% | 21% | 97% | 5% |
If this is all put into the database and I had to write SQL to determine the average battery life drop per hour for every device and then aggregate it, I don’t think I would be confident in my abilities to do it, nor would I be confident that the database can compute it over for a million devices for a few thousand data points a piece.
There are also a few other issues:
- Since we are required to calculate the deltas between every SoC reading, it means we can not drop data and all of the data has to be received and processed in order. This fact alone should be enough to scare anyone working in the firmware industry.
- What if a device goes offline for a day or two and comes back with a wildly different SoC? Do we assume a charger was never connected?
- How do we confidently know when a charger was attached?
In the below image, if we were just to report each SoC percentage data point, we would not know about the power bug and the subsequent charge event.

Ultimately, we’re trying to calculate the first derivative of the battery percentage in our database. However, this calculation is susceptible to missing data points, which makes it nearly impossible. There is a better way.
Do: Record the delta of the state of charge
Instead of trying to calculate the first derivative in our database, calculate it on the device! Between two known moments in time, calculate the amount of the battery that was depleted over the interval. There are two ideal units for this metric: a change in percentage or amps if using a fuel gauge.
I also highly advise that you standardize the interval duration to make the calculation even easier. To understand how much simpler the calculation can be, let’s work through our four devices again. Note that bold means an increase in the SoC percentage.
| Device A | Device B | Device C | Device D |
| - | - | - | - |
| -3% | (missing) | -3% | (missing) |
| -5% | (missing) | -4% | 6% |
| -33% | -2% | 15% | -3% |
| 44% | 2% | -3% | -2% |
If all of these readings were during a 1-hour interval (e.g. Device A drained 3% of its battery in the first hour), then we can just add up all of the readings in which there was not an increase in the SoC, and we’ll get something around 6% battery drain on average per hour.
It’s that simple. The same logic and method can be applied if the device is using a fuel gauge. Report the amount of Coulombs consumed per hour, take the average, and that’s how much current is consumed per hour.
Here is a simple code snippet of what I would imagine is the first iteration of this in my C firmware.
static void prv_device_metrics_flush_callback(bool is_flushing) {
    static int32_t s_prev_battery_pct;

    if (is_flushing) {
        // End of heartbeat interval
        const int32_t current_battery_pct = battery_get_pct();
        const int32_t battery_delta = current_battery_pct - s_prev_battery_pct;
        device_metrics_set(kDeviceMetricId_BatteryLifeDrain, battery_delta);
    } else {
        // Start of heartbeat interval
        s_prev_battery_pct = battery_get_pct();
    }
}
This strategy can be applied to a fleet of one device or a large fleet of millions. It worked for us at Pebble! My favorite part about this method is when you are given a delta and a duration of time, it’s trivial to calculate the expected battery life.

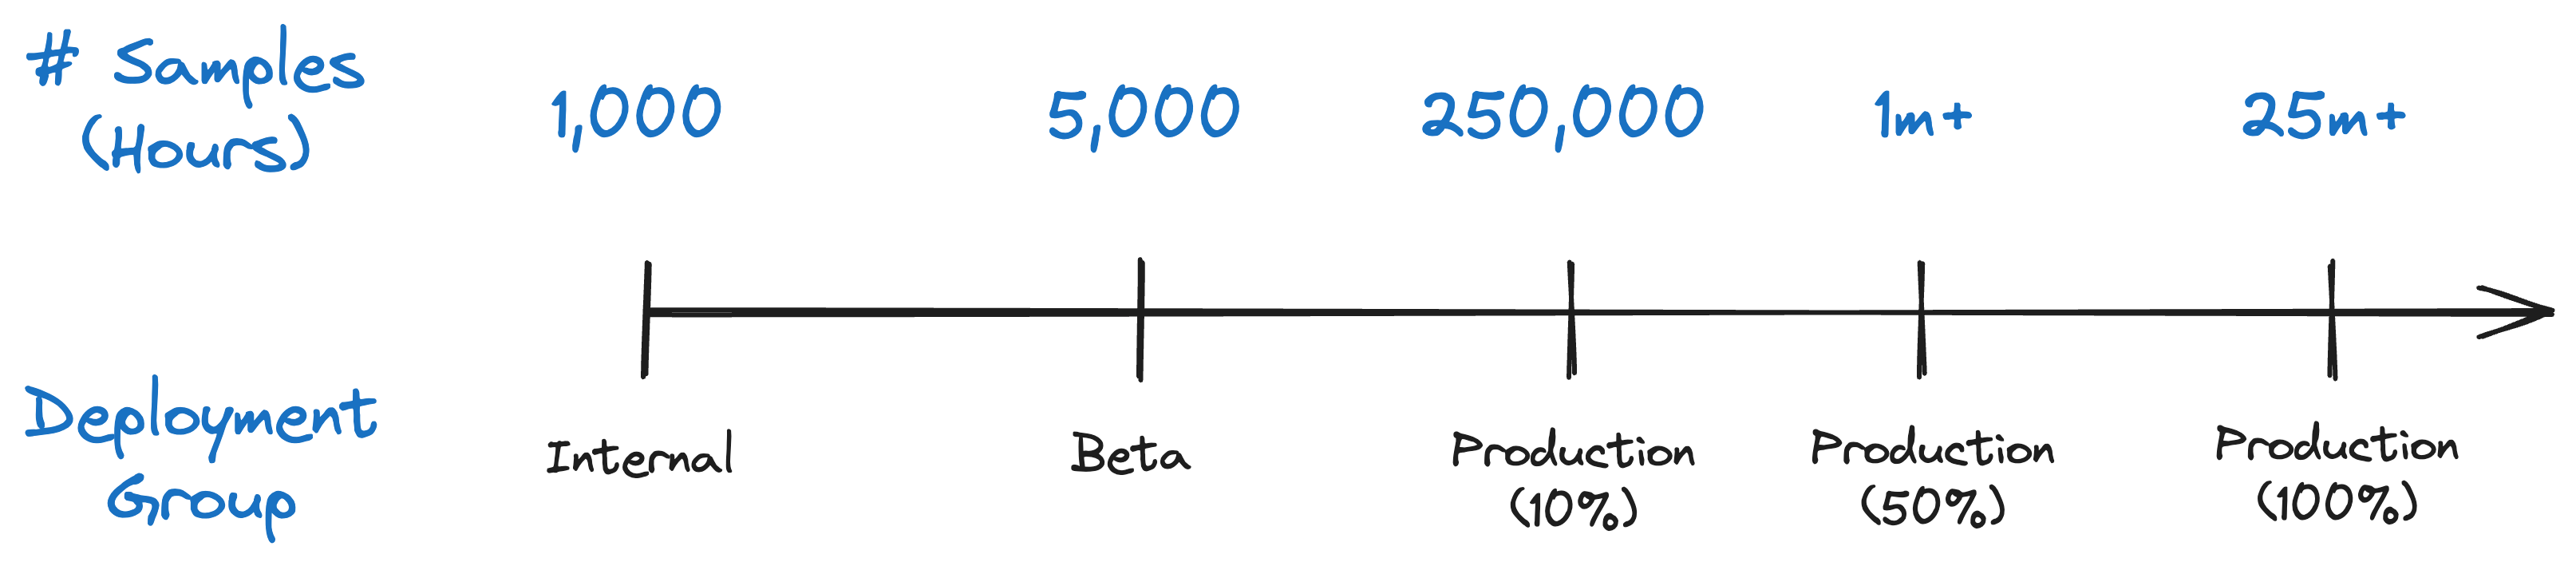
We were able to determine our expected battery life pretty accurately during internal testing and only with about 1-2 days of testing if everyone at the company wore the watch (24 hours * 100 people is 2,400 data points if the battery is measured hourly).
Do note that both SoC and SoC delta should be reported. The first is useful for the per-device data, and the latter is useful for fleet-wide aggregations.
Do: Drop heartbeats with a battery charge event
Notice in the table in the previous section, there were times when some devices had their SoC % increase (noted in bold). That is because a charger was connected during that interval. We also ignored them when computing the average battery drain. This was essential because we only want to add up the intervals in which the device was operating normally and on battery power.
Instead of ignoring these on the server, I would highly suggest dropping the metric and not sending it at all, or somehow marking any SoC delta metric with a note that a charger was connected. This will enable the SQL wizard to easily ignore those events in the final calculations.
The thing to note is that dropping a few data points here and there ultimately does not matter much. When thousands of devices are reporting data every hour, a few dropped hours here and there do not meaningfully change the averages.
A more advanced code snippet that ignores battery charger events can be found in Memfault’s documentation.
Comparing battery life across software versions
For most hardware companies, the hardware is a known quantity. It’s mostly designed in-house and only has a couple of revisions. If a single firmware was running on the device and the software was never updated, it would likely consume the same amount of power, on average, each and every day of its lifespan. That is one thing great about firmware.
But that isn’t how the Internet of Things works. IoT devices get updated with new firmware all of the time. Software is what makes today’s hardware companies unique and valuable, so firmware updates are essential. However, with firmware updates come regressions and the ability to really screw things up, and the firmware projects I’ve worked on have shipped more regressions than we can count.
When sending metrics, be sure to attach a firmware version to each one of them (as mentioned in the heartbeat metrics article). The firmware version should be your primary dimension on how you determine if battery life is getting better or worse.
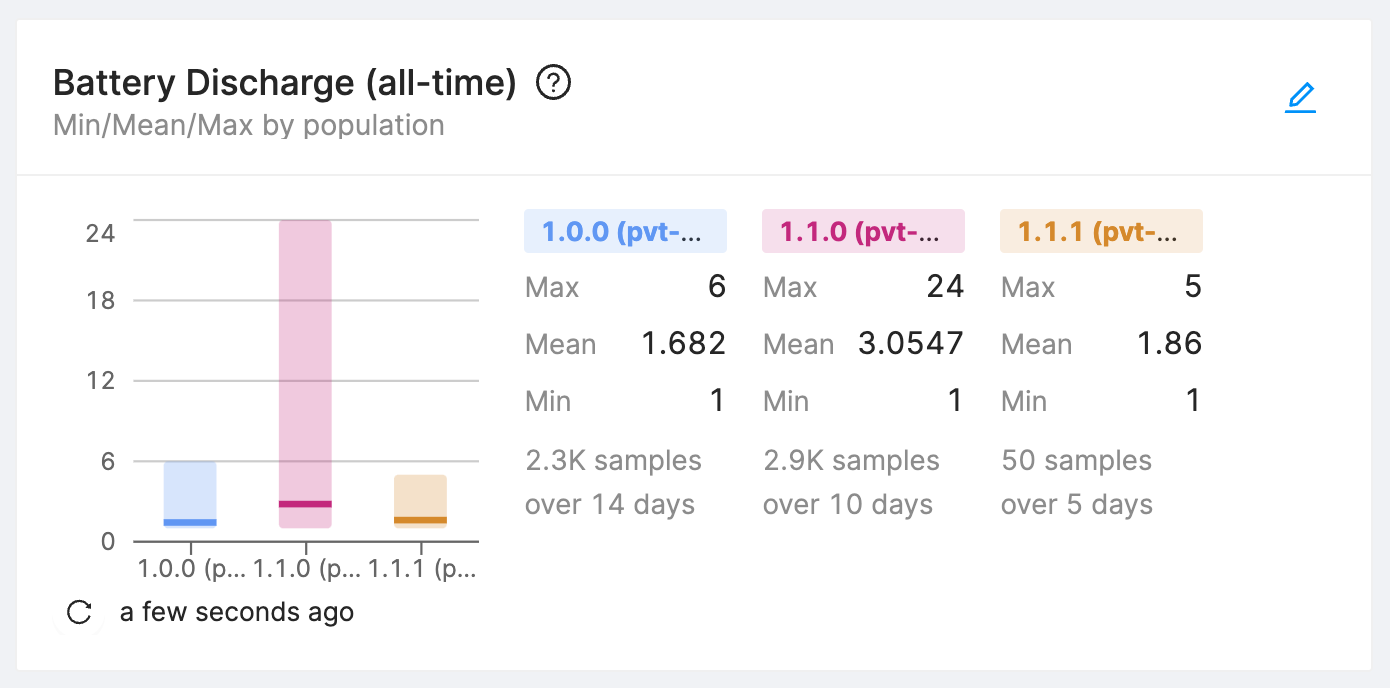
One of the most stressful times at a hardware company is a firmware update rollout because it could be the update that bricks thousands of devices or causes a massive battery life regression. To mitigate the risk, collect data at all stages of the release and constantly look at the data. Even with a few thousand samples, you should be able to make data driven decisions and minimize the stressful deployments.
Best Practices
Throughout the last ten or so years doing firmware development for hardware devices and talking to tons of developers doing the same, here are a few best practices that I would encourage every development team to adopt.
Don’t assume what worked for 1-100 devices works for fleets of 10k+ devices
I’ve talked to a lot of developers and teams, and all of us at Memfault have talked to plenty more, and the one resounding thing we hear and understand is that once the number of devices crosses into the thousands, early data systems start to break down or become prohibitively expensive.
Here are a few common general things I’ve seen a lot in the past fail:
- Generating metrics from logs: It’s easy to fall into this trap because it’s seemingly easy. Early projects implement logs, send them to S3, and then start building scripts to parse them. However, beyond a certain number of devices, this becomes a large data problem and the brittle nature of logs makes these systems hard to use and maintain. Generate the metrics on the device.
- Using Grafana for fleet-wide aggregations: Prometheus, StatsD, Grafana, and similar tools were not designed to monitor massive amounts of devices. Rather, they were optimized for a handful of servers and services monitoring health metrics sent every few seconds. They are designed to track entities in real-time, not provide large historical analytical queries across many dimensions that are required to truly understand battery life. Really, really think twice before thinking Grafana is a one-stop shop for monitoring your devices.
- Sending random metrics and assuming you’ll make sense of them later: I’ve seen this time and time again. If a metric doesn’t track something useful or doesn’t have a clear denominator to build aggregates on, it won’t magically become useful and should be removed. It’s garbage in, garbage out. This is why I heavily suggest projects adopt some patterns of heartbeat metrics. They’ve worked incredibly well for me in the past, and are almost fool-proof against the issues faced in the embedded firmware world.
Implement monitoring at the start of a project
I once believed that OTA & monitoring were some of the last pieces that you needed to put in place before shipping hardware to production. I now know this is the completely wrong approach.
Get the hardware working at a minimal level first, then implement OTA, then build up a monitoring pipeline, and finally start working on real features that your end device should support.
This is the way we had done things at Pebble, and it was incredible. For every new watch developed after our first generation, it was bring-up, logs, metrics, coredumps, then building the core features on this foundation. We were so productive in those early months of developing a new product!
And of course, we had battery metrics being sent constantly as well. If the battery life plummeted on my watch during internal testing, I filed an internal support ticket and dug into the data to help fix the bug.
If we had not had our monitoring stack set up at the very beginning and we instead waited until just before production to set it up, I don’t think we ever would have shipped on time and we would have had to cut a lot of features and be less ambitious.
Test internally. A lot.
Get as many hours reporting into your dataset as possible. Make sure people are using their devices actively, and it’s at least similar to how your customers will ultimately use the devices as well.
One thing we heavily took advantage of at previous companies was our usage of beta testing groups. At Pebble, we had fans all over the world who were more than excited to help us test the newest firmware releases, even if it meant their firmware was a little less stable and often-times had worse battery life.
Package and ship firmware as quickly as possible
One thing we did extremely well at Pebble was shipping firmware every few days internally to our employees and every few weeks externally to our customers. The biggest advantage to shipping often is every new release that went on employee or customer wrists had a small number of changes or commits.
If we introduced a major power regression in one of our internal builds, we’d only have 10-20 commits to look through to guess at which one it likely was. If we introduced a regression in our customer-facing build, we’d have probably 100 commits or so that we might need to git bisect though. This was painful, but nothing was impossible.
The problem was shipping every 3-6 months. In that amount of time, you have hundreds if not thousands of commits that could cause regressions in various subsystems, and by this point, it’s almost guaranteed that there isn’t a single issue affecting the battery performance.
Firmware updates are a blessing that can also be a curse. With the right tools and data collection in place, shipping often is a blessing that allows you to quickly find issues and fix them quickly.
Using Memfault as your monitoring stack
All of us at Memfault have thought about how to monitor battery life quite extensively, and we’ve built a product that we would have loved to use at our previous employers. Memfault can work on a wide variety of embedded systems and across all types of network topologies, whether they are home-grown or standardized like Wi-Fi or Bluetooth.
To learn more about how you might instrument battery life with Memfault, which is quite similar to this post, check out the Memfault Documentation page, Tracking Battery Life with Memfault.
Try the Sandbox
Want to get hands-on with Memfault? With the Sandbox, you can interact freely with a bunch of real data, or if you prefer, follow one of our guided product tours. No need to integrate any Memfault SDK - test the platform on your own immediately.
Conclusion
The world would be a better place if everything was plugged into a wall socket. But this is becoming less and less true each day. And as a consumer, I love it. I can dance freely and jump over couches while vacuuming the house with my wireless Dyson and Bluetooth headphones, and I know that the firmware engineers at these IoT companies are working hard to make sure the devices are reliable and have great battery life.
I hope this article has helped either paint a picture of the steps necessary to build and ship a great battery-operated device or that you’ve learned a few new things to take back to your team to improve the battery life in a product you work on.
See anything you'd like to change? Submit a pull request or open an issue on our GitHub
References
 Tyler Hoffman has worked on the embedded software teams at Pebble and Fitbit. He is now a founder at Memfault.