Monitoring Fleet Health with Heartbeat Metrics
Releasing a connected device in today’s world without some form of monitoring in place is a recipe for trouble. How would you know how often or if devices are experiencing faults or crashing? How can the release lead be confident that no connectivity, performance, or battery-life regressions have occurred between the past and current firmware update?
The answer is that you need device monitoring in place long before ever shipping a firmware update to devices in the field.
There have been several occasions in the past where I’ve introduced several performance and battery-life regressions that were never caught in internal beta testing of 50 devices. They were always subtle changes, such as an “optimization” that ended up causing high file system churn (which reduced battery life), or issues that crop up when connected over certain transports or to different mobile phone models. These bugs were caught in one of two ways: either a customer angry enough would submit a bug report, or we’d catch the regression on our internal dashboards which were powered by our suite of SQL queries that would run periodically.
In this post, we lay the foundation for how an organization should instrument their embedded firmware to measure performance, stability, and the overall “health” of each device and an entire fleet of devices. We also compare and contrast the various approaches projects generally take to surface these metrics and I’ll discuss why I believe heartbeat metrics are the best method for driving product decisions.
This post is guaranteed to be the tip of the iceberg in a series of posts about how to do device monitoring properly at scale. With this in mind, this post will be slightly more high-level than a typical “Interrupt” post. And if you’d rather listen to me present this information and see some demos in action, watch this webinar recording.
Table of Contents
Fleet Monitoring Overview
Device and software monitoring is not a new concept. There have been many new ambitious projects to solve the problem from a couple of devices to monitoring millions of servers or containers.
I’d like to talk about a few different variations of monitoring and how they relate to us in the world of embedded systems.
Application Performance Monitoring (APM)
Application performance monitoring services collect and aggregate different metrics on computer systems and software, and they alert customers when these numbers either increase or decrease in abnormal ways. Common metrics that are collected by APM’s are:
- CPU, RAM, and hard drive usage
- Response times and values
- Request rates and failures
They work by installing hooks in various places in the code. Common examples are the pre/post request handlers for a web application and the pre/post handlers for a database transaction. By hooking into both sides of common operations, they can take a snapshot of the system before and after, and compare memory usage and time deltas.
When an APM is hooked up to every instance of an application, it can paint a detailed picture of how an application, server, or fleet of either are performing at any given time.
APM’s aren’t a new concept, as one of the largest ones, New Relic, was founded in 2008 and is now a publicly-traded company.
Software services: New Relic1, Datadog2,
ScoutAPM3
Open Source Libraries: StatsD4,
CollectD5, Prometheus6
Tracing and Logging
I’ve grouped these into a single group because they accomplish the same goal.
Traces and logs give you an in-depth timeline view of what happened on a single device and allow you to zero-in on issues as long as you know what you are looking for. They work by having the developer install logs or trace events during the coding phase or automatically by installing hooks in the context switch handler and various system API calls.
Traces and logs, just like an APM, can tell you where most of the time is spent in an application or system, but there are drawbacks.
The amount of data collected by tracing and logging tools is immense, and most of the data doesn’t get used or processed. In their raw form, they are not easily aggregated or actionable.
I view tracing and logging as a silo of (valuable) data that is only queried when developers know there is an issue with a specific device.
Software services: New Relic1, Datadog2
Firmware
services: Percepio7
Crash Reporting
How nice would it be to have in-depth analysis and alerts for every unique crash, fault, assert, and error log that devices in the field experience? That is what these services provide.
When any of the listed error handlers are triggered, these libraries gather all of the relevant data, such as previous logs, backtraces of the currently running threads, local variables, global variables, etc. and push all of this data to a central server to be processed. These issues are then de-duplicated and presented in a bug-tracker like fashion to the user.
These systems usually require an SDK to be shipped with the application. These services must build and support an SDK that is written in the same language and for the same framework as the application they monitor.
For firmware, they would likely install hooks into the assert, fault, and logging handlers.
The beautiful thing about crash reporting tools is they are relatively easy to integrate because the entry-points they hook into are standardized by the language and frameworks. They also surface hard to reproduce or never before seen issues easily and provide a wealth of data to fix the problem quickly.
Software services: Sentry8, Rollbar9, Bugsnag10
Firmware services: Memfault11
Instantaneous State Monitoring
This is the category that most of today’s “IoT monitoring solutions” fall into. They assume a near-constant connection to the Internet and hold the state of every device in the service.
Devices can either push this information whenever states change, at regular intervals, or the remote server can pull data as well.
These systems ingest many of the system vitals that developers and managers want to know, like heap usage, current battery life, or whether certain peripherals are on or off. These values can be queried across the entire fleet or a subset of devices, but trends or custom queries are more difficult.
For instance, attempting to query for the amount of time the Bluetooth radio is on per day is nearly impossible, unless the infrastructure is 100% certain that it received every state change event from the device.
The statistic of time-active is a critical measurement for embedded devices, and is one of the best predictors of battery-life drain and performance.
What About Embedded Systems?
Most of the above services or strategies listed above do not apply to constrained embedded systems. Save for Memfault and Percepio, most of the solutions would require orders of magnitude more memory, CPU, power, and Internet bandwidth.
There is hope though. We will explore how we can manage to get the most important and actionable metrics out of embedded systems and gain an understanding of how devices are performing in the field.
Logging vs Metrics
I want to quickly cover the difference and use-cases for two common forms of data collected from systems: logs and metrics.
Logs
Logs are immutable events that happened over time to a single device. They are instrumental in debugging as they help a developer determine what happened before and after issues occur.
Logs are usually forwarded from individual devices to a centralized datastore such as S3, or to a log aggregator, such as Elastisearch, to be further transformed and processed. Unfortunately, more often than not, the logs are ingested and forgotten about.
A developer might dig up a particular device’s log files in response to a
customer support request, but that requires a pull-logs-from-s3.py script and
a decent amount of time to determine where the device behaved unexpectedly.
Metrics
Metrics are a set of numbers that give information about a particular process or activity. They are measured over intervals of time and are usually just numbers. This means that they are pre-processed and more compact than logs, which means that you can store and query many more of them at once.
Metrics themselves don’t help developers debug individual instances of issues or bugs, but they help organizations detect issues by measuring the data points that matter most. For many hardware makers, these metrics might be:
- Crash-free hours
- Average battery life
- Wi-Fi/BLE connected time per hour
Transforming Logs into Metrics
Logs can be transformed, processed, and aggregated into metrics, but this usually involves massive and complex data pipelines.
After working as a firmware engineer at a few hardware companies in the past, I can tell you that I was out of my depth trying to parse logs at scale, and I was rarely getting the help I needed from the web and infrastructure teams because they had their own roadmaps to complete.
The other problem with logs is that they generally log state transitions and force the developer or log aggregator to measure the time between these state transitions. Let’s try to calculate one of the important device metrics above, Wi-Fi connected time per hour.
[E][11:30:00] Wi-Fi connected
[W][11:45:00] Wi-Fi disconnected, reason: -2
[I][12:30:00] Wi-Fi connected
This calculation is relatively easy assuming we can process logs linearly. We see at 11:30 the device was connected to Wi-Fi, then disconnected at 11:45, so the time connected this hour was 15 minutes.
Let’s present a problem that happens all the time with embedded systems.
[E][11:30:00] Wi-Fi connected

# Wi-Fi disconnect event lost by device or in transport

[I][12:30:00] Wi-Fi connected
Oh no! A dropped log message.
Can we compute accurately how long the device was connected to Wi-Fi given the information above? No we can’t. We’d probably throw away this event during processing or accidentally include it and say Wi-Fi was connected for the entire hour.
We can do better.
Do We Need Both?
Logs and metrics ultimately serve different purposes. You need logs to debug hard to reproduce issues and to verify if a particular device has hardware issues, and you need metrics to make informed product and business decisions.
Whether you transform logs into metrics or collect metrics directly in the manners mentioned in this article is up to you.
Collecting Metrics from Devices
Embedded systems have quirks that make them more difficult to track than web applications or mobile phones. Connectivity is slow and unreliable, timestamps are rarely accurate if they exist at all, and storage, CPU, RAM, power, and bandwidth are all limited.
Due to these constraints, the solutions for how to capture, send, and receive data from embedded systems tend to look very different compared to their software counterparts.
Optimally, we want to build a metric and monitoring solution that can provide all of the following benefits:
- Easy to implement
- Can measure “health” easily across the entire fleet, different firmware versions, and specific devices
- Minimal data, bandwidth and connectivity requirements
- Clock time not required
- Cost-effective infrastructure
- Useful even with 5 devices and can scale to 1000’s+
We will go through each common approach to gathering monitoring data from devices and assess them on the above requirements.
Plain Text Logging
The first solution that most companies deploy for remote device monitoring is to piggy-back off of their existing UART-style logging setup that developers used for local debugging. The programmer writes various logs that they think are important.
[E][1598845590] Flash sector write error: 6
[W][1598845590] Wi-Fi disconnected, reason: -2
[I][1598845592] Battery status: 67%, 3574 mV
The device firmware generates these logs, writes them to a RAM buffer, and eventually flushes them to persistent storage such as NOR flash in a circular buffer fashion. Periodically, these logs are vacuumed up by the system and pushed (or pulled) to a central location.
Every so often, a single device’s logs might be manually dug up by the engineer to track down a bug that a customer had reported.
Logs are great for local debugging, but at scale, they are incredibly difficult to make sense of and provide useful data about an entire fleet of devices. You can build it yourself12 or use your web team’s favorite logging aggregator. However, both of those approaches can become a significant cost in either engineering resources or SaaS bills respectively.
Logging will also generate an enormous amount of data, which will in turn use more CPU and power, require more storage, cause more flash wear, and use more bandwidth to send the data.
Structured Logging
A close cousin to logging is structured logging. It is essentially a more-easily parseable log-line, which helps pull out the structured bits, but doesn’t help you extract the useful data bits, such as the flash sector write error or battery life measurement.
{"level": "e", "time": 1598845590, "line": "Flash sector write error: 6"}
{"level": "w", "time": 1598845590, "line": "Wi-Fi disconnected, reason: -2"}
{"level": "i", "time": 1598845592, "line": "Battery status: 67%, 3574 mV"}
A structured log can take any serialized form, but the most common for embedded systems are Protobuf, CBOR, or a custom binary packed C/C++ structure. Don’t use JSON, it’s a waste of precious space.
Structured logging makes it easier for developers to build scripts around viewing logs locally and might help with integration into a commercial log aggregator, but that is about it. It carries with it all of the cons of plain text logging described above.
Binary Logging
If more structure is desired, the next evolution is typically in the form of binary logs or events. This will take each log-line and convert it into a structure known by the service that parses the data.
Here are a few hypothetical events and their companion logging functions.
#define PACKED __attribute__((packed))

typedef struct PACKED {
    uint16_t  type;
    uint8_t   thread_id:4;
    uint8_t   level:4;
    uint8_t   reserved;
} Event_Base;

typedef struct PACKED {
    Event_Base  base;  // contains event metadata
    FlashOp     op;    // Read, WriteSector, etc.
    int16_t     err;   // -6
    uint32_t    extra; // num pages, num bytes, etc.
} Event_FlashError;

typedef struct PACKED {
    Event_Base  base;      // contains event metadata
    bool        connected; // false
    int16_t     reason;    // -2
    uint8_t     rssi;      // (-) 70
} Event_WiFiState;

typedef struct PACKED {
    Event_Base  base;  // contains event metadata
    uint16_t    mv;    // 3,574
    uint8_t     pct;   // 67
    BattState   state; // charging, battery, full, etc.
} Event_BatteryStat;

void events_record_flash_error(FlashOp op, int16_t err, uint32_t extra);
void events_record_wifi_state_change(bool connected, int16_t reason, uint8_t rssi);
void events_record_battery_stat(uint16_t mv, BattState state);
Each time the system would normally produce a logline for a flash error or a battery stat, it would instead serialize the information into a C struct, write it to flash, and send these up to a server immediately or in batches. The server which parses and transforms this data will need to always know exactly how to parse these structures, for every version, both past and future. A word of warning to the reader: parsing bitfields in Python/Ruby/JavaScript/etc. isn’t trivial.
I’ve designed the structures above by using C structs for easy comprehension by the reader. If this architecture is used in production, I would highly recommend using Protobuf or another message packing protocol for more resilient parsing and backward-compatibility. It solves many of the deficiencies with binary logging.
Binary logging will use less data, storage, and bandwidth which is a huge boon to developers because it might mean they can log even more.
Although Protobuf solves many of the problems around parsing, keeping the definitions in sync between device and server and always using the right one is still a challenge. Another unfortunate truth about binary logging is that a developer can no longer just connect to a UART and understand the logs. Scripts are required.
Heartbeats
A device heartbeat can be thought of as a periodic “pulse” sent from a device to a monitoring service. The presence of the heartbeat alone can tell you whether a device is functional or online, but it can also store device vitals and statistics aggregated from the last time period. Devices that have a constant connection to the Internet and either a powered connection or a large battery might send a heartbeat every minute, and power-optimized devices might send one every hour or each day.
Heartbeats differ from all of the other types mentioned above because the data is pre-aggregated on the device. Instead of sending raw log data and having to do stream processing on the logs to pull out metric data, we store the metric directly on the device!
The following examples use the heartbeat library I will go into more details about below
Below, we increment the count of flash write errors seen on a device:
void flash_write(...) {
    ...
    if (retval < 0) {
        // Record there was an error
        device_metrics_incr(kDeviceMetric_FlashError);
    }
    return retval;
}
Here, we record that the device experienced a % drop in battery life over the last hour.
void device_metrics_flush(void) {
    ...
    static int32_t s_prev_battery_pct;
    const int32_t current_battery_pct = battery_get_pct();
    const int32_t battery_delta = current_battery_pct - s_prev_battery_pct;
    device_metrics_set(kDeviceMetricId_BatteryLifeDrain, battery_delta);
}
Recall the difficult-to-calculate metric of Wi-Fi connected time per hour. It’s easy when you count the time connected on the device!
static uint32_t s_wifi_ticks;

void wifi_connected_callback(void) {
    // Start timer when Wi-Fi connects
    device_metrics_timer_start(&s_wifi_ticks);
}

void wifi_disconnected_callback(void) {
    // Stop timer when Wi-Fi connects
    device_metrics_timer_end(kDeviceMetricWifiConnectedDuration
                            &s_wifi_ticks);
}
There is a critical rule to follow with heartbeats that make them work as well as they do. After the individual metrics are collected from the device and a heartbeat is packaged up, the metric values aggregated from this interval are cleared. This means the next heartbeat will contain entirely new data not based upon the previous interval.
More information on resetting metrics for each heartbeat can be found here.
How a project chooses to persist heartbeats to flash and send them over the wire is something I don’t discuss in depth in this post. If I were to build that system today, I would use CBOR or Protobuf (with a stable Protobuf definition file). A small web application would accept the payloads, unpackage them, and push them into a database. I might also use Memfault (depends on whether there is a free infrastructure engineer at the time).
Heartbeats aren’t a magic bullet. Since they only store aggregated data and not the raw form, they aren’t as useful for post-mortem debugging as logs would be. However, they are more compact and easier to ultimate store and process once they are pushed to the cloud.
Raw Data Types Summary
In summary, let’s compare the methods of collecting data for use as metrics.
| Logging | Structured Logging | Binary Logging | Heartbeats | |
|---|---|---|---|---|
| Easy to implement | ✅ | ✅ | ❌ | ✅ |
| Fleet / version health | ⚠️ | ⚠️ | ⚠️ | ✅ |
| Minimal bandwidth required | ⚠️ | ⚠️ | ✅ | ✅ |
| Wall time not required | ❌ | ❌ | ❌ | ✅ |
| Cheap / scalable infrastructure | ❌ | ❌ | ⚠️ | ✅ |
| Good for debugging device issues | ✅ | ✅ | ✅ | ⚠️ |
Where ✅ is a benefit, ⚠️ is neutral, and ❌ is not a benefit.
Heartbeat Best Practices
I have a few tips on how to use heartbeats, and the best practices to follow.
Heartbeat Timestamps
In my experience, heartbeats serve three primary purposes.
- To enable calculations of important metrics across an entire fleet of devices
- To enable calculations of important metrics between different firmware versions
- To present a device’s vitals and metrics in a timeline view
Recall that with logs, we needed to include timestamps with each log line to enable us to process logs linearly and determine the time between events.
What I didn’t realize until writing this post was that heartbeats don’t always need timestamps to calculate health metrics! Many constrained embedded devices do not synchronize their clocks and have no notion of wall time, only an internal tick count. As long as a device knows approximately how long a minute, hour, or day is, they can generate a useful heartbeat.
For 1 and 3, having a timestamp is useful if you wanted to limit queries to the last 24 hours of data or last week. However, for 2, you just need to group all firmware version hourly heartbeats and perform aggregates on them! It doesn’t really matter when they were.
If a developer wants to see a timeline view of a device’s vitals, such as heap statistics, battery life, and utilization data for the last week, then timestamps are essential for every heartbeat.
If the device doesn’t and will never have access to the wall time and you want a robust solution for viewing logs in a timeline from a single device, I suggest generating a random (or better, monotonically increasing) integer on boot for use as a “boot ID” of sorts, and then use milliseconds-since-boot as the timestamp. It should work well enough given the device sends these logs to a server every so often
Resetting Data for Each Heartbeat
Once the heartbeat interval has finished and the metrics have been flushed, each metric value should be reset.
Let me try to emphasize how important this is with an example. Let’s imagine my fictitious smart-toaster company is trying to measure how long, on average, all of our devices in the field are connected over Wi-Fi per hour. In an ideal world, every device is connected to Wi-Fi for all 3,600 seconds of each hour.
This stat can either be recorded in two ways on the toaster firmware: as a continuous summation or as a heartbeat metric that is reset every hour.
Below is a chart of a single device recording its time connected to Wi-Fi measured in both ways.

When looking at this chart, it is clear by looking at the heartbeat metric (red line) in hour 3 that there was a dip in time connected. This is not immediately obvious when looking at a chart of a continuously summed number.
To calculate the average time connected per hour, we use two different calculations.
For the continuous sum, we can just divide the final number by the number of hours:
19800 seconds / 6 hours = 3,300 seconds per hour
or get this value by computing the deltas between each event received:
  (3600 - 0) + (7200 - 3600) + (9000 - 7200)
+ (12600 - 9000) + (16200 - 12600) + (19800 - 16200)
= 19800 seconds

19800 seconds / 6 hours = 3,300 seconds per hour
See how that got a little messy quickly?
To compute this metric for the heartbeat data where the values are reset each hour, we just add all the intervals and divide by the number of heartbeats
(3600 + 3600 + 1800 + 3600 + 3600 + 3600) / 6 = 3,300 seconds per hour
The real issue comes into play when we want to compute a particular metric across all hours of a particular firmware version or group of devices. If every hour’s metric is based upon the previous hour’s data, for every single device, what happens if we miss a subset of heartbeats from a device?
Do we extrapolate the data across the missing points? Do throw out the remainder of the device’s session data until the device reboots? Maybe we should just ignore devices that have missing data in our queries.
All of those are easily solved by just resetting the values for each heartbeat!
In summary, if you ever imagine aggregating a metric across multiple devices, be sure to reset your metrics at the beginning of each interval.
Extra Metadata to Include
Metrics are only useful if you can tie them back to a specific device, firmware version, and possibly time.
Therefore, the following are what I suggest to capture and send up with every heartbeat or each batch of heartbeats.
- Firmware Version: This should tie to one and only one firmware. Ideally a semantic version or a build id.
- Device Serial Number: You want to be able to type back heartbeats to the device they came from to do more fine-grained queries.
- Timestamp: The timestamp interval the heartbeat relates to (when available). More information
- Heartbeat Duration: The last thing I would suggest including is the actual duration of the heartbeat interval. A device might reboot mid-way through a heartbeat interval, and you’ll want to be able to either normalize this data or throw out incomplete heartbeat intervals from your queries.
Heartbeat Metric Type Explanations
In this section, we’ll go over the different types of metrics you are likely to see in a dashboard built with a tool like Grafana13. They map closely and were inspired by the types from StatsD14.
I’ve also created a simplistic heartbeat metric library and example FreeRTOS firmware to paint a picture of how this subsystem could work and to help inspire you, the reader, as to what you could collect. Skip ahead to the code if you like.
Counters
Counters are the most basic type. They store an accumulated value for the heartbeat duration which is reset at the end of the interval.
These metrics are useful for detecting changes in the usage patterns of the device or its peripherals, and deltas in the number of errors devices are experiencing between releases.
Metrics that would be perfect for counters could be the number of:
- bytes sent/received over a device’s transport path
- connectivity disconnect events
- flash bytes written
- flash sector erases
- mutex_lock failures
- display frames rendered per hour
- times a particular feature was used
Below are two examples of using counters. One counts the number of flash sectors erased and the other the number of bytes sent by a BLE radio.
void flash_sector_erase(uint16_t sector) {
    ...
    device_metrics_incr(kDeviceMetric_FlashSectorErases);
}

void ble_send(void *buf, size_t len) {
    ...
    device_metrics_incr_by(kDeviceMetric_BleBytesSent, len);
}
Timed Counters
Timed Counters (or Timers in StatsD4) are essentially counters accumulated over the heartbeat interval, but they store the amount of time spent in a particular state, rather than the number of times entering a state.
These metrics are crucial for estimating and detecting regressions in performance, expected battery-life, and user-experience.
Some timed counters that I’ve found indispensable in the past include:
- CPU utilization
- CPU sleep time
- BLE, Wi-Fi radio utilization
- thread utilization
- sensor and peripheral utilization
- display and backlight utilization
- how long a particular feature was used for
- time spent waiting for mutexes
- time spent during flash operations
- time elapsed (start/stop timer between flush calls)
Below is a simple use case of measuring the total time per hour that the Wi-Fi radio was turned on.
void wifi_on(void) {
    // record when Wi-Fi was enabled
    device_metrics_timer_start(&wifi_on_ticks);
}

void wifi_off(void) {
    // compute Wi-Fi time on and store it
    device_metrics_timer_stop(kDeviceMetric_WifiTime, &wifi_on_ticks);
}
In StatsD, the timer implementation will store the average, 90th percentile, min, max, and count for the current interval. Our heartbeats could also store the same aggregates per heartbeat interval using an extra 4-8 bytes of extra RAM per aggregate (except for the 90th percentile).
Gauges
Gauges are constant values and are not aggregated by the metrics system. In the heartbeat metric library, these can be set at the beginning of the hour or the end of the hour.
Gauges are useful for obtaining a sampling of the system state and to easily calculate the prevalence of an issue across all devices. Some useful metrics to keep track of include:
- hour’s battery life drain in the last hour
- current battery life
- current heap bytes used/free
- PC/LR from the last crash if it occurred within the hour
- hour’s heap high-water mark (reset each hour!)
- hour’s stack high-water mark (reset each hour!)
- whether a particular feature was used in the last hour
- whether the device faulted or crashed in the last hour
Below is a simple example of how to capture the battery life percentage delta using the heartbeat library.
static void prv_device_metrics_flush_callback(bool is_flushing) {
    static int32_t s_prev_battery_pct;

    if (is_flushing) {
        // End of heartbeat interval
        const int32_t current_battery_pct = battery_get_pct();
        const int32_t battery_delta = current_battery_pct - s_prev_battery_pct;
        device_metrics_set(kDeviceMetricId_BatteryLifeDrain, battery_delta);
    } else {
        // Start of heartbeat interval
        s_prev_battery_pct = battery_get_pct();
    }
}
Gauges are simple but powerful. They are only limited by your creativity.
Heartbeat Library Example
I’ve created an example heartbeat metrics library and an accompanying FreeRTOS firmware which captures some metrics about the system (in a relatively contrived but inspiring way).
You can find the library within the Interrupt Github repo.
The metrics in the example library stored in an int32_t array for simplicity,
but there are optimizations that can be made to store values of various lengths
or signedness. Assuming 4 bytes per metric, you can reasonably store hundreds of
different metrics in RAM at any one time and flush them to persistent storage
for when a data connection is available. If a device captures 256 metrics every
hour, that is only ~25kB of storage required per day or roughly 200 kB per week.
Given how critical this information is to detect issues, it is a fantastic use
of a couple of regions in your external flash chip.
Heartbeat Library Design
I want to use this section to convince you that implementing heartbeats is a relatively painless and worthwhile endeavor. Take the example library as an inspiration, but do appreciate that it isn’t far from Memfault’s production worthy equivalent.
The first and most important thing is to define the metric types.
// Don't ever re-use an ID!
typedef enum {
    kDeviceMetricId_INVALID = 0,
    kDeviceMetricId_ElapsedTime = 1,
    kDeviceMetricId_MainTaskTime = 2,
    kDeviceMetricId_TimerTaskTime = 3,
    ...
} eDeviceMetricId;
All three types (counters, counted timers, and gauges) make an appearance in the library and are as easy to use as you would imagine.
// Counters
void device_metrics_incr(eDeviceMetricId metric_id);
void device_metrics_incr_by(eDeviceMetricId metric_id, int32_t n);

// Counted Timers
void device_metrics_timer_start(uint32_t *start);
void device_metrics_timer_end(eDeviceMetricId metric_id, const uint32_t *tick_buf);
void device_metrics_timer_end_counted(eDeviceMetricId metric_id, const uint32_t *tick_buf, eDeviceMetricId counter_metric_id);

// Gauges
void device_metrics_set(eDeviceMetricId metric_id, int32_t value);
The only thing unexpected here is device_metrics_timer_end_counted, which
helps to automatically keep track of both a counted timer and a counter related
to the same metric. For example, it might be useful to know how many flash
sector erases happen and how long on average each sector takes to erase.
The last important bit is to register a timer to call these two functions every hour (or the heartbeat interval of your choosing) to persist the metrics and start a new interval.
// Call this every hour
void device_metrics_flush(void);

// After flushing, reset all metrics!
void device_metrics_reset_all(void);
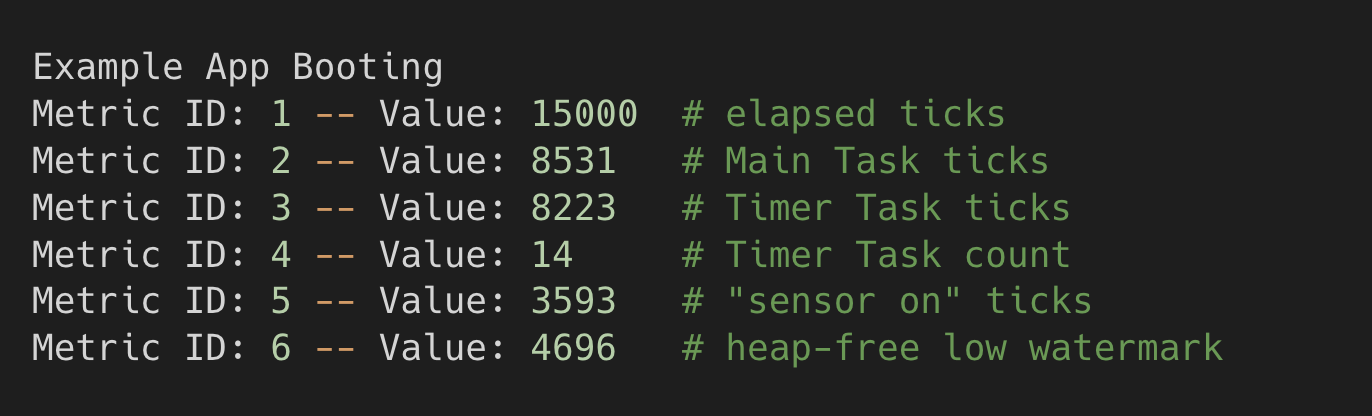
Running the Example
I’m primarily using Renode to do most firmware development these days, especially because Renode released support for the nRF5215. With this in mind, the FreeRTOS example code works with an nRF52 device and with Renode.
$ git clone https://github.com/memfault/interrupt.git
$ cd examples/device-heartbeat-metrics

# Build and start Renode
$ make -C gcc && ./start.sh
The following is what outputs after the system runs for 15 seconds. These are various counters, counted timers, and gauges from the system for this 15 second interval.
Go/No-Go Metrics for Deploying Firmware Updates
Deploying a firmware update can be either a huge success or a nightmare. They have the potential to solve every bug users might experience or brick and turn thousands of devices into paper-weights.
Because of the risks attached to firmware updates, many organizations have implemented “go, no-go” meetings and policies around them, and require metrics to be gathered from internal and beta devices to predict the success of a firmware update.
Below, I’ve listed a few of the metrics that I’ve used in the past to determine whether a release candidate was worthy of a production rollout or not. With these calculations, you can compare metrics across firmware versions and validate or reject the latest release candidate.
Crash Free Hours (or Days)
As mentioned above, gauges make it incredibly simple to detect the prevalence and presence of an event across all devices of a fleet. Imagine you want to know roughly how many crash-free hours there are in the last 24 hours on a particular release.
By recording whether the device faulted or crashed in the last hour in a gauge
metric, you can do this! The only two values of this metric, maybe
kDeviceMetric_DidCrash, are 0 and 1, where 0 is it hasn’t crashed and
1 mean it has crashed in the last hour.
Let’s imagine that we have 1,000 devices, and of the 24,000 heartbeats from all
devices in the last 24 hours, 2,000 of those reported a 1 (crashed).


This is a very good metric to use to gauge stability between releases, and it’s incredibly simple to calculate once the data is in a database table.
Battery Life Trends
If each device records the percentage or mV battery drain per hour in a heartbeat metric, then you can project what the battery life of a firmware release will be with only a handful of devices over just a few hours. This is incredibly useful if your devices have a battery life of weeks and you would rather not wait weeks for a device to complete its charge-discharge cycle.
To do this, record the delta in battery life during the heartbeat interval (assuming the device was not plugged into a charger) in a gauge metric, and then take the average of this delta over all heartbeats of the particular release.


It might be helpful to scale out the battery life beyond just 1-100 so that devices with a long battery life won’t report zero as the delta for every heartbeat.
Wi-Fi / BLE Connected Hours
This is a crucial metric to track for devices that connect to a plethora of Wi-Fi routers and mobile phones on various versions of iOS or Android. Knowing from experience, it seems like anything can affect connectivity performance and there are constantly regressions occurring.
Once again, the metric can be calculated easily assuming the Wi-Fi / BLE connectivity is tracked within an hourly heartbeat.


What’s Next?
In this article, I’ve primarily covered how to think about, track, and store heartbeat metrics and how they compare against logging. I have completely ignored how to get the metrics off of the device and into something that developers and decision-makers can query. This is on purpose as it merits an article of its own.
Some of the things that will need to be addressed include:
- what the transport path & protocol looks like
- how to efficiently ingest the data
- what database / data warehouse to use
- how to scale the solution as your fleet grows
- how to visualize the data at the device and fleet level
- how to alert on the data collected
If you’d rather use a fully managed solution, reach out to one of us at Memfault. We’d be happy to guide you in the right direction and suggest a solution, whether it’s our solution or not.
Conclusion
I’m glad I finally got around to writing this post. The topic of generating, collecting, and tracking metrics for embedded systems at scale is not a topic that is discussed enough on the Internet. I hope the ideas and methods discussed in this post have put some incarnation of heartbeat metrics on the roadmap, whether it’s replacing some form of logging or being added as a complement to it.
During my days at Pebble, I was the release lead for several firmware releases, and my job was made easier by the fact that the firmware and infrastructure teams had invested a lot of time and energy into building one of the best analytics systems I’ve come across in a hardware company. I hope you all either have the same already or will soon.
I’d love to hear about how you think about metrics and embedded systems and what you or your organization has built to tackle these problems in the comments.
Interested in learning more about the benefits of monitoring with metrics? Watch this webinar recording
See anything you'd like to change? Submit a pull request or open an issue on our GitHub
References
 Tyler Hoffman has worked on the embedded software teams at Pebble and Fitbit. He is now a founder at Memfault.