How to debug a HardFault on an ARM Cortex-M MCU
Faults happen on embedded devices all the time for a variety of reasons – ranging from something as simple as a NULL pointer dereference to something more unexpected like running a faulty code path only when in a zero-g environment on the Tower of Terror in Disneyland1. It’s important for any embedded engineer to understand how to debug and resolve this class of issue quickly.
In this article, we explain how to debug faults on ARM Cortex-M based devices. In the process, we learn about fault registers, how to automate fault analysis, and figure out ways to recover from some faults without rebooting the MCU. We include practical examples, with a step by step walk-through on how to investigate them.
If you’d rather listen to me present this information and see some demos in action, watch this webinar recording.
Table of Contents
Determining What Caused The Fault
All MCUs in the Cortex-M series have several different pieces of state which can be analyzed when a fault takes place to trace down what went wrong.
First we will explore the dedicated fault status registers that are present on all Cortex-M MCUs except the Cortex-M0.
If you are trying to debug a Cortex-M0, you can skip ahead to the next section where we discuss how to recover the core register state and instruction being executed at the time of the exception.
NOTE: If you already know the state to inspect when a fault occurs, you may want to skip ahead to the section about how to automate the analysis.
Relevant Status Registers
Configurable Fault Status Registers (CFSR) - 0xE000ED28
This 32 bit register contains a summary of the fault(s) which took place and resulted in the exception. The register is comprised of three different status registers – UsageFault, BusFault & MemManage Fault Status Registers:
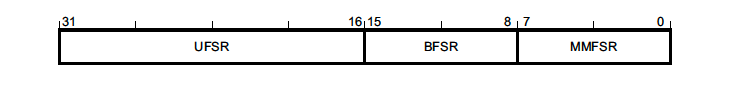
The register can be accessed via a 32 bit read at 0xE000ED28 or each register can be read individually. For example, in GDB it would look something like this:
- Entire CFSR -
print/x *(uint32_t *) 0xE000ED28 -
UsageFault Status Register (UFSR) -
print/x *(uint16_t *)0xE000ED2A -
BusFault Status Register (BFSR) -
print/x *(uint8_t *)0xE000ED29 -
MemManage Status Register (MMFSR) -
print/x *(uint8_t *)0xE000ED28
NOTE: If multiple faults have occurred, bits related to several faults may be set. Fields are only cleared by a system reset or by writing a 1 to them.
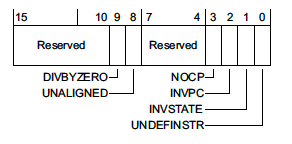
UsageFault Status Register (UFSR) - 0xE000ED2A
This register is a 2 byte register which summarizes any faults that are not related to memory access failures, such as executing invalid instructions or trying to enter invalid states.
where,
-
DIVBYZERO- Indicates a divide instruction was executed where the denominator was zero. This fault is configurable. -
UNALIGNED- Indicates an unaligned access operation occurred. Unaligned multiple word accesses, such as accessing auint64_tthat is not8-bytealigned, will always generate this fault. With the exception of Cortex-M0 MCUs, whether or not unaligned accesses below 4 bytes generate a fault is also configurable. -
NOCP- Indicates that a Cortex-M coprocessor instruction was issued but the coprocessor was disabled or not present. One common case where this fault happens is when code is compiled to use the Floating Point extension (-mfloat-abi=hard-mfpu=fpv4-sp-d16) but the coprocessor was not enabled on boot. -
INVPC- Indicates an integrity check failure onEXC_RETURN. We’ll explore an example below.EXC_RETURNis the value branched to upon return from an exception. If this fault flag is set, it means a reservedEXC_RETURNvalue was used on exception exit. -
INVSTATE- Indicates the processor has tried to execute an instruction with an invalid Execution Program Status Register (EPSR) value. Among other things the ESPR tracks whether or not the processor is in thumb mode state. Instructions which use “interworking addresses”2 (bx&blxorldr&ldmwhen loading apc-relative value) must setbit[0]of the instruction to 1 as this is used to updateESPR.T. If this rule is violated, aINVSTATEexception will be generated. When writing C code, the compiler will take care of this automatically, but this is a common bug which can arise when hand-writing assembly. -
UNDEFINSTR- Indicates an undefined instruction was executed. This can happen on exception exit if the stack got corrupted. A compiler may emit undefined instructions as well for code paths that should be unreachable.
Configurable UsageFault
It is worth noting that some classes of UsageFaults are configurable via the Configuration and Control Register (CCR) located at address 0xE000ED14.
- Bit 4 (
DIV_0_TRP) - Controls whether or not divide by zeros will trigger a fault. - Bit 3 (
UNALIGN_TRP) - Controls whether or not unaligned accesses will always generate a fault.
NOTE: On reset both of these optional faults are disabled. It is generally a good idea to enable
DIV_0_TRPto catch mathematical errors in your code.
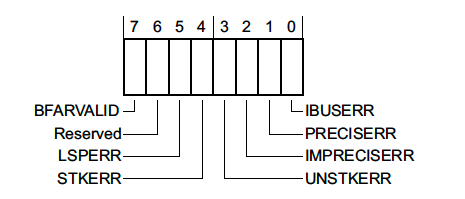
BusFault Status Register (BFSR) - 0xE000ED29
This register is a 1 byte register which summarizes faults related to instruction prefetch or memory access failures.
-
BFARVALID- Indicates that the Bus Fault Address Register (BFAR), a 32 bit register located at0xE000ED38, holds the address which triggered the fault. We’ll walk through an example using this info below. -
LSPERR&STKERR- Indicates that a fault occurred during lazy state preservation or during exception entry, respectively. Both are situations where the hardware is automatically saving state on the stack. One way this error may occur is if the stack in use overflows off the valid RAM address range while trying to service an exception. We’ll go over an example below. -
UNSTKERR- Indicates that a fault occurred trying to return from an exception. This typically arises if the stack was corrupted while the exception was running or the stack pointer was changed and its contents were not initialized correctly. -
IMPRECISERR- This flag is very important. It tells us whether or not the hardware was able to determine the exact location of the fault. We will explore some debug strategies when this flag is set in the next section and walk through a code exampe below. -
PRECISERR- Indicates that the instruction which was executing prior to exception entry triggered the fault.
Imprecise Bus Error Debug Tips
Imprecise errors are one of the hardest classes of faults to debug. They result asynchronously to instruction execution flow. This means the registers stacked on exception entry will not point to the code that caused the exception.
Instruction fetches and data loads should always generate synchronous faults for Cortex-M devices and be precise. Conversely, store operations can generate asynchronous faults. This is because writes will sometimes be buffered prior to being flushed to prevent pipeline stalls so the program counter will advance before the actual data store completes.
When debugging an imprecise error, you will want to inspect the code around the area reported by the exception for a store that looks suspicious. If the MCU has support for the ARM Embedded Trace Macrocell (ETM), the history of recently executed instructions can be viewed by some debuggers3.
Auxiliary Control Register (ACTLR) - 0xE000E008
This register allows for some hardware optimizations or features to be disabled typically at the cost of overall performance or interrupt latency. The exact configuration options available are specific to the Cortex-M implementation being used.
For the Cortex M3 & Cortex M4 only, there is a trick to make all IMPRECISE accesses PRECISE by disabling any write buffering. This can be done by setting bit 1 (DISDEFWBUF) of the register to 1.
For the Cortex M7, there is no way to force all stores to be synchronous / precise.
Auxiliary Bus Fault Status Register (ABFSR) - 0xE000EFA8
This register only exists for Cortex-M7 devices. When an IMPRECISE error occurs it will at least give us an indication of what memory bus the fault occurred on4:
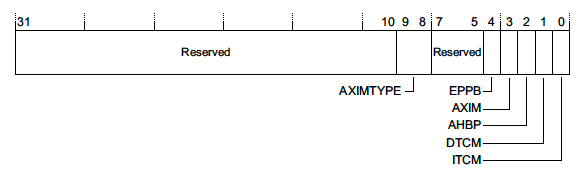
A full discussion of memory interfaces is outside the scope of this article but more details can be found in the reference manual 4.
MemManage Status Register (MMFSR) - 0xE000ED28
This register reports Memory Protection Unit faults.
Typically MPU faults will only trigger if the MPU has been configured and enabled by the firmware. However, there are a few memory access errors that will always result in a MemManage fault – such as trying to execute code from the system address range (0xExxx.xxxx).
The layout of the register looks like this:
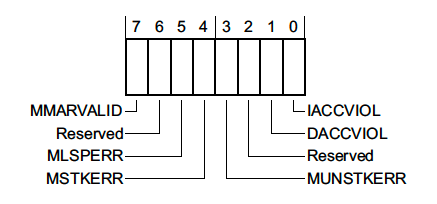
where,
-
MMARVALID- Indicates that the MemManage Fault Address Register (MMFAR), a 32 bit register located at0xE000ED34, holds the address which triggered the MemManage fault. -
MLSPERR&MSTKERR- Indicates that a MemManage fault occurred during lazy state preservation or exception entry, respectively. For example, this could happen if an MPU region is being used to detect stack overflows. -
MUNSTKERR- Indicates that a fault occurred while returning from an exception -
DACCVIOL- Indicates that a data access triggered the MemManage fault. -
IACCVIOL- Indicates that an attempt to execute an instruction triggered an MPU or Execute Never (XN) fault. We’ll explore an example below.
HardFault Status Register (HFSR) - 0xE000ED2C
This registers explains the reason a HardFault exception was triggered.
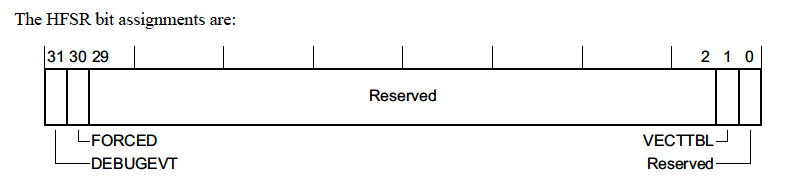
There’s not too much information in this register but we will go over the fields real quickly
-
DEBUGEVT- Indicates that a debug event (i.e executing a breakpoint instruction) occurred while the debug subsystem was not enabled -
FORCED- This means a configurable fault (i.e. the fault types we discussed in previous sections) was escalated to a HardFault, either because the configurable fault handler was not enabled or a fault occurred within the handler. -
VECTTBL- Indicates a fault occurred because of an issue reading from an address in the vector table. This is pretty atypical but could happen if there is a bad address in the vector table and an unexpected interrupt fires.
Recovering the Call Stack
To fix a fault, we will want to determine what code was running when the fault occurred. To accomplish this, we need to recover the register state at the time of exception entry.
If the fault is readily reproducible and we have a debugger attached to the board, we can manually add a breakpoint for the function which handles the exception. In GDB this will look something like
(gdb) break HardFault_Handler
Upon exception entry some registers will always be automatically saved on the stack. Depending on whether or not an FPU is in use, either a basic or extended stack frame will be pushed by hardware.
Regardless, the hardware will always push the same core set of registers to the very top of the stack which was active prior to entering the exception. ARM Cortex-M devices have two stack pointers, msp & psp. Upon exception entry, the active stack pointer is encoded in bit 2 of the EXC_RETURN value pushed to the link register. If the bit is set, the psp was active prior to exception entry, else the msp was active.
Let’s look at the state when we break in HardFault_Handler for a pathological example:
int illegal_instruction_execution(void) {
  int (*bad_instruction)(void) = (void *)0xE0000000;
  return bad_instruction();
}
(gdb) p/x $lr
$4 = 0xfffffffd

# psp was active prior to exception if bit 2 is set
# otherwise, the msp was active
(gdb) p/x $lr&(1<<2)
$5 = 0x4

# First eight values on stack will always be:
# r0, r1, r2, r3, r12, LR, pc, xPSR
(gdb) p/a *(uint32_t[8] *)$psp
$16 = {
  0x0 <g_pfnVectors>,
  0x200003c4 <ucHeap+604>,
  0x10000000,
  0xe0000000,
  0x200001b8 <ucHeap+80>,
  0x61 <illegal_instruction_execution+16>,
  0xe0000000,
  0x80000000
}
Offset 6 and 7 in the array dumped hold the LR (illegal_instruction_execution) & PC (0xe0000000) so we now can see exactly where the fault originated!
Faults from Faults!
The astute observer might wonder what happens when a new fault occurs in the code dealing with a fault. If you have enabled configurable fault handlers (i.e MemManage, BusFault, or UsageFault), a fault generated in these handlers will trigger a HardFault.
Once in the HardFault Handler, the ARM Core is operating at a non-configurable priority level, -1. At this level or above, a fault will put the processor in an unrecoverable state where a reset is expected. This state is known as Lockup.
Typically, the processor will automatically reset upon entering lockup but this is not a requirement per the specification. For example, you may have to enable a hardware watchdog for a reset to take place. It’s worth double checking the reference manual for the MCU being used for clarification.
When a debugger is attached, lockup often has a different behavior. For example, on the NRF52840, “Reset from CPU lockup is disabled if the device is in debug interface mode”5.
When a lockup happens, the processor will repeatedly fetch the same fixed instruction, 0xFFFFFFFE or the instruction which triggered the lockup, in a loop until a reset occurs.
Fun Fact: Whether or not some classes of MemManage or BusFaults trigger a fault from an exception is actually configurable via the MPU_CTRL.HFNMIENA & CCR.BFHFNMIGN register fields, respectively.
Automating the Analysis
At this point we have gone over all the pieces of information which can be manually examined to determine what caused a fault. While this might be fun the first couple times, it can become a tiresome and error prone process if you wind up doing it often. In the following sections we’ll explore how we can automate this analysis!
Halting & Determining Core Register State
What if we are trying to debug an issue that is not easy to reproduce? Even if we have a debugger attached, useful state may be overwritten before we have a chance to halt the debugger and take a look.
The first thing we can do is to programmatically trigger a breakpoint when the system faults:
// NOTE: If you are using CMSIS, the registers can also be
// accessed through CoreDebug->DHCSR & CoreDebug_DHCSR_C_DEBUGEN_Msk
#define HALT_IF_DEBUGGING()                              \
  do {                                                   \
    if ((*(volatile uint32_t *)0xE000EDF0) & (1 << 0)) { \
      __asm("bkpt 1");                                   \
    }                                                    \
} while (0)
Above, we discussed how to hand unroll the register state prior to the exception taking place. Let’s explore how we can instrument the code to make this a less painful process.
First, we can easily define a C struct to represent the register stacking:
typedef struct __attribute__((packed)) ContextStateFrame {
  uint32_t r0;
  uint32_t r1;
  uint32_t r2;
  uint32_t r3;
  uint32_t r12;
  uint32_t lr;
  uint32_t return_address;
  uint32_t xpsr;
} sContextStateFrame;
We can determine the stack pointer that was active prior to the exception using a small assembly shim that applies the logic discussed above and passes the active stack pointer as an argument into my_fault_handler_c:
#define HARDFAULT_HANDLING_ASM(_x)               \
  __asm volatile(                                \
      "tst lr, #4 \n"                            \
      "ite eq \n"                                \
      "mrseq r0, msp \n"                         \
      "mrsne r0, psp \n"                         \
      "b my_fault_handler_c \n"                  \
                                                 )
Finally, we can put together my_fault_handler_c that looks something like:
// Disable optimizations for this function so "frame" argument
// does not get optimized away
__attribute__((optimize("O0")))
void my_fault_handler_c(sContextStateFrame *frame) {
  // If and only if a debugger is attached, execute a breakpoint
  // instruction so we can take a look at what triggered the fault
  HALT_IF_DEBUGGING();

  // Logic for dealing with the exception. Typically:
  //  - log the fault which occurred for postmortem analysis
  //  - If the fault is recoverable,
  //    - clear errors and return back to Thread Mode
  //  - else
  //    - reboot system
}
Now when a fault occurs and a debugger is attached, we will automatically hit a breakpoint and be able to look at the register state!
Re-examining our illegal_instruction_execution example we have:
0x00000244 in my_fault_handler_c (frame=0x200005d8 <ucHeap+1136>) at ./cortex-m-fault-debug/startup.c:94
94	  HALT_IF_DEBUGGING();
(gdb) p/a *frame
$18 = {
  r0 = 0x0 <g_pfnVectors>,
  r1 = 0x200003c4 <ucHeap+604>,
  r2 = 0x10000000,
  r3 = 0xe0000000,
  r12 = 0x200001b8 <ucHeap+80>,
  lr = 0x61 <illegal_instruction_execution+16>,
  return_address = 0xe0000000,
  xpsr = 0x80000000
}
Furthermore, we now have a variable we can read stack info from and a C function we can easily extend for postportem analysis!
Fault Register Analyzers
Instrumenting the code
Many Real Time Operating Systems (RTOS) targeting Cortex-M devices will add options to dump
verbose fault register information to the console upon crash. Some examples include Arm Mbed OS6
and Zephyr7. For example, with Zephyr, the illegal_instruction_execution() crash looks like:
***** MPU FAULT *****
  Instruction Access Violation
***** Hardware exception *****
Current thread ID = 0x20000074
Faulting instruction address = 0xe0000000
Fatal fault in thread 0x20000074! Aborting.
This approach has a couple notable limitations:
- It bloats the code & data size of the binary image and consequently often gets turned off.
- It can increase the stack size requirements for the fault handler (due to printf calls)
- It requires a firmware update to improve or fix issues with the analyzers
- It requires a console session be active to see what fault occurred. Furthermore, this can be flaky if the system is in a crashed state.
Debugger Plugins
Many embedded IDEs expose a system view that can be used to look at registers. The registers will often be decoded into human readable descriptions. These implementations typically leverage the CMSIS System View Description (SVD) format8, a standardized XML file format for describing the memory mapped registers in an ARM MCU. Most silicon vendors expose this information on their own website, ARM’s website9, or provide the files upon request.
You can even load these files in GDB using PyCortexMDebug10, a GDB python script .
To use the utility, all you need to do is update your .gdbinit to use PyPi packages from your environment (instructions here) and then run:
$ git clone git@github.com:bnahill/PyCortexMDebug.git
# Check out Python 2 compatible code
$ git checkout 77af54e
$ cd PyCortexMDebug
$ python setup.py install
When you next start gdb, you can source the svd_gdb.py script and use it to start inspecting registers. Here’s some output for the svd plugin we will use in the examples below:
(gdb) source cmdebug/svd_gdb.py
(gdb) svd_load cortex-m4-scb.svd
(gdb) svd
Available Peripherals:
    ...
	SCB:        System control block
    ...
(gdb) svd SCB
Registers in SCB:
    ...
	CFSR_UFSR_BFSR_MMFSR:      524288  Configurable fault status register
    ...
(gdb) svd SCB CFSR_UFSR_BFSR_MMFSR
Fields in SCB CFSR_UFSR_BFSR_MMFSR:
	IACCVIOL:     0  Instruction access violation flag
	DACCVIOL:     0  Data access violation flag
	MUNSTKERR:    0  Memory manager fault on unstacking for a return from exception
	MSTKERR:      0  Memory manager fault on stacking for exception entry.
	MLSPERR:      0
	MMARVALID:    0  Memory Management Fault Address Register (MMAR) valid flag
	IBUSERR:      1  Instruction bus error
	PRECISERR:    0  Precise data bus error
	IMPRECISERR:  0  Imprecise data bus error
	UNSTKERR:     0  Bus fault on unstacking for a return from exception
	STKERR:       0  Bus fault on stacking for exception entry
	LSPERR:       0  Bus fault on floating-point lazy state preservation
	BFARVALID:    0  Bus Fault Address Register (BFAR) valid flag
	UNDEFINSTR:   0  Undefined instruction usage fault
	INVSTATE:     1  Invalid state usage fault
	INVPC:        0  Invalid PC load usage fault
	NOCP:         0  No coprocessor usage fault.
	UNALIGNED:    0  Unaligned access usage fault
	DIVBYZERO:    0  Divide by zero usage fault
Postmortem Analysis
The previous two approaches are only helpful if we have a debug or physical connection to the device. Once the product has shipped and is out in the field these strategies will not help to triage what went wrong on devices.
One approach is to simply try and reproduce the issue on site. This is a guessing game (are you actually reproducing the same issue the customer hit?), can be a huge time sink and in some cases is not even particularly feasible1.
Another strategy is to log the fault register and stack values to persistent storage and periocially collect or push the error logs. On the server side, the register values can be decoded and addresses can be symbolicated to try to root cause the crash.
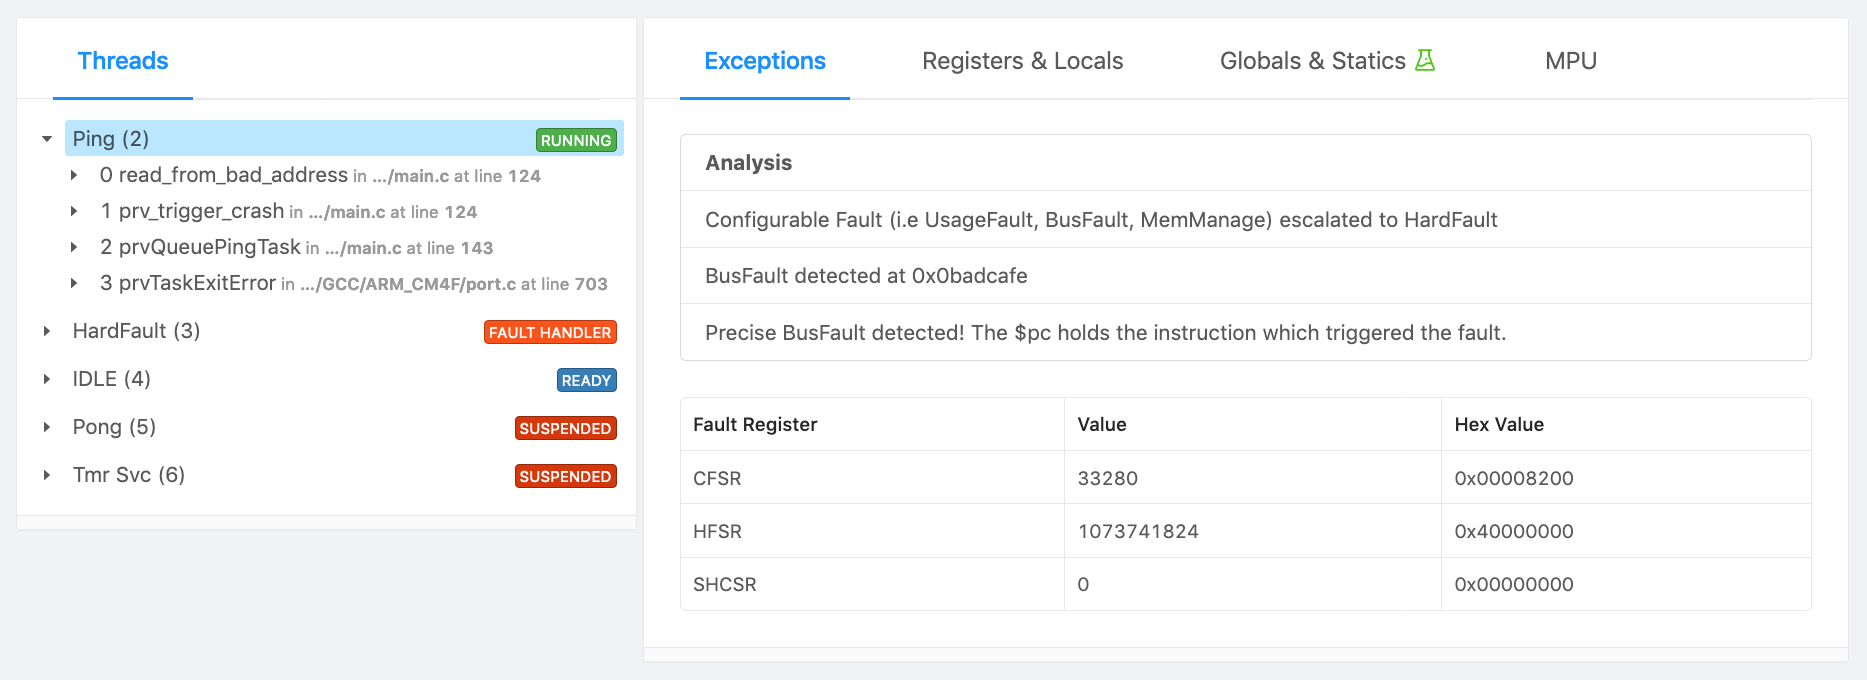
Alternatively, an end-to-end firmware error analysis system, such as Memfault, can be used to automatically collect, transport, deduplicate and surface the faults and crashes happening in the field. Here is some example output from Memfault for the bad memory read example we will walk through below:
Recovering From A Fault
DISCLAIMER: Typically when a fault occurs, the best thing to do is reset the MCU since it’s hard to be certain what parts of the MCU were corrupted as part of the fault (embedded MCUs don’t offer a MMU like you would find on a bigger processors).
Occasionally, you may want to recover the system from a fault without rebooting it. For example, maybe you have one RTOS task isolated by the MPU that just needs to be restarted.
Let’s quickly explore how we could implement a recovery mechanism that puts a RTOS task which experience a UsageFault into an idle loop and reboots the system otherwise.
We will use the
Application Interrupt and Reset Control Register to reset the device if the fault is unrecoverable. We can easily extend my_fault_handler_c from above:
void my_fault_handler_c(sContextStateFrame *frame) {
[...]
  volatile uint32_t *cfsr = (volatile uint32_t *)0xE000ED28;
  const uint32_t usage_fault_mask = 0xffff0000;
  const bool non_usage_fault_occurred =
      (*cfsr & ~usage_fault_mask) != 0;
  // the bottom 8 bits of the xpsr hold the exception number of the
  // executing exception or 0 if the processor is in Thread mode
  const bool faulted_from_exception = ((frame->xpsr & 0xFF) != 0);

  if (faulted_from_exception || non_usage_fault_occurred) {
    // For any fault within an ISR or non-usage faults
    // let's reboot the system
    volatile uint32_t *aircr = (volatile uint32_t *)0xE000ED0C;
    *aircr = (0x05FA << 16) | 0x1 << 2;
    while (1) { } // should be unreachable
  }
[...]
}
Now, the interesting part, how do we clean up our state and return to normal code from the HardFault handler?!
There’s a few things we will need to do:
- Clear any logged faults from the
CFSRby writing 1 to each bit which is set. - Change the function we return to so we idle the task. In the example case it’s
recover_from_task_fault. - Scribble a known pattern over the
lr. The function we are returning to will need to take special action (i.e like deleting the task or entering awhile(1)loop). It can’t just exit and branch to where we were before so we want to fault if this is attempted. - Reset the
xpsr. Among other things the xpsr tracks the state of previous comparison instructions which were run and whether or not we are in the middle of a “If-Then” instruction block. The only bit that needs to remain set is the “T” field (bit 24) indicating the processor is in thumb mode11.
This winds up looking like:
  // Clear any logged faults from the CFSR
  *cfsr |= *cfsr;
  // the instruction we will return to when we exit from the exception
  frame->return_address = (uint32_t)recover_from_task_fault;
  // the function we are returning to should never branch
  // so set lr to a pattern that would fault if it did
  frame->lr = 0xdeadbeef;
  // reset the psr state and only leave the
  // "thumb instruction interworking" bit set
  frame->xpsr = (1 << 24);
You may recall from the
RTOS Context Switching post
that fault handlers can work just like regular C functions so after these changes we will exit from
my_fault_handler_c and start executing whatever is in recover_from_task_fault function. We will walk through an example of this below.
Examples
In the sections below we will walk through the analysis of a couple faults.
For this setup we will use:
- a nRF52840-DK12 (ARM Cortex-M4F) as our development board
- SEGGER JLinkGDBServer13 as our GDB Server.
- GCC 8.3.1 / GNU Arm Embedded Toolchain as our compiler14
- GNU make as our build system
All the code can be found on the Interrupt Github page with more details in the README in the directory linked.
Setup
Start a GDB Server:
JLinkGDBServer -if swd -device nRF52840_xxAA
Follow the instructions above to setup support for reading SVD files from GDB, build, and flash the example app:
$ make
[...]
Linking library
Generated build/nrf52.elf
$ arm-none-eabi-gdb-py --eval-command="target remote localhost:2331" --ex="mon reset" --ex="load" --ex="mon reset" --se=build/nrf52.elf
$ source PyCortexMDebug/cmdebug/svd_gdb.py
$ (gdb) svd_load cortex-m4-scb.svd
Loading SVD file cortex-m4-scb.svd...
(gdb)
The app has eight different crashes you can configure by changing FAULT_EXAMPLE_CONFIG at compile time or by editing the value at runtime:
(gdb) break main
(gdb) continue
(gdb) set g_crash_config=1
(gdb) continue
eXecute Never Fault
Code
int illegal_instruction_execution(void) {
  int (*bad_instruction)(void) = (void *)0xE0000000;
  return bad_instruction();
}
Analysis
(gdb) break main
(gdb) continue
Breakpoint 1, main () at ./cortex-m-fault-debug/main.c:180
180	  xQueue = xQueueCreate(mainQUEUE_LENGTH, sizeof(unsigned long));
(gdb) set g_crash_config=0
(gdb) c
Continuing.

Program received signal SIGTRAP, Trace/breakpoint trap.
0x00000218 in my_fault_handler_c (frame=0x200005e8 <ucHeap+1152>) at ./cortex-m-fault-debug/startup.c:91
91	  HALT_IF_DEBUGGING();
(gdb) bt
#0  0x00000218 in my_fault_handler_c (frame=0x200005e8 <ucHeap+1152>) at ./cortex-m-fault-debug/startup.c:91
#1  <signal handler called>
#2  0x00001468 in prvPortStartFirstTask () at ./cortex-m-fault-debug/freertos_kernel/portable/GCC/ARM_CM4F/port.c:267
#3  0x000016e6 in xPortStartScheduler () at ./cortex-m-fault-debug/freertos_kernel/portable/GCC/ARM_CM4F/port.c:379
#4  0x1058e476 in ?? ()
We can check the CFSR to see if there is any information about the fault which occurred.
(gdb) p/x *(uint32_t*)0xE000ED28
$3 = 0x1
(gdb) svd SCB CFSR_UFSR_BFSR_MMFSR
Fields in SCB CFSR_UFSR_BFSR_MMFSR:
	IACCVIOL:     1  Instruction access violation flag
[...]
That’s interesting! We hit a Memory Management instruction access violation fault even though we haven’t enabled any MPU regions. From the CFSR, we know that the stacked frame is valid so we can take a look at that to see what it reveals:
(gdb) p/a *frame
$1 = {
  r0 = 0x0 <g_pfnVectors>,
  r1 = 0x200003c4 <ucHeap+604>,
  r2 = 0x10000000,
  r3 = 0xe0000000,
  r12 = 0x200001b8 <ucHeap+80>,
  lr = 0x195 <prvQueuePingTask+52>,
  return_address = 0xe0000000,
  xpsr = 0x80000000
}
We can clearly see that the executing instruction was 0xe0000000 and that the calling function was prvQueuePingTask.
From the ARMv7-M reference manual15 we find:
The MPU is restricted in how it can change the default memory map attributes associated with System space, that is, for addresses 0xE0000000 and higher. System space is always marked as XN, Execute Never.
So the fault registers didn’t lie to us, and it does make sense that we hit a memory management fault!
Bad Address Read
Code
uint32_t read_from_bad_address(void) {
  return *(volatile uint32_t *)0xbadcafe;
}
Analysis
(gdb) break main
(gdb) continue
Breakpoint 1, main () at ./cortex-m-fault-debug/main.c:189
189	  xQueue = xQueueCreate(mainQUEUE_LENGTH, sizeof(unsigned long));
(gdb) set g_crash_config=1
(gdb) c
Continuing.

Program received signal SIGTRAP, Trace/breakpoint trap.
0x00000218 in my_fault_handler_c (frame=0x200005e8 <ucHeap+1152>) at ./cortex-m-fault-debug/startup.c:91
91	  HALT_IF_DEBUGGING();
Again, let’s take a look at the CFSR and see if it tells us anything useful.
(gdb) p/x *(uint32_t*)0xE000ED28
$13 = 0x8200
(gdb) svd SCB CFSR_UFSR_BFSR_MMFSR
Fields in SCB CFSR_UFSR_BFSR_MMFSR:
[...]
    PRECISERR:    1  Precise data bus error
[...]
    BFARVALID:    1  Bus Fault Address Register (BFAR) valid flag
Great, we have a precise bus fault which means the return address in the stack frame holds the instruction which triggered the fault and that we can read BFAR to determine what memory access triggered the fault!
(gdb) svd/x SCB BFAR
Fields in SCB BFAR:
	BFAR:  0x0BADCAFE  Bus fault address

(gdb) p/a *frame
$16 = {
  r0 = 0x1 <g_pfnVectors+1>,
  r1 = 0x200003c4 <ucHeap+604>,
  r2 = 0x10000000,
  r3 = 0xbadcafe,
  r12 = 0x200001b8 <ucHeap+80>,
  lr = 0x195 <prvQueuePingTask+52>,
  return_address = 0x13a <trigger_crash+22>,
  xpsr = 0x81000000
}

(gdb) info line *0x13a
Line 123 of "./cortex-m-fault-debug/main.c" starts at address 0x138 <trigger_crash+20> and ends at 0x13e <trigger_crash+26>.

(gdb) list *0x13a
0x13a is in trigger_crash (./cortex-m-fault-debug/main.c:123).
118	  switch (crash_id) {
119	    case 0:
120	      illegal_instruction_execution();
121	      break;
122	    case 1:
===> FAULT HERE
123	      read_from_bad_address();
124	      break;
125	    case 2:
126	      access_disabled_coprocessor();
127	      break;
Great, so we have pinpointed the exact code which triggered the issue and can now fix it!
Coprocessor Fault
Code
void access_disabled_coprocessor(void) {
  // FreeRTOS will automatically enable the FPU co-processor.
  // Let's disable it for the purposes of this example
  __asm volatile(
      "ldr r0, =0xE000ED88 \n"
      "mov r1, #0 \n"
      "str r1, [r0]	\n"
      "dsb \n"
      "vmov r0, s0 \n"
      );
}
Analysis
(gdb) break main
(gdb) continue
Breakpoint 4, main () at ./cortex-m-fault-debug/main.c:180
180	  xQueue = xQueueCreate(mainQUEUE_LENGTH, sizeof(unsigned long));
(gdb) set g_crash_config=2
(gdb) c
Continuing.

Program received signal SIGTRAP, Trace/breakpoint trap.
0x00000218 in my_fault_handler_c (frame=0x20002d80) at ./cortex-m-fault-debug/startup.c:91
91	  HALT_IF_DEBUGGING();
We can inspect CFSR to get a clue about the crash which took place
(gdb) p/x *(uint32_t*)0xE000ED28
$13 = 0x8200
(gdb) svd SCB CFSR_UFSR_BFSR_MMFSR
Fields in SCB CFSR_UFSR_BFSR_MMFSR:
[...]
	NOCP:         1  No coprocessor usage fault.
[...]
We see it was a coprocessor UsageFault which tells us we either issued an instruction to a non-existent or disabled Cortex-M coprocessor. We know the frame contents are valid so we can inspect that to figure out where the fault originated:
(gdb) p/a *frame
$27 = {
  r0 = 0xe000ed88,
  r1 = 0x0 <g_pfnVectors>,
  r2 = 0x10000000,
  r3 = 0x0 <g_pfnVectors>,
  r12 = 0x200001b8 <ucHeap+80>,
  lr = 0x199 <prvQueuePingTask+52>,
  return_address = 0x114 <access_disabled_coprocessor+12>,
  xpsr = 0x81000000
}

(gdb) disassemble 0x114
Dump of assembler code for function access_disabled_coprocessor:
   0x00000108 <+0>:	ldr	r0, [pc, #16]	; (0x11c)
   0x0000010a <+2>:	mov.w	r1, #0
   0x0000010e <+6>:	str	r1, [r0, #0]
   0x00000110 <+8>:	dsb	sy
===> FAULT HERE on a Floating Point instruction
   0x00000114 <+12>:	vmov	r0, s0
   0x00000118 <+16>:	bx	lr
vmov is a floating point instruction so we now know what coprocessor the NOCP was caused by. The FPU is enabled using bits 20-23 of the CPACR register located at 0xE000ED88. A value of 0 indicates the extension is disabled. Let’s check it:
(gdb) p/x (*(uint32_t*)0xE000ED88 >> 20) & 0xf
$29 = 0x0
We can clearly see the FP Extension is disabled. We will have to enable the FPU to fix our bug.
Imprecise Fault
Code
void bad_addr_double_word_write(void) {
  volatile uint64_t *buf = (volatile uint64_t *)0x30000000;
  *buf = 0x1122334455667788;
}
Analysis
(gdb) break main
(gdb) continue
Breakpoint 4, main () at ./cortex-m-fault-debug/main.c:182
182	  xQueue = xQueueCreate(mainQUEUE_LENGTH, sizeof(unsigned long));
(gdb) set g_crash_config=3
(gdb) c
Continuing.

Program received signal SIGTRAP, Trace/breakpoint trap.
0x0000021c in my_fault_handler_c (frame=0x200005e8 <ucHeap+1152>) at ./cortex-m-fault-debug/startup.c:91
91	  HALT_IF_DEBUGGING();
Let’s inspect CFSR:
(gdb) p/x *(uint32_t*)0xE000ED28
$31 = 0x400
(gdb) svd SCB CFSR_UFSR_BFSR_MMFSR
Fields in SCB CFSR_UFSR_BFSR_MMFSR:
[...]
	IMPRECISERR:  1  Imprecise data bus error
[...]
Yikes, the error is imprecise. This means the stack frame will point to the general area where the fault occurred but not the exact instruction!
(gdb) p/a *frame
$32 = {
  r0 = 0x55667788,
  r1 = 0x11223344,
  r2 = 0x10000000,
  r3 = 0x30000000,
  r12 = 0x200001b8 <ucHeap+80>,
  lr = 0x199 <prvQueuePingTask+52>,
  return_address = 0x198 <prvQueuePingTask+52>,
  xpsr = 0x81000000
}
(gdb) list *0x198
0x198 is in prvQueuePingTask (./cortex-m-fault-debug/main.c:162).
157
158	  while (1) {
159	    vTaskDelayUntil(&xNextWakeTime, mainQUEUE_SEND_FREQUENCY_MS);
160	    xQueueSend(xQueue, &ulValueToSend, 0U);
161
==> Crash somewhere around here
162	    trigger_crash(g_crash_config);
163	  }
164	}
165
166	static void prvQueuePongTask(void *pvParameters) {
Analysis after making the Imprecise Error Precise
If the crash was not readily reproducible we would have to inspect the code around this region and hypothesize what looks suspicious. However, recall that there is a trick we can use for the Cortex-M4 to make all memory stores precise. Let’s enable that and re-examine:
(gdb) mon reset
Resetting target
(gdb) c
Continuing.

Breakpoint 4, main () at ./cortex-m-fault-debug/main.c:182
182	  xQueue = xQueueCreate(mainQUEUE_LENGTH, sizeof(unsigned long));
(gdb) set g_crash_config=3

==> Make all memory stores precise at the cost of performance
==> by setting DISDEFWBUF in the Cortex M3/M4 ACTLR reg
(gdb) set *(uint32_t*)0xE000E008=(*(uint32_t*)0xE000E008 | 1<<1)

(gdb) c
Continuing.

Program received signal SIGTRAP, Trace/breakpoint trap.
0x0000021c in my_fault_handler_c (frame=0x200005e8 <ucHeap+1152>) at ./cortex-m-fault-debug/startup.c:91
91	  HALT_IF_DEBUGGING();
(gdb) p/a *frame
$33 = {
  r0 = 0x55667788,
  r1 = 0x11223344,
  r2 = 0x10000000,
  r3 = 0x30000000,
  r12 = 0x200001b8 <ucHeap+80>,
  lr = 0x199 <prvQueuePingTask+52>,
  return_address = 0xfa <bad_addr_double_word_write+10>,
  xpsr = 0x81000000
}
(gdb) list *0xfa
0xfa is in bad_addr_double_word_write (./cortex-m-fault-debug/main.c:92).
90	void bad_addr_double_word_write(void) {
91	  volatile uint64_t *buf = (volatile uint64_t *)0x30000000;
==> FAULT HERE
92	  *buf = 0x1122334455667788;
93	}
(gdb)
Awesome, that saved us some time … we were able to determine the exact line that caused the crash!
Fault Entry Exception
Code
void stkerr_from_psp(void) {
  extern uint32_t _start_of_ram[];
  uint8_t dummy_variable;
  const size_t distance_to_ram_bottom =
      (uint32_t)&dummy_variable - (uint32_t)_start_of_ram;
  volatile uint8_t big_buf[distance_to_ram_bottom - 8];
  for (size_t i = 0; i < sizeof(big_buf); i++) {
    big_buf[i] = i;
  }

  trigger_irq();
}
Analysis
(gdb) break main
(gdb) continue
Breakpoint 4, main () at ./cortex-m-fault-debug/main.c:182
182	  xQueue = xQueueCreate(mainQUEUE_LENGTH, sizeof(unsigned long));
(gdb) set g_crash_config=4
(gdb) c
Continuing.

Program received signal SIGTRAP, Trace/breakpoint trap.
0x0000021c in my_fault_handler_c (frame=0x1fffffe0) at ./cortex-m-fault-debug/startup.c:91
91	  HALT_IF_DEBUGGING();
Let’s take a look at CFSR again to get a clue about what happened:
(gdb) p/x *(uint32_t*)0xE000ED28
$39 = 0x1000
(gdb) svd SCB CFSR_UFSR_BFSR_MMFSR
Fields in SCB CFSR_UFSR_BFSR_MMFSR:
[...]
	STKERR:       1  Bus fault on stacking for exception entry
Debug Tips when dealing with a STKERR
There are two really important things to note when a stacking exception occurs:
- The stack pointer will always reflect the correct adjusted position as if the hardware successfully stacked the registers. This means you can find the stack pointer prior to exception entry by adding the adjustment value.
- Depending on what access triggers the exception, the stacked frame may be partially valid. For example, the very last store of the hardware stacking could trigger the fault and all the other stores could be valid. However, the order the hardware pushes register state on the stack is implementation specific. So when inspecting the frame assume the values being looked at may be invalid!
Taking this knowledge into account, let’s examine the stack frame:
(gdb) p frame
$40 = (sContextStateFrame *) 0x1fffffe0
Interestingly, if we look up the memory map of the NRF5216, we will find that RAM starts at 0x20000000. Our stack pointer location, 0x1fffffe0 is right below that in an undefined memory region. This must be why we faulted! We see that the stack pointer is 32 bytes below RAM, which matches the size of sContextStateFrame. This unfortunately means none of the values stacked will be valid since all stores were issued to a non-existent address space!
We can manually walk up the stack to get some clues:
(gdb) x/a 0x20000000
0x20000000 <uxCriticalNesting>:	0x3020100
(gdb)
0x20000004 <g_crash_config>:	0x7060504
(gdb)
0x20000008 <xQueue>:	0xb0a0908
(gdb)
0x2000000c <s_buffer>:	0xf0e0d0c
(gdb)
0x20000010 <s_buffer+4>:	0x13121110
(gdb)
0x20000014 <s_buffer+8>:	0x17161514
(gdb)
0x20000018 <pxCurrentTCB>:	0x1b1a1918
(gdb)
0x2000001c <pxDelayedTaskList>:	0x1f1e1d1c
(gdb)
0x20000020 <pxOverflowDelayedTaskList>:	0x23222120
It looks like the RAM has a pattern of sequentially increasing values and that the RAM addresses map to different variables in our code (i.e pxCurrentTCB). This suggests we overflowed the stack we were using and started to clobber RAM in the system until we ran off the end of RAM!
TIP: To catch this type of failure sooner consider using an MPU Region
Since the crash is reproducible, let’s leverage a watchpoint and see if we can capture the stack corruption in action! Let’s add a watchpoint for any access near the bottom of RAM, 0x2000000c:
(gdb) mon reset
(gdb) continue
Breakpoint 4, main () at ./cortex-m-fault-debug/main.c:182
182	  xQueue = xQueueCreate(mainQUEUE_LENGTH, sizeof(unsigned long));
(gdb) set g_crash_config=4
(gdb) watch *(uint32_t*)0x2000000c
Hardware watchpoint 9: *(uint32_t*)0x2000000c
TIP: Sometimes it will take a couple tries to choose the right RAM range to watch. It’s possible an area of the stack never gets written to and the watchpoint never fires or that the memory address being watched gets updated many many times before the actual failure. In this example, I intentionally opted not to watch 0x20000000 because that is the address of a FreeRTOS variable,
uxCriticalNestingwhich is updated a lot.
Let’s continue and see what happens:
(gdb) continue
Hardware watchpoint 9: *(uint32_t*)0x2000000c

Old value = 0
New value = 12
0x000000c0 in stkerr_from_psp () at ./cortex-m-fault-debug/main.c:68
68	    big_buf[i] = i;
(gdb) bt
#0  0x000000c0 in stkerr_from_psp () at ./cortex-m-fault-debug/main.c:68
#1  0x00000198 in prvQueuePingTask (pvParameters=<optimized out>) at ./cortex-m-fault-debug/main.c:162
#2  0x00001488 in ?? () at ./cortex-m-fault-debug/freertos_kernel/portable/GCC/ARM_CM4F/port.c:703
Backtrace stopped: previous frame identical to this frame (corrupt stack?)
(gdb) list *0xc0
0xc0 is in stkerr_from_psp (./cortex-m-fault-debug/main.c:68).
63	  extern uint32_t _start_of_ram[];
64	  uint8_t dummy_variable;
65	  const size_t distance_to_ram_bottom = (uint32_t)&dummy_variable - (uint32_t)_start_of_ram;
66	  volatile uint8_t big_buf[distance_to_ram_bottom - 8];
67	  for (size_t i = 0; i < sizeof(big_buf); i++) {
68	    big_buf[i] = i;
69	  }
70
71	  trigger_irq();
72	}
Great, we’ve found a variable located on the stack big_buf being updated. It must be this function call path which is leading to a stack overflow. We can now inspect the call chain and remove big stack allocations!
Recovering from a UsageFault without a SYSRESET
In this example we’ll just step through the code we developed above and confirm we don’t reset when a UsageFault occurs.
Code
void unaligned_double_word_read(void) {
  extern void *g_unaligned_buffer;
  uint64_t *buf = g_unaligned_buffer;
  *buf = 0x1122334455667788;
}
Analysis
(gdb) break main
(gdb) continue
Breakpoint 4, main () at ./cortex-m-fault-debug/main.c:188
188	  xQueue = xQueueCreate(mainQUEUE_LENGTH, sizeof(unsigned long));
(gdb) set g_crash_config=5
(gdb) c
Continuing.

Program received signal SIGTRAP, Trace/breakpoint trap.
0x00000228 in my_fault_handler_c (frame=0x200005e8 <ucHeap+1152>) at ./cortex-m-fault-debug/startup.c:94
94	  HALT_IF_DEBUGGING();
We have entered the breakpoint in the fault handler. We can step over it and confirm we fall through to the recover_from_task_fault function.
(gdb) break recover_from_task_fault
Breakpoint 12 at 0x1a8: file ./cortex-m-fault-debug/main.c, line 181.
(gdb) n
108	  volatile uint32_t *cfsr = (volatile uint32_t *)0xE000ED28;
(gdb) c
Continuing.

Breakpoint 12, recover_from_task_fault () at ./cortex-m-fault-debug/main.c:181
181	void recover_from_task_fault(void) {

(gdb) list *recover_from_task_fault
0x1a8 is in recover_from_task_fault (./cortex-m-fault-debug/main.c:181).
181	void recover_from_task_fault(void) {
182	  while (1) {
183	    vTaskDelay(1);
184	  }
185	}
If we continue from here we will see the system happily keeps running because the thread which was calling the problematic trigger_crash function is now parked in a while loop. The the while loop could be extended in the future to delete and/or restart the FreeRTOS task if we wanted as well.
Closing
I hope this post gave you a useful overview of how to debug a HardFault on a Cortex-M MCU and that maybe you even learned something new!
Are there tricks you like to use that I didn’t mention or other topics about faults you’d like to learn more about? Let us know in the discussion area below!
Interested in learning more about debugging HardFaults? Watch this webinar recording..
See anything you'd like to change? Submit a pull request or open an issue on our GitHub
References
-
Segger JTrace & Lauterbach Trace32 are both capable of analyzing the ETM ↩
-
See “B1.5.5 Reset behavior” & “B1.4.2 The special-purpose program status registers, xPSR” ↩
 Chris Coleman is a founder and CTO at Memfault. Prior to founding Memfault, Chris worked on the embedded software teams at Sun, Pebble, and Fitbit.