A Guide to Watchdog Timers for Embedded Systems
At some point you’ve probably had to unplug and plug back in an electronic device to get it to work again! System freezes and hangs are not only frustrating to an end user, but they can also be quite challenging to debug and fix.
For some classes of devices, such as a satellite1, a manual reset is not even possible, making a wedged device a multi-million dollar “brick”. As firmware engineers, we must make sure our systems can always recover from a stuck task, or an infinite loop. This is best accomplished with a watchdog.
In this article we will discuss the last line of defense in embedded systems – watchdogs. We will walk through a step-by-step example of how to implement a watchdog subsystem, incorporating a “hardware” and “software” watchdog, and examine effective strategies for root causing the underlying problems leading to these hangs.
Table of Contents
The Hardware Watchdog
Most chip vendors include an isolated RTL block known as a “Watchdog Timer” in a MCU. This peripheral is comprised of a counter which decrements automatically by the hardware each clock cycle. When the count reaches zero, the hardware will automatically reset the device.
The peripheral is typically disabled by default and it’s the programmers responsibility to configure and enable it in software. Once enabled, the system software needs to reset the counter periodically to prevent the device from rebooting. This operation is usually referred to as “feeding”, “kicking”, or “patting” the dog. The rationale here is if software is unable to reset the watchdog counter, the system is not running as expected and needs to be reset to get back to a sane state.
NOTE: It also worth mentioning that for some systems where catching system hangs is mission critical, there are even dedicated ICs which can be used2. For these chips, the watchdog is usually “fed” by toggling a GPIO line from the MCU being monitored.
Why should I use a Watchdog?
There are numerous ways an embedded device can hang. Some of the most common I’ve run into over the years include:
- Memory gets corrupted and code winds up in an infinite loop
- A hardware component (such as a HRM, Accelerometer, or NOR Flash Chip) is wedged and not responding to requests.
- One or more tasks become deadlocked because mutexes were grabbed in the wrong order or weren’t released.
- A higher priority RTOS task (e.g. a UI task) is using so many CPU cycles that lower priority tasks (like a WiFi task) never get to run preventing sensor data from being published to your cloud service.
Whether you are still in the development phase of a project or have millions of devices in the field, the embedded system should have a watchdog subsystem in place. It is the best way to identify system hangs and collect enough information to be able to root cause the underlying issue and deliver a fix.
Configuring a Hardware Watchdog
When first configuring a hardware watchdog, it’s important to read the fine print in the datasheet about how the peripheral works. The peripheral is vendor specific so even if you are using the same chip family (e.g. an ARM Cortex-M MCU) the behavior of the watchdog peripheral will be different. Nuances in implementations can lead to unexpected issues later on. Let’s walk through a quick list of things to check.
When does the watchdog configuration get reset?
Typically, you’ll see one of:
- The watchdog can be enabled and disabled multiple times and must be configured on each boot.
- The watchdog can only be configured and enabled once. Once enabled, only certain types of resets (e.g. a “Power on Reset” (POR)) will disable the watchdog).
How does the watchdog behave with a debugger?
The watchdog is often disabled by developers for debug builds in an effort to prevent resets on boards actively being developed. However, I would argue this is a big mistake. This almost always leads to issues going unnoticed until a release build is cut that could have been identified and fixed in the development phase instead.
A less known fact is that most MCU vendors have special configurations that can be used while the system is halted to pause the watchdog timer. That way, if you add a breakpoint and are inspecting code, you don’t have to worry about a watchdog firing. Not all hardware supports this feature however. In these scenarios, the debugger can be configured to issue register writes that pause or feed the peripheral. We will explore an example of how to do this with GDB later in the article.
Fun Fact: For Cortex-M’s, I’ve always been very impressed with the configuration options that STMicroelectronics exposes for STM32s via the DBGMCU component. From there one can chose to “freeze” any peripheral clock while the system is halted.
What happens when the watchdog expires?
Some of the typical options you will see are:
- When the watchdog expires, the hardware will immediately reset the system.
- An interrupt can be enabled which will fire when the watchdog timer is getting close to expiration. In the interrupt handler, the software can decide to “feed” the watchdog to prevent the system from resetting.
- An interrupt can be enabled which will fire when the watchdog expires. The MCU will give you a few extra clock cycles to do cleanup and then reset the MCU. I find this variant to be one of the more frustrating ones because, unless you are very careful about how many cycles your cleanup code takes to execute, the hardware may reset the system in the middle of cleanup!
How do I find out if a watchdog reset took place?
Almost every silicon vendor exposes information about the type of hardware reset which took place via a register. If the MCU implements a watchdog peripheral, one of the bits within the register will indicate if a watchdog reset took place.
Implementation Note: Typically, the settings in these registers are “sticky”. That is, after you read them on boot, you will need to clear them. Otherwise, you will keep seeing the same value every time the system boots until a full Power-On-Reset occurs.
Examples of Reset Reason Register Name By Vendor
Here are some of the names used for the reset reason register based on chip family:
| Silicon Vendor | Chip Family | Register Name |
|---|---|---|
| Espressif Systems | ESP32 | RTC_CNTL_RESET_CAUSE[PROCPU/APPCPU] |
| Maxim Integrated | MAX32 | PWRSEQ_FLAGS |
| NXP | LPC | AOREG1 |
| Nordic Semiconductor | NRF52 | RESETREAS |
| STMicroelectronics | STM32F | RCC_CSR |
| STMicroelectronics | STM32H | RCC_RSR |
Enabling a Hardware Watchdog in a System
Now that we have a basic foundation of what a watchdog is and how it works, let’s apply what we have learned, configure a watchdog, and use it to track down hangs in a real system.
We will walk through a provided example app running FreeRTOS which passes a message between two tasks. I’ve instrumented the code such that there are a variety of different ways the software can hang.
Example Project Setup
The example app can be downloaded from Interrupt’s Github page
$ git clone git@github.com:memfault/interrupt.git
$ cd interrupt/example/watchdog-example/
For testing the example code, we will be using:
- the GNU Arm Embedded Toolchain 9-2019-q4-update3 for our compiler
- the nRF52840-DK4 (ARM Cortex-M4F) as our development board
- SEGGER JLinkGDBServer5 as our GDB Server.
Examining the NRF52840 Hardware Watchdog Behavior
Let’s take a look at the NRF52840 datasheet6 and see if we can answer the questions from above. The “6.36 WDT — Watchdog timer” section of the datasheet is a good place to start.
1. Configuration Reset Behavior
From “6.36.3 Watchdog reset”:
The watchdog must be configured before it is started. After it is started, the watchdog’s configuration registers, which comprise registers CRV, RREN, and CONFIG, will be blocked for further configuration. The watchdog can be reset from several reset sources, see Reset behavior on page 70 […]

The important takeaway here is that a normal reset (“Soft reset”) does not reset the watchdog timer. This could cause issues, for example, if the main application enabled the watchdog but the bootloader wasn’t aware. If the bootloader performed a long running operation such as a firmware update, the watchdog would still be running and might reset the system in the middle of the process!
NOTE: In the case of the NRF52, the bootloader provided with the SDK does feed the watchdog if it was enabled by the main application.
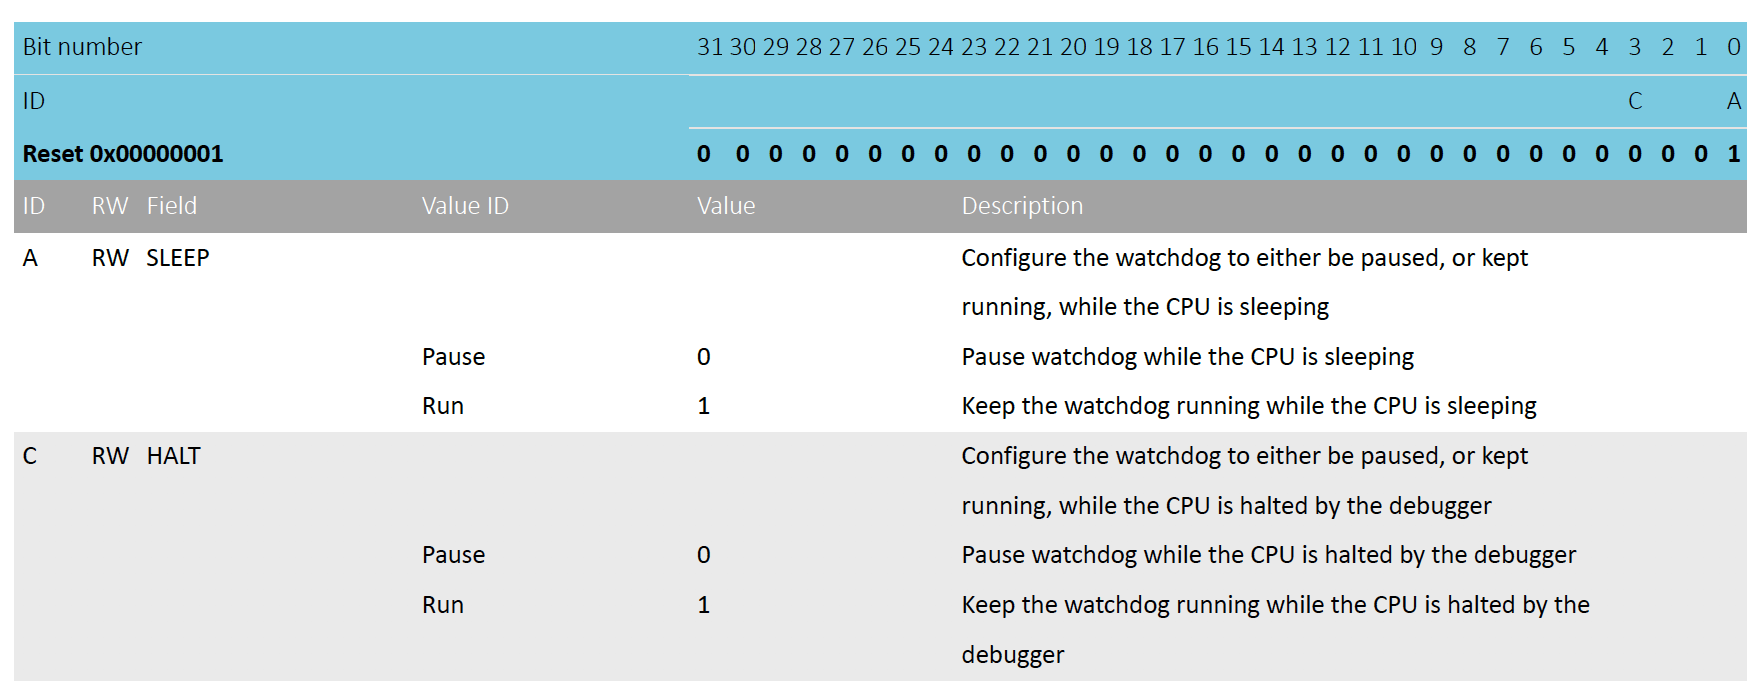
2. Behavior with a debugger
From “6.36.2 Temporarily pausing the watchdog” we have:
By default, the watchdog will be active counting down the down-counter while the CPU is sleeping and when it is halted by the debugger. It is however possible to configure the watchdog to automatically pause while the CPU is sleeping as well as when it is halted by the debugger.
Great! So when a debugger is attached we can configure the peripheral to pause the counter. This will allow us to debug issues without worrying about a system reset as soon as we continue.
Reading further into the datasheet, it actually looks like the documentation is not entirely correct. By default, the watchdog is disabled for us when the debugger is halted (bit 3 defaults to 0) so we can just leverage the chip default configuration!
3. Watchdog Expiration Behavior
From “6.36.3 Watchdog reset” we have:
If the watchdog is configured to generate an interrupt on the TIMEOUT event, the watchdog reset will be postponed with two 32.768 kHz clock cycles after the TIMEOUT event has been generated. Once the TIMEOUT event has been generated, the impending watchdog reset will always be effectuated.
So an interrupt can be enabled to fire upon a watchdog timeout. However, once the interrupt fires there will only be two 32kHz clock cycles before the system reboots anyway. The CPU core of the NRF52840 runs at 64 MHz so in practice this means we would only have about (64MHz * 2) / 32768 = 3900 core clock cycles to do any cleanup.
NOTE: To avoid running the risk of a reset during cleanup we will avoid using this feature and explore alternatives later in the article.
4. RESETREAS
Section “5.3.7.11 RESETREAS” of the data sheet contains a summary of the reset reasons.
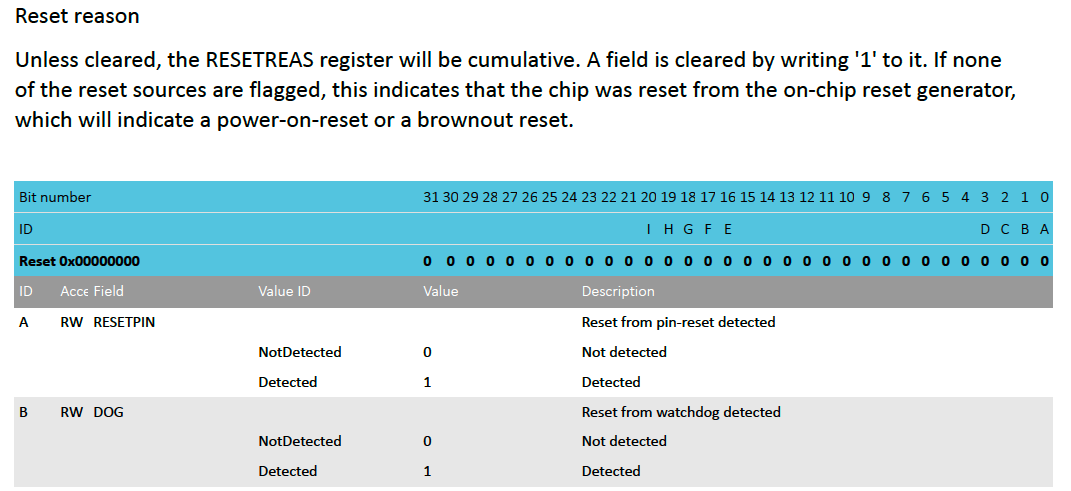
The important things to note here are that reading bit 1 will tell us whether or not a watchdog reset took place and that we will have to write 1 to the bits we want to clear so they don’t stick across reboots.
Choosing a timeout value
Since the watchdog is really a last line of defense, I like to choose a timeout that is much larger
than the time it should take to handle a majority of the events being serviced by the RTOS task or
baremetal while() loop. A good rule of thumb is to use a timeout somewhere in the 5-30 second range. For the purposes of this demo, we will use a timeout of 10 seconds.
Configuring the NRF52 Hardware Watchdog
Okay, now that we understand how the NRF52840 hardware watchdog peripheral works, let’s enable it!
We know the NRF52840 watchdog is comprised of three configuration registers that can only be set once: CRV, RREN, and CONFIG.
From the discussion above, we also know that the default CONFIG register
value matches what we want (pause the watchdog while the system is halted at a breakpoint).
The RRENregister allows us to configure the number of “reload request registers” that can be used to
request that the watchdog counter gets reloaded. There are eight “reload request registers” and by
default only one is enabled. For the hardware watchdog to get its counter reset all the enabled
“reload request registers” must be written to. One use case for enabling multiple reload request registers would be to
independently monitor different tasks or state machines in the system. For the purposes of this example, we’ll use the
default configuration here with only the first “reload request register” enabled.
Code to Enable the NRF52840 Watchdog
So our configuration code reduces to:
// hardware_watchdog.c
// ...
#define HARDWARE_WATCHDOG_TIMEOUT_SECS 10
// ...
void hardware_watchdog_enable(void) {
  if ((WDT->RUNSTATUS & 0x1) != 0) {
    // the watchdog is already running and cannot be configured
    return;
  }

  // "Counter reload value" - The number of 32.768kHz
  // clock cycles to elapse before a watchdog timeout
  WDT->CRV = 32768 * HARDWARE_WATCHDOG_TIMEOUT_SECS;

  // Enables the watchdog peripheral
  WDT->TASKS_START = 0x1;
}
Code to Feed the NRF52840 Watchdog
We’ll also need a routine we can call to feed the watchdog. Recall we have enabled the first “reload request register” so we will have to write to that register to cause the watchdog count down to be restarted.
// hardware_watchdog.c
void hardware_watchdog_feed(void) {
  // Per "6.36.4.10" if this value is written to a reload
  // register that is enabled, the watchdog counter will be reset
  //
  // NOTE: It's common to see "magic" numbers as reload values
  // in an effort to prevent a bad memory access from
  // inadvertently resetting the watchdog
  const uint32_t reload_magic_value = 0x6E524635;
  WDT->RR[0] = reload_magic_value;
}
Checking the Hardware Reboot Reason
I’ve also instrumented the example app to check and reset the RESETREAS. If a watchdog took place, a breakpoint instruction will automatically be executed:
// main.c
static void prv_check_and_reset_reboot_reason(void) {
  const uint32_t last_reboot_reason = *RESETREAS;
  // clear any enabled reset reasons
  *RESETREAS |= *RESETREAS;
  // Halt the system on boot-up if a
  // Watchdog Reset took place
  const uint32_t watchdog_reset_mask = 0x2;
  if ((last_reboot_reason & watchdog_reset_mask) == watchdog_reset_mask) {
    __asm("bkpt 10");
  }
}
Sanity Checking the Configuration
The example app has a global variable defined in main.c, g_watchdog_hang_config, which we will be setting in gdb to control the type of hang which takes place. The startup code basically reduces to:
//main.c
int main(void) {
  prv_check_and_reset_reboot_reason();

  hardware_watchdog_enable();
  //...
  // enter different hang based on g_watchdog_hang_config
By default, the code will just enter while (1) {} loop on boot-up. So if everything is configured correctly after we flash we should see the debugger halt inside prv_check_and_reset_reboot_reason() after 10 seconds. Let’s try it out.
$ cd example/watchdog-example/
$ make
$ arm-none-eabi-gdb --eval-command="target remote localhost:2331"  --ex="mon reset" --ex="load" --ex="mon reset" --se=build/nrf52.elf
(gdb) continue
[ ... wait about 10 seconds ...]
Program received signal SIGTRAP, Trace/breakpoint trap.
prv_check_and_reset_reboot_reason () at interrupt/example/watchdog-example/main.c:157
157     __asm("bkpt 10");
(gdb)
Great, the watchdog works!
Now let’s try a while(1) {} loop that repeatedly calls hardware_watchdog_feed(). If the feed routine we wrote above works, the program should run indefinitely.
(gdb) mon reset
(gdb) break main
(gdb) continue
Continuing.

Breakpoint 1, main () at interrupt/example/watchdog-example/main.c:162
162   prv_check_and_reset_reboot_reason();
(gdb) set g_watchdog_hang_config=1
(gdb) continue
[... should observe no reboot ...]
We can also halt and check the run status just to make sure the watchdog is running and the peripheral is configured as expected:
(gdb) p/x *WDT
$3 = {
  TASKS_START = 0x0,
  RSVD = {0x0 <repeats 63 times>},
  EVENTS_TIMEOUT = 0x0,
  RSVD1 = {0x0 <repeats 128 times>},
  INTENSET = 0x0,
  INTENCLR = 0x0,
  RSVD2 = {0x0 <repeats 61 times>},
  RUNSTATUS = 0x1,
  REQSTATUS = 0x1,
  RSVD3 = {0x0 <repeats 63 times>},
  CRV = 0x50000,
  RREN = 0x1,
  CONFIG = 0x1,
  RSVD4 = {0x0 <repeats 60 times>},
  RR = {0x0, 0x0, 0x0, 0x0, 0x0, 0x0, 0x0, 0x0}
}
NOTE: Since the counter is paused while the system is halted resuming will not trigger a reset either.
A Basic Implementation
Let’s start with a very naive implementation and build up from there. We’ll create a low priority thread. If it’s able to run, we’ll feed the watchdog. If a task gets starved or something higher priority is stuck in a loop, the system should reboot.
static void prvWatchdogTask(void *pvParameters) {
  while (1) {
    vTaskDelay(1000);
    hardware_watchdog_feed();
  }
}
Hang while polling a Sensor
One common class of hangs results from polling a sensor while you wait for a transaction to complete. Here’s such an example:
// main.c
void erase_external_flash(void) {
  // some logic to start a flash erase
  // poll for completion
  while (!spi_flash_erase_complete()) { };
  // we never get here!
}
Implementation Note: Instead of polling in a loop indefinitely, we could have also added a timeout. However, for most simple devices a response is expected. Failure to see a response is often a software issue such as an interrupt or peripheral misconfiguration. Adding timeout logic and attempting to gracefully recover is something that should be done sparingly. When this is done, you open yourself to more complex recovery paths that may have problems of their own. Additionally, important state about the underlying issue is lost making root cause analysis even harder. Failing out exactly where the hang is taking place makes it easier to root cause and fix the actual problem.
Let’s see if our watchdog implementation can catch this type of hang!
(gdb) mon reset
Resetting target
(gdb) break main
Breakpoint 1 at 0x174: file interrupt/example/watchdog-example/main.c, line 151.
(gdb) continue
Continuing.

Breakpoint 1, main () at interrupt/example/watchdog-example/main.c:151
151   prv_check_and_reset_reboot_reason();

// Select the polling hang configuration
(gdb) set g_watchdog_hang_config=2
(gdb) continue
Continuing.

Breakpoint 1, main () at interrupt/example/watchdog-example/main.c:151
151   prv_check_and_reset_reboot_reason();
(gdb) c
Continuing.

[ ... wait about 10 seconds ... ]
Program received signal SIGTRAP, Trace/breakpoint trap.
prv_check_and_reset_reboot_reason () at interrupt/example/watchdog-example/main.c:146
146     __asm("bkpt 10");
Sweet, it did! We see we fell into the catch for watchdog resets upon reboot.
Hang waiting for a mutex
Let’s explore another class of hang due to a missing release of a mutex.
int read_temp_sensor(uint32_t *temp) {
  xSemaphoreTake(s_temp_i2c_mutex, portMAX_DELAY);
  int rv = i2c_read_temp(temp);
  if (rv == -1) {
    // BUG: Semaphore should have been released here!
    return rv;
  }
  xSemaphoreGive(s_temp_i2c_mutex);
  return 0;
}
(gdb) mon reset
Resetting target
(gdb) break main
Breakpoint 1 at 0x174: file interrupt/example/watchdog-example/main.c, line 151.
(gdb) continue
Continuing.

Breakpoint 1, main () at interrupt/example/watchdog-example/main.c:151
151   prv_check_and_reset_reboot_reason();

// Select the mutex hang configuration
(gdb) set g_watchdog_hang_config=3
(gdb) continue
Continuing.
// observe no reboot
Wait, what .. No reboot?!
This hang is a bit more subtle. The high priority thread is not executing any code because it is suspended waiting for a mutex. This means our low priority thread will be scheduled to run by the RTOS and can keep feeding the watchdog.
Adding a “Task” Watchdog
So we’ve just discovered our simple watchdog scheme has some shortcomings … it is not able to catch deadlocks between tasks. It seems like what we really want is a way to monitor that our event loops are making forward progress.
This can be achieved by wrapping our hardware watchdog implementation. Instead of unconditionally
calling hardware_watchdog_feed(), we will add an API tasks can register with and only feed the
hardware watchdog if all tasks have recently checked in.
C Code Example
static uint32_t s_registered_tasks = 0;
static uint32_t s_fed_tasks = 0;

static void prv_task_watchdog_check(void) {
  if ((s_fed_tasks & s_registered_tasks) == s_registered_tasks) {
    // all the tasks have been fed or are idle!
    hardware_watchdog_feed();
    s_fed_tasks = 0;
  }
}

void task_watchdog_register_task(uint32_t task_id) {
  __disable_irq();

  s_registered_tasks |= (1 << task_id);

  __enable_irq();
}

void task_watchdog_unregister_task(uint32_t task_id) {
  __disable_irq();

  s_registered_tasks &= ~(1 << task_id);
  s_fed_tasks &= ~(1 << task_id);
  prv_task_watchdog_check();

  __enable_irq();
}

void task_watchdog_feed_task(uint32_t task_id) {
  __disable_irq();

  s_fed_tasks |= (1 << task_id);
  prv_task_watchdog_check();

  __enable_irq();
}
NOTE: Since
s_fed_tasksands_registered_tasksare accessed by multiple tasks, I added “locking” around the updates to prevent corruption by disabling interrupts. Since the number of cycles for the update is really short, this should not be a problem. However, with GCC, one could have also made use of the builtin atomic APIs7.
Pseudocode for Usage of Task Watchdog
All embedded systems operate on an event loop of some sort. Here’s an example of how we could use the above API in a loop to get a better sense of how it works.
static void background_service_event_loop(void) {
  while (1) {
    const int task_id = kTaskId_BackGroundWorkLoop;
    // Since it could be a long time between events
    // unregister the task watchdog
    task_watchdog_unregister_task(task_id);
    wait_for_work();

    // we have work to do, so register a watchdog to catch
    // situations where the work takes an unreasonable amount of
    // time to complete
    task_watchdog_register_task(task_id);

    // OPTIONAL: If the task to perform takes a very long
    // time (i.e a flash chip erase), feed the task watchdog
    // to give us a little extra time.
    //
    // NOTE: The watchdog timeout you chose should
    // be sufficient for nearly every system event
    // so this pattern should be used _very_ sparingly
    task_watchdog_feed_task(task_id);

    [... perform work ...]
  }
}
Task Watchdog in Hardware
NOTE: The astute reader might note that this sounds like a use case for the multiple reload request registers on the NRF52 that we mentioned above. You aren’t wrong! It’s a pretty nifty hardware feature. However, not all watchdog peripherals have this feature and the cost of implementing it in code is very small (< 100 bytes). In this situation, I’d typically favor a software implementation that can be shared across a range of MCUs and easily unit tested.
Adding Task Watchdog To Example App
If you are following along with the code example, at this point you can pick up the task watchdog changes by doing the following:
$ cd $INTERRUPT_REPO/example/watchdog-example/
$ git apply 01-patch-task-watchdog.patch
$ make
Retry “Hang waiting for a mutex”
Let’s apply a patch that leverages the new task watchdog for the tasks in the example app and retry
(gdb) mon reset
(gdb) continue
Continuing.

Breakpoint 1, main () at interrupt/example/watchdog-example/main.c:162
162   prv_check_and_reset_reboot_reason();
(gdb)  set g_watchdog_hang_config=3
(gdb) continue
Continuing.

Breakpoint 1, main () at interrupt/example/watchdog-example/main.c:160
160   prv_check_and_reset_reboot_reason();
(gdb) continue

Program received signal SIGTRAP, Trace/breakpoint trap.
prv_check_and_reset_reboot_reason () at interrupt/example/watchdog-example/main.c:157
157     __asm("bkpt 10");
Awesome, it worked!
Root Causing Watchdogs
It’s great that we can now catch system hangs but how do we debug them? At the moment all we see is one bit on reset after the watchdog has taken place which is not particularly helpful for root causing the original issue.
What we really want is to be able to do is execute code prior to a watchdog reset occurring. As we explored above, the NRF52 does have an interrupt we can enable but it gives us no control over deferring the reboot to do any cleanup. In this situation it’s usually pretty easy to re-purpose a built-in peripheral timer to accomplish this.
Adding a “Software” Watchdog
For the purposes of this example we will use the NRF52 Timer0 Peripheral to implement our software watchdog. We’ll want the timeout to be a little less than the hardware watchdog timeout so for this example lets use a timeout of 7 seconds. To “feed” this watchdog, we will just restart the timer. If 7 seconds elapses without a feed, the ISR will fire and we know the system is about to watchdog.
We can then treat this interrupt as another “fault handler” and apply the lessons learned from our post about debugging Cortex-M faults to this situation as well!
Software Watchdog Example C Code
void TimerTask0_Handler(void) {
  __asm volatile(
      "tst lr, #4 \n"
      "ite eq \n"
      "mrseq r0, msp \n"
      "mrsne r0, psp \n"
      "b watchdog_fault_handler_c \n");
}

// Disable optimizations for this function so "frame" argument
// does not get optimized away
__attribute__((optimize("O0")))
void watchdog_fault_handler_c(sContextStateFrame *frame) {
  // If and only if a debugger is attached, execute a breakpoint
  // instruction so we can take a look at what triggered the fault
  HALT_IF_DEBUGGING();

  // We are about to watchdog so do one last feed
  // to give us time to cleanup & then explicitly reboot
  hardware_watchdog_feed();

  // Logic for dealing with the exception. Typically:
  //  - Save a coredump for postmortem analysis so you
  //    can root cause deadlocks or hangs
  //  - perform any shutdown/cleanup needed before reboot
  //  - reboot the system
}
Adding Software Watchdog To Example App
If you are following along with the code example, at this point you can pick up the task watchdog changes by doing the following:
$ cd $INTERRUPT_REPO/example/watchdog-example/
$ git apply 02-patch-software-watchdog.patch
$ make
Debugging our example hangs
Let’s walk back through some of the examples we explored early in the article and see if we can root cause what led to the hang!
Hang while polling a Sensor
(gdb) mon reset
Resetting target

(gdb) break main
Breakpoint 1, main () at interrupt/example/watchdog-example/main.c:162
162   prv_check_and_reset_reboot_reason();

(gdb) set g_watchdog_hang_config=2
(gdb) continue
Continuing.

[... wait about seven seconds ...]

Program received signal SIGTRAP, Trace/breakpoint trap.
0x00002bbc in watchdog_fault_handler_c (frame=0x200003b8 <ucHeap+592>) at interrupt/example/watchdog-example/software_watchdog.c:81
81    HALT_IF_DEBUGGING();

(gdb) p/a *frame
$3 = {
  r0 = 0x0 <g_pfnVectors>,
  r1 = 0x200001bc <ucHeap+84>,
  r2 = 0x20000164 <s_registered_tasks>,
  r3 = 0x2 <g_pfnVectors+2>,
  r12 = 0x200003e0 <ucHeap+632>,
  lr = 0x10b <erase_external_flash+6>,
  return_address = 0x2b8 <spi_flash_erase_complete>,
  xpsr = 0x61000000
}
Great we see the pc & lr point exactly to the loop we were spinning on:
void erase_external_flash(void) {
  // some logic to start a flash erase
  // poll for completion
  while (!spi_flash_erase_complete()) { };
}
Hang while waiting for a Mutex
Now let’s try debugging the hang that resulted from a deadlock.
(gdb) mon reset
Resetting target
(gdb) break main
Breakpoint 1, main () at interrupt/example/watchdog-example/main.c:162
162   prv_check_and_reset_reboot_reason();
(gdb) set g_watchdog_hang_config=3
(gdb) continue
Continuing.
[... wait about seven seconds ...]
Program received signal SIGTRAP, Trace/breakpoint trap.
0x00002bbc in watchdog_fault_handler_c (frame=0x20000b10 <ucHeap+2472>) at interrupt/example/watchdog-example/software_watchdog.c:81
81    HALT_IF_DEBUGGING();
(gdb) p/a *frame
$4 = {
  r0 = 0x0 <g_pfnVectors>,
  r1 = 0x0 <g_pfnVectors>,
  r2 = 0x0 <g_pfnVectors>,
  r3 = 0x0 <g_pfnVectors>,
  r12 = 0x0 <g_pfnVectors>,
  lr = 0x2741 <prvTaskExitError>,
  return_address = 0x39a <prvIdleTask+14>,
  xpsr = 0x61000000
}
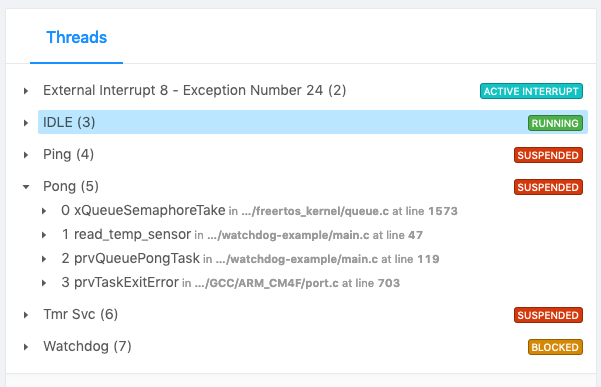
This one is a bit more involved. The $pc and $lr are in the FreeRTOS Idle task. Recall the thread which is wedged is blocked so other code is able to execute. We can compare s_registered_tasks & s_fed_tasks to find out what task id is stuck:
(gdb) p/x s_registered_tasks&~s_fed_tasks
$8 = 0x2
So it’s task id 1 that is stuck. From our Task Id list we know this is the Pong task:
typedef enum {
  kWatchdogExampleTaskId_Ping = 0,
  kWatchdogExampleTaskId_Pong,
  kWatchdogExampleTaskId_Watchdog,
} eWatchdogExampleTaskId;
If your debugger is FreeRTOS thread aware, you can switch to this thread to view the backtrace. Alternatively you can use a tool like Memfault (Disclosure: the author is founder & CTO at Memfault) to extract the data and run the analysis in the cloud. Let’s try that out.
(gdb) memfault coredump -r 0x20000000 262144
One moment please, capturing memory...

[...]
Are you currently at the start of an exception handler [y/n]?n
[...]
Cortex-M4 detected
Collected MPU config
Capturing RAM @ 0x20000000 (1048576 bytes)...
Captured RAM @ 0x20000000 (1048576 bytes)
Symbols have already been uploaded, skipping!
Coredump uploaded successfully!
Then from the Memfault Issue Detail UI we can easily view the Pong task and see it’s blocked waiting on a call to xQueueSemaphoreTake.
Using GDB Python to prevent Software Watchdog Misfires
Unfortunately, unlike the watchdog timer, there does not appear to be a way to halt the clock driving the timer peripheral while a debugger is attached on the NRF52. This means that if we halt using a debugger for more than 7 seconds, we will hit the software watchdog ISR immediately upon resumption. Let’s confirm that’s the case:
(gdb) CTRL-C
[... wait 7 seconds ...]
(gdb) continue
Continuing.

Program received signal SIGTRAP, Trace/breakpoint trap.
0x00002bbc in watchdog_fault_handler_c (frame=0x20002a78) at interrupt/example/watchdog-example/software_watchdog.c:81
81    HALT_IF_DEBUGGING();
This is a situation where we can leverage GDB’s Python API! (For a deeper dive into the GDB Python API check out this post).
Specifically, we can make use of the Events API8, to pause the peripheral timer when the system halts and resume it when the system continues.
Example Code to Pause Software Watchdog While Debugging
# gdb_resume_handlers.py
try:
    import gdb
except ImportError:
    raise Exception("This script can only be run within gdb!")

import struct


class Nrf52Timer0:
    TIMER0_TASKS_START_ADDR = 0x40008000
    TIMER0_TASKS_STOP_ADDR = 0x40008004

    @staticmethod
    def _trigger_task(addr):
        gdb.selected_inferior().write_memory(addr, struct.pack("<I", 1))

    @classmethod
    def start(cls):
        print("Resuming Software Watchdog")
        cls._trigger_task(cls.TIMER0_TASKS_START_ADDR)

    @classmethod
    def stop(cls):
        print("Pausing Software Watchdog")
        cls._trigger_task(cls.TIMER0_TASKS_STOP_ADDR)


def nrf52_debug_stop_handler(event):
    Nrf52Timer0.stop()


def nrf52_debug_start_handler(event):
    Nrf52Timer0.start()


gdb.events.stop.connect(nrf52_debug_stop_handler)
gdb.events.cont.connect(nrf52_debug_start_handler)
Now when we invoke GDB we can add the argument --ex="source gdb_resume_handlers.py" and the timer will be automatically paused by GDB for us while the debugger is halted.
$ arm-none-eabi-gdb-py --eval-command="target remote localhost:2331"  \
    --ex="mon reset" --ex="load" --ex="mon reset"                     \
    --ex="source gdb_resume_handlers.py" --se=build/nrf52.elf
Program received signal SIGTRAP, Trace/breakpoint trap.
main () at interrupt/example/watchdog-example/main.c:134
134   }
Pausing Software Watchdog
(gdb) c
Continuing.
Resuming Software Watchdog
Debugging Hangs Inside Interrupts
Let’s see how the system fairs if a hang occurs within an ISR:
(gdb) set g_watchdog_hang_config=4
(gdb) c
Continuing.
Resuming Software Watchdog
(gdb) p/a *frame
$2 = {
  r0 = 0x3 <g_pfnVectors+3>,
  r1 = 0x200001bc <ucHeap+84>,
  r2 = 0xe000e100,
  r3 = 0x1 <g_pfnVectors+1>,
  r12 = 0x200003e0 <ucHeap+632>,
  lr = 0xfffffffd,
  return_address = 0xd0 <ExternalInt0_Handler>,
  xpsr = 0x21000010
}
The return address points to an interrupt handler, ExternalInt0_Handler. Inspecting the code it does indeed hang:
void ExternalInt0_Handler(void) {
  while (1) {}
}
ARM Cortex-M Design Suggestions
Over the years, I’ve developed a set of best practices for implementing watchdogs on cortex-M MCUs:
- Make sure the software watchdog handler runs at the highest possible configurable priority and that all other interrupts run at a priority less than that. This way even if the hang is within an ISR, the software handler will be able to run and you will be able to trace what went wrong.
- If the architecture supports configuring the BASEPRI (any Cortex-M except Cortex-M0’s), use
__set_BASEPRIfor entering and exiting critical sections instead of__disable/__enable_irq(). In this manner you can ensure the “Software Watchdog” interrupt handler is always enabled and even catch hangs which occur from within a critical section!
NOTE: For more info about ARM exceptions in general, check out our post here
Closing
I hope this post gave you a useful overview of how to think about utilizing watchdogs in an embedded system!
Do you have suggestions about how to use watchdogs that I didn’t mention in this post or have any other questions on the topic? Let us know in the discussion area below!
See anything you'd like to change? Submit a pull request or open an issue on our GitHub
References
 Chris Coleman is a founder and CTO at Memfault. Prior to founding Memfault, Chris worked on the embedded software teams at Sun, Pebble, and Fitbit.