Measuring Stack Usage the Hard Way
Embedded systems often require a careful eye to where memory resources are being spent, especially runtime memory utilization like stack and heap memories.
This article is intended to shed some light on strategies for measuring stack memory usage on a small embedded system.
Table of Contents
How stacks work
Before we dive into the measurement techniques, let’s take a quick look at how stacks usually behave on these types of small embedded chips (skip to “Measuring stack usage” if this is old news). For this article, we’ll be assuming an ARM Cortex-M embedded device with “full descending” stacks, but similar techniques will apply to other systems.
Stack grows down, heap grows up
In a “full descending” stack, objects are “allocated” into stack memory in decreasing memory order.
If our code is allocating a 32-bit value on stack:
int foo(int a) {
  uint32_t var;  // the compiler may choose to allocate this on stack
  ...
}
First the “stack pointer” is decremented by 32 bits (4 bytes), then the address
for var is set to the new stack pointer address. Loads and stores of the var
variable will then access the stack-allocated 32-bit region.
In a typical single-threaded embedded program that uses both stack and heap
(malloc and friends), the memory ordering might look like this:

You can find some more explanation here:
https://courses.engr.illinois.edu/cs225/fa2022/resources/stack-heap/
Side note, there’s an interesting strategy for single-threaded programs that involves a two-pass linking step, and results in this memory layout:
Read more about that here:

RTOS stacks

Things get a little more complicated when there’s an RTOS involved: each thread (in a pre-emptive RTOS) usually has its own dedicated stack. See this link for a great description:
When a thread is running, stack allocations occur just as in a single-threaded system, only the stack is set up (by the RTOS kernel) specifically for the thread.
Alright, let’s jump into the stack usage measurement techniques!
Measuring stack usage
Static analysis with -fstack-usage
Gcc and clang will emit stack usage per function via the -fstack-usage
argument. It looks like this in practice:
// stack-usage-example.c
#include <stdio.h>

int foo_2(int c) {
  int array[4];
  array[1] = c;
  array[3] = c* c;
  return array[3] - array[1];
}

int foo(int a, int b) {
  int array[10];
  array[1] = a;
  array[9] = foo_2(b);

  return array[1] * array[9];
}

int main() {
  printf("%d\n", foo(1,2));
}
Compiling with -fstack-usage:
$ gcc -c -fstack-usage stack-usage-example.c
$ cat stack-usage-example.su
example/stack-usage/stack-usage-example.c:3:5:foo_2     64      static
example/stack-usage/stack-usage-example.c:10:5:foo      80      static
example/stack-usage/stack-usage-example.c:18:5:main     16      static
You can see above that the stack-usage-example.su file contains a list of
functions and the stack usage in each.
This is pretty handy when looking at a single function, but is difficult to use
when trying to analyze nested function calls. In the above example, the full
stack usage in foo() is foo() + foo_2(), or 80 + 64 = 144 bytes, but it’s
not obvious from the .su data.
There are some tools to help fill in this gap, which I’ll link below for reference, but they can require a bit of fiddling to get working correctly.
- A Python script for statically computing worst-case stack usage from
.sufiles: https://github.com/PeterMcKinnis/WorstCaseStack - Referencing the
-fdump-rtl-expandflag, which permits static analysis of the nested calls, and an example script: https://stackoverflow.com/a/67398286 - Nice article from the MCU On Eclipse blog: https://mcuoneclipse.com/2015/08/21/gnu-static-stack-usage-analysis/ and the referenced script here https://dlbeer.co.nz/oss/avstack.html
- This one worked after a few tiny tweaks and generated a very useful output: https://github.com/ttsiodras/checkStackUsage (tweaks here)
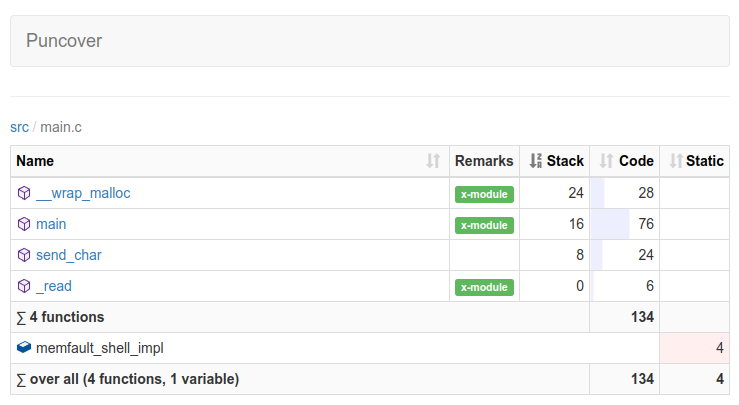
Honorable mention to the puncover
tool (disclaimer, I help maintain the tool), which can help visualize the data
in the .su files for a whole program:
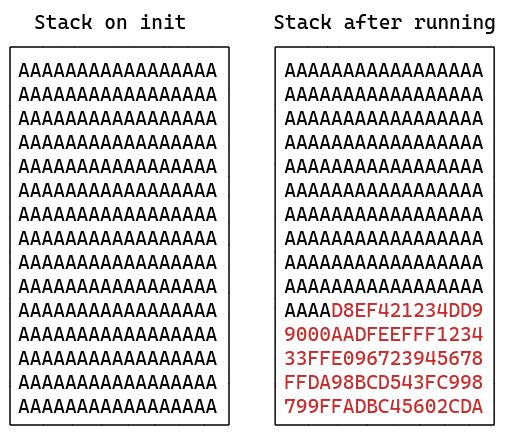
Runtime analysis with stack painting
This strategy is very common in embedded systems, and is used by both FreeRTOS and Zephyr RTOS.
The idea is to “paint” the stack with a known value, and then to measure stack usage by examining the highest location in the stack not set to the known value (aka “high watermark”).
Both FreeRTOS and Zephyr RTOS apply this technique for measuring stack usage at runtime:
- FreeRTOS: https://www.freertos.org/uxTaskGetStackHighWaterMark.html
- Zephyr RTOS: https://docs.zephyrproject.org/latest/kconfig.html#CONFIG_INIT_STACKS
Here’s a short example of how this works in practice:
#include <stdint.h>

#define STACK_FILL_VALUE 0xaa

// Helper function to initialize a stack with the fill pattern
void stack_initialize_fill_value(uintptr_t stack_top, size_t stack_size) {
  memset((void *)stack_top, STACK_FILL_VALUE, stack_size);
}

// Function to return the maximum stack usage
uintptr_t stack_high_watermark(uintptr_t stack_top, size_t stack_size) {
  uint8_t *stack = (uint8_t *)stack_top;
  uint8_t *stack_end = (uint8_t *)(stack_top + stack_size);


  // To compute the stack usage, iterate over the stack memory and find the
  // highest location that doesn't match the fill value
  while (stack < stack_end && *stack == STACK_FILL_VALUE) {
    stack++;
  }

  return (uintptr_t)stack;
}
Use this strategy after the system executes core functionality to collect a reasonably accurate measurement of the maximum stack usage. usage.
Note: since this approach relies on values being written to the stack, if a buffer is allocated on the stack but only partially used, the full buffer size will not be counted as used. Any memory still containing the fill pattern will be counted as unused
Another application of this technique is to use it to measure stack consumption of a particular function call, with the following procedure:
- Just before the function call, re-apply the stack fill pattern across the unused portion of the stack
- Save the current stack pointer value, and call the function of interest
- Measure the stack high watermark, and compute the difference between the saved stack pointer value and the high watermark. This is the stack usage of the function
Runtime analysis with GDB single-stepping
This is a technique I applied recently to measure stack usage without modifying the target device code.
The idea is to use GDB to single-step through the program, and to dump the stack
pointer register, $sp, at every step. I used a small GDB Python script to do
this work, a small snippet is shown below:
# save the starting stack pointer value
sp_start = int(gdb.parse_and_eval("$sp"))
print("Starting SP: 0x{:08x}".format(sp_start))

# record the lowest (memory index) value- this is the max stack usage for the
# function. initialize it to the maximum addressable address.
sp_min = 0xFFFFFFFF
while True:
    # single instruction step, so we capture _any_ sp change
    gdb.execute("si")
    sp = int(gdb.parse_and_eval("$sp"))
    if sp < sp_min:
        sp_min = sp
    # exit this loop when a breakpoint is hit
    if hit_breakpoint():
      break
print("Min SP: 0x{:08x}".format(sp_min))
print("Delta SP: {}".format(sp_start - sp_min))
The script is very slow to run since it interrupts program flow at every instruction, but it gives a very accurate result.
It can be enhanced to produce more data, for example recording the max usage for each frame in a call stack:
# write the verbose data to a file
with open("stack_usage.log", "w") as f:
    sp_min = 0xFFFFFFFF
    current_function = None
    current_function_max_su = 0
    while True:
        gdb.execute("si")
        sp = int(gdb.parse_and_eval("$sp"))
        su = sp_start - sp
        name = gdb.selected_frame().name()
        # if we just changed function name, record the high water mark
        # from the last function
        if current_function is not None and name != current_function:
            f.write(f"{current_function}|{current_function_max_su}\n")
            current_function_max_su = 0
        current_function = name
        if su > current_function_max_su:
            current_function_max_su = su
        if sp < sp_min:
            sp_min = sp
        # check if we've reached a breakpoint
        if hit_breakpoint():
            break
    f.write(f"{current_function}|{current_function_max_su}\n")
Plotting that usage can be interesting:
# using the excellent gnuplot to plot a visualization of the stack usage
❯ cut -d \| -f 2 stack_usage.log | \
     | gnuplot -e "set title 'Stack Usage'; plot '-' with lines" -persist

Flame graphs and other visualizations could also be built off the data generated from this GDB script!
The full script can be found here: single-step-sp-dump.py
And the extended version and instructions for testing it on QEMU can be found here.
See anything you'd like to change? Submit a pull request or open an issue on our GitHub
References
- Overview of stack and heap: https://courses.engr.illinois.edu/cs225/fa2022/resources/stack-heap/
- Tutorial on FreeRTOS memory usage: https://www.digikey.com/en/maker/projects/introduction-to-rtos-solution-to-part-4-memory-management/6d4dfcaa1ff84f57a2098da8e6401d9c
- Nice strategy for stack overflow protection via a 2-pass link, without using an MPU: https://blog.japaric.io/stack-overflow-protection/
- Static stack analysis for rust programs: https://blog.japaric.io/stack-analysis/
- Useful compiler flags around stack usage: https://embeddedartistry.com/blog/2020/08/17/three-gcc-flags-for-analyzing-memory-usage/
- Very cool tracing system (requires some tinkering to use on an unhosted target though): https://justine.lol/ftrace/
- FreeRTOS stack overview: https://moji1.github.io/EEE499/assets/docs/freertos1.pdf
 Noah Pendleton is an embedded software engineer at Memfault. Noah previously worked on embedded software teams at Fitbit and Markforged.