Step-through debugging with no debugger on Cortex-M
Debugging an MCU requires attaching a debugger via JTAG and halting the core. Or does it?
There are many situations where this debug strategy is not feasible such as on
- production units where JTAG has been disabled.
- systems where halting the core causes the subsystem you are trying to debug to fault. (i.e Asserts from the NRF52 SoftDevice after halting at a breakpoint1)
- remote systems where only a UART or network interface is exposed.
Fortunately, ARM Cortex-M’s have us covered!
This week we explore how to debug running systems with ARM Cortex-M’s DebugMonitor exception handler. We cover how to configure the MCU to operate in this mode and walk through an example of installing breakpoints and single-stepping on a running device!
In my opinion, DebugMonitor handling is an underutilized feature that can be applied creatively for a variety of debug use cases. I hope by the end of this article I can convince you of this as well!
Table of Contents
Basic Terminology
ARM Cortex-M’s support several “levels” of debug:
- Halting debug - This is the typical configuration you use with a debugger like GDB. In this mode, the core is halted while debugging. This mode requires access to the Debug Port via JTAG or SWD. We’ve walked through an overview of how ARM debug interfaces work in this article.
- Tracing via the ITM, DWT & ETM - These peripherals let you stream instruction execution and data accesses while the system is running. Tools such as Lauterbach’s Trace322 and SEGGER’s JTrace3 can decode these streams and present results in a GUI on your desktop.
- Debug monitor mode - Enables debug on running systems via the DebugMonitor exception handler. This can be helpful in scenarios where halting the core will cause timing sensitive subsystems to fail or for use cases where connecting a debugger is not feasible.
It’s worth noting that debug monitor support is not available for the ARMv6-M architecture (Cortex-M0). However, it is implemented for all other Cortex-M architectures.
Example Project Setup
In the following sections, we will explore how to set up Debug monitor mode with a very simple bare-metal application running on a nRF52 using the following tooling:
- a nRF52840-DK4 (ARM Cortex-M4F) as our development board
- SEGGER JLinkGDBServer5 as our GDBServer (V6.80b)
- GCC 9.3.1 / GNU Arm Embedded Toolchain as our compiler6
- GNU Make as our build system
- the simple CLI shell we built up in a previous post.
- PySerial’s
miniterm.py7 to connect to the serial console on the nRF52.
In this article, we will extend upon the example app we built to explore how breakpoints work.
Enabling the DebugMonitor Exception
Debug monitor mode based debugging works by triggering an exception known as the “DebugMonitor Exception” when debug events take place. We’ll explore how to configure the handler in the following sections.
Debug Halting Control and Status Register (DHCSR), 0xE000EDF0
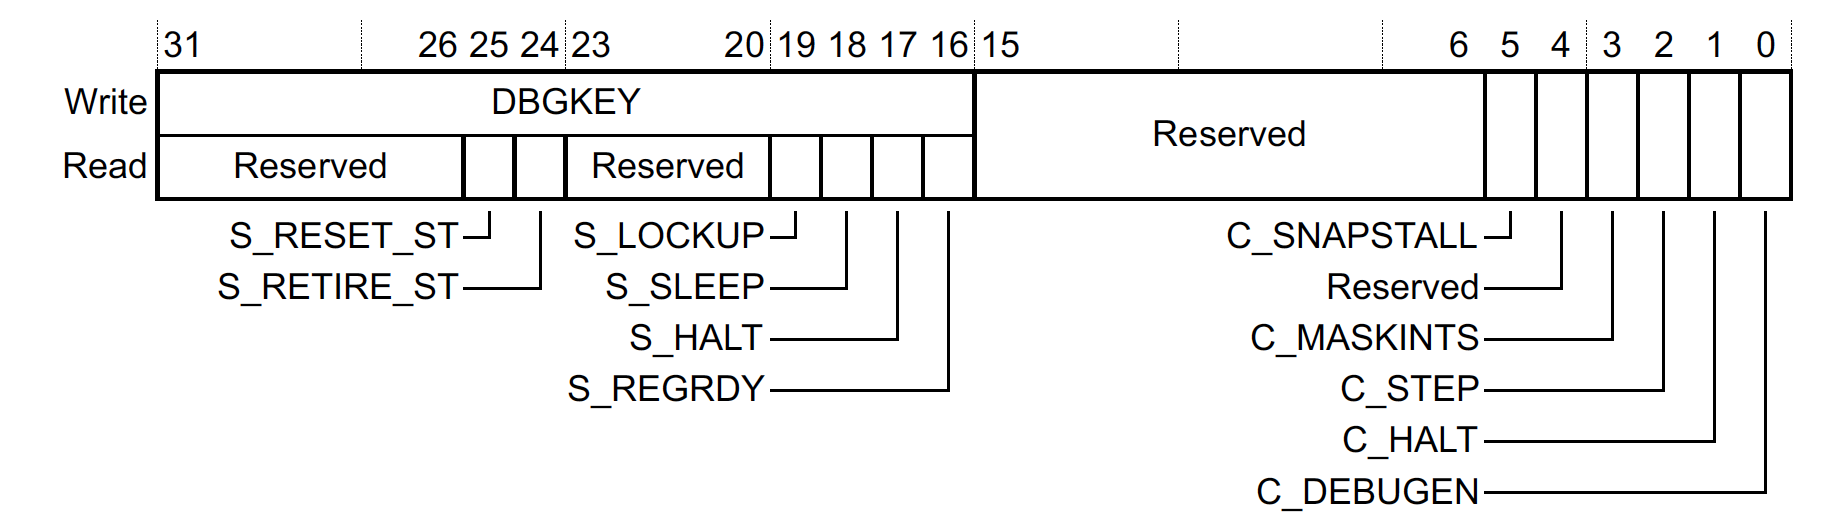
Monitor Mode Debug only works if halting debug is disabled. Notably, the C_DEBUGEN setting
above must be cleared. This bit can only be set via the JTAG/SWD connection and is only reset when a full
Power-On-Reset (POR) occurs or a debugger clears the bit on exit.
If you are trying to use Monitor Mode Debug, I recommend adding a check on boot for this. Otherwise, you are bound to confuse yourself when you are trying to test the feature and have a debugger connected via JTAG/SWD:
bool debug_monitor_enable(void) {
  volatile uint32_t *dhcsr = (uint32_t*)0xE000EDF0;
  if ((*dhcsr & 0x1) != 0) {
    EXAMPLE_LOG("Halting Debug Enabled - "
                "Can't Enable Monitor Mode Debug!");
    return;
  }
  // code to set up debug monitor mode
}
TIP: Disabling Halting Debug from GDB
If you are using GDB, Halting Mode debug can be disabled manually by clearing C_DEBUGEN and setting
the appropriate value for DBGKEY (0xA05F):
(gdb) set *(uint32_t*)0xE000EDF0=(0xA05F<<16)
This can also be a useful way to keep an active GDB session open and probe its state while the system is running!
Debug Exception and Monitor Control Register (DEMCR), 0xE000EDFC
The core configuration for the DebugMonitor exception is controlled in the upper 16 bits of the
DEMCR register:
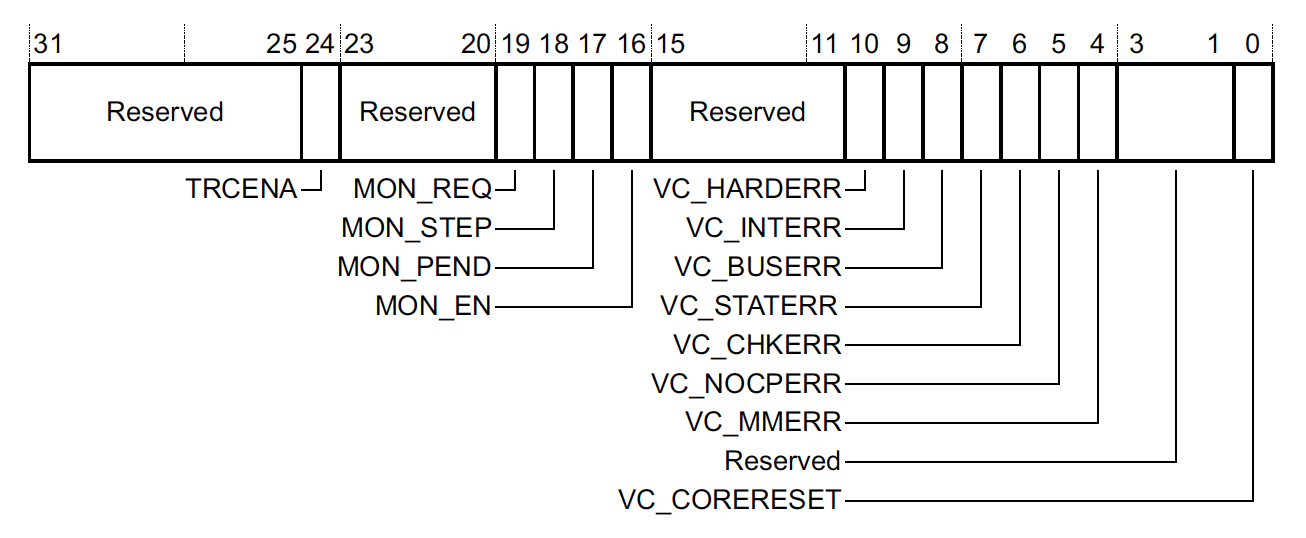
where:
-
MON_EN- Controls whether the DebugMonitor exception is enabled or not. When enabled, debug “events” will cause the exception to fire. -
MON_PEND- Can be used to trigger a DebugMonitor exception irrespective of whether or notMON_ENis set to 1. -
MON_REQ- Not used by the MCU. Software can use this bit to convey state about monitor mode. -
MON_STEP- Can be toggled from the DebugMonitor exception to enable hardware single-stepping. When set, upon return from the exception handler, the core will execute a single instruction and then return to the DebugMonitor exception.
NOTE: The lower bits (
VC_HARDERR, etc) controls whether or not a debug trap occurs automatically when various types of exceptions take place. These only take effect when using halting debug mode. They allow you to guarantee the system is halted any time an exception path is hit which can be useful when trying to debug!
DebugMonitor Exception Configuration Nuances
The DebugMonitor exception will only be triggered for debug events when the group priority of the exception is greater than the current execution priority.
This can be a useful feature to guarantee that certain high priority operations (i.e Bluetooth radio scheduling) continue to run while you step through the code in other parts of the system.
An important consequence however is it does mean any interrupts running above this priority of the DebugMonitor exception will not be debuggable when using debug monitor support.
Configuring the DebugMonitor exception priority will require updating SHPR3. More details can be
found in our post about ARM Cortex-M exception handling.
C Code to Enable the DebugMonitor Exception
For simplicity in our example app we will set the DebugMonitor exception to the lowest configurable interrupt priority. This means all other interrupts will be able to run while debugging code not running from an interrupt.
Putting it all together, we have:
bool debug_monitor_enable(void) {
  volatile uint32_t *dhcsr = (uint32_t*)0xE000EDF0;
  if ((*dhcsr & 0x1) != 0) {
    EXAMPLE_LOG("Halting Debug Enabled - "
                "Can't Enable Monitor Mode Debug!");
    return false;
  }

  volatile uint32_t *demcr = (uint32_t*)0xE000EDFC;
  const uint32_t mon_en_bit = 16;
  *demcr |= 1 << mon_en_bit;

  // Priority for DebugMonitor Exception is bits[7:0].
  // We will use the lowest priority so other ISRs can
  // fire while in the DebugMonitor Interrupt
  volatile uint32_t *shpr3 = (uint32_t *)0xE000ED20;
  *shpr3 = 0xff;

  EXAMPLE_LOG("Monitor Mode Debug Enabled!");
  return true;
}
A minimal DebugMonitor Handler
We can use the same handler we put together in our post about fault handling to dump register state about the code which caused the DebugMonitor exception to be invoked:
typedef struct __attribute__((packed)) ContextStateFrame {
  uint32_t r0;
  uint32_t r1;
  uint32_t r2;
  uint32_t r3;
  uint32_t r12;
  uint32_t lr;
  uint32_t return_address;
  uint32_t xpsr;
} sContextStateFrame;


void debug_monitor_handler_c(sContextStateFrame *frame) {
  // DebugMonitor Exception Logic
  // ...
}

__attribute__((naked))
void DebugMon_Handler(void) {
  __asm volatile(
      "tst lr, #4 \n"
      "ite eq \n"
      "mrseq r0, msp \n"
      "mrsne r0, psp \n"
      "b debug_monitor_handler_c \n");
}
Debug Fault Status Register, DFSR, 0xE000ED30
When the DebugMonitor Exception fires, the DFSR can be inspected for information about what debug event took place:
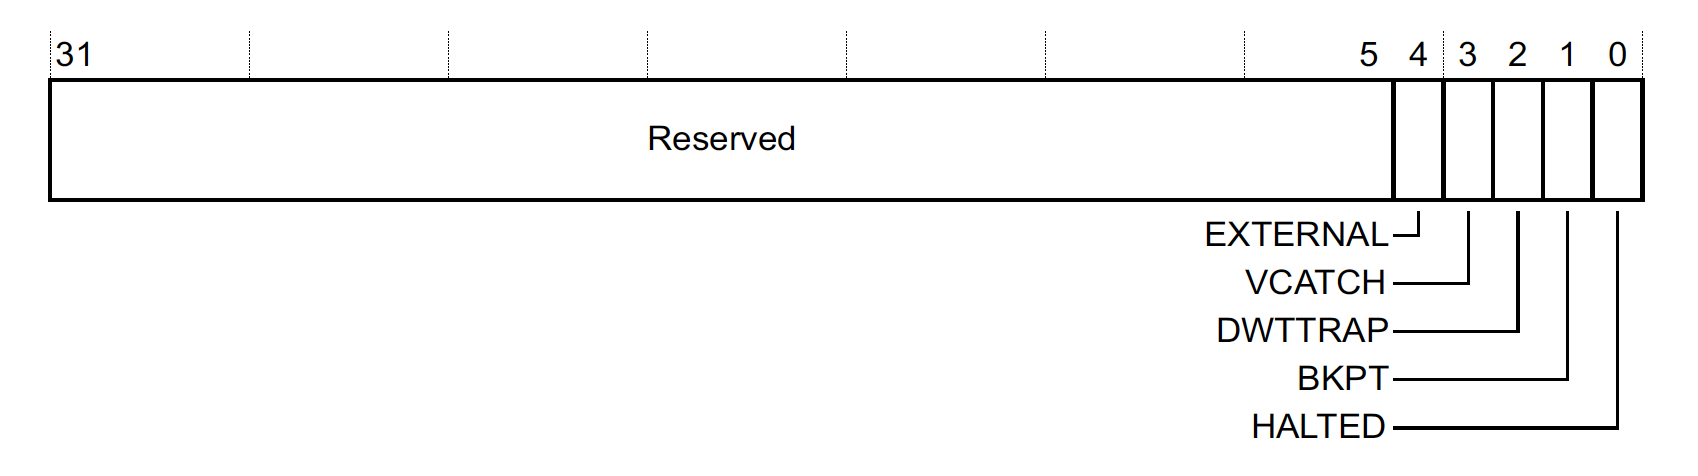
Some of the events are only possible when using a halting debug. For the DebugMonitor the states of interest are:
-
DWTTRAPIndicates the a debug event was generated due to a configuration in the DWT. -
BKPTIndicates one or more breakpoint event took place (either via the FPB or a BKPT instruction). -
HALTEDIndicates the core was halted due to a MON_STEP request.
NOTE: DFSR bits are sticky and you have to write 1 to the value to clear them
Example C Code For DebugMon_Handler
Let’s extend debug_monitor_handler_c to dump some of the state we are collecting:
void debug_monitor_handler_c(sContextStateFrame *frame) {
  volatile uint32_t *demcr = (uint32_t *)0xE000EDFC;

  volatile uint32_t *dfsr = (uint32_t *)0xE000ED30;
  const uint32_t dfsr_dwt_evt_bitmask = (1 << 2);
  const uint32_t dfsr_bkpt_evt_bitmask = (1 << 1);
  const uint32_t dfsr_halt_evt_bitmask = (1 << 0);
  const bool is_dwt_dbg_evt = (*dfsr & dfsr_dwt_evt_bitmask);
  const bool is_bkpt_dbg_evt = (*dfsr & dfsr_bkpt_evt_bitmask);
  const bool is_halt_dbg_evt = (*dfsr & dfsr_halt_evt_bitmask);

  EXAMPLE_LOG("DebugMonitor Exception");

  EXAMPLE_LOG("DEMCR: 0x%08x", *demcr);
  EXAMPLE_LOG("DFSR:  0x%08x (bkpt=%d, halt=%d, dwt=%d)", *dfsr,
              (int)is_bkpt_dbg_evt, (int)is_halt_dbg_evt,
              (int)is_dwt_dbg_evt);

  EXAMPLE_LOG("Register Dump");
  EXAMPLE_LOG(" r0  =0x%08x", frame->r0);
  EXAMPLE_LOG(" r1  =0x%08x", frame->r1);
  EXAMPLE_LOG(" r2  =0x%08x", frame->r2);
  EXAMPLE_LOG(" r3  =0x%08x", frame->r3);
  EXAMPLE_LOG(" r12 =0x%08x", frame->r12);
  EXAMPLE_LOG(" lr  =0x%08x", frame->lr);
  EXAMPLE_LOG(" pc  =0x%08x", frame->return_address);
  EXAMPLE_LOG(" xpsr=0x%08x", frame->xpsr);

  // ...
}
Triggering a breakpoint
To test things out we can create a super simple CLI command that issues a breakpoint instruction:
static int prv_issue_breakpoint(int argc, char *argv[]) {
  __asm("bkpt 1");
  return 0;
}
In one terminal you will need to start a gdbserver:
$ JLinkGDBServer -if swd -device nRF52840_xxAA -nogui
Then you need to compile the example application and flash it
$ cd ${INTERRUPT_REPO}/example/debugmon/
$ make
Compiling src/debug_monitor_exception.c
[...]
Linking library
Generated build/nrf52.elf
$ arm-none-eabi-gdb-py --eval-command="target remote localhost:2331"  --ex="mon reset" --ex="load"
--ex="mon reset"  --se=build/nrf52.elf
(gdb)
From GDB. we will disable halting debug so the program will continue running:
(gdb) set *(uint32_t*)0xE000EDF0=(0xA05F<<16)
In a final terminal we will open a serial connection using miniterm:
$ miniterm.py - 115200 --raw
--- Available ports:
...
---  4: /dev/cu.usbmodem0006838593731 'J-Link'
--- Enter port index or full name: 4
--- Miniterm on /dev/cu.usbmodem0006838593731  115200,8,N,1 ---
--- Quit: Ctrl+] | Menu: Ctrl+T | Help: Ctrl+T followed by Ctrl+H ---
shell> debug_mon_en
Monitor Mode Debug Enabled!
shell> bkpt
DebugMonitor Exception
DEMCR: 0x01010000
DFSR:  0x00000002 (bkpt=1, halt=0, dwt=0)
Register Dump
 r0  =0x00000001
 r1  =0x20003310
 r2  =0x73734900
 r3  =0x000009d5
 r12 =0xffffffff
 lr  =0x0000094b
 pc  =0x000009d4
 xpsr=0x210e0000
 ...
As expected we see bit 1 in DFSR is set indicating a breakpoint debug event was generated.
We can use GDB to inspect the instruction located at0x000009d4 and confirm it is indeed a breakpoint
instruction:
(gdb) x/i 0x000009d4
  0x9d4 <prv_issue_breakpoint>:	bkpt	0x0001
We can also dump the instruction and confirm it matches the BKPT instruction encoding (0xbe..):
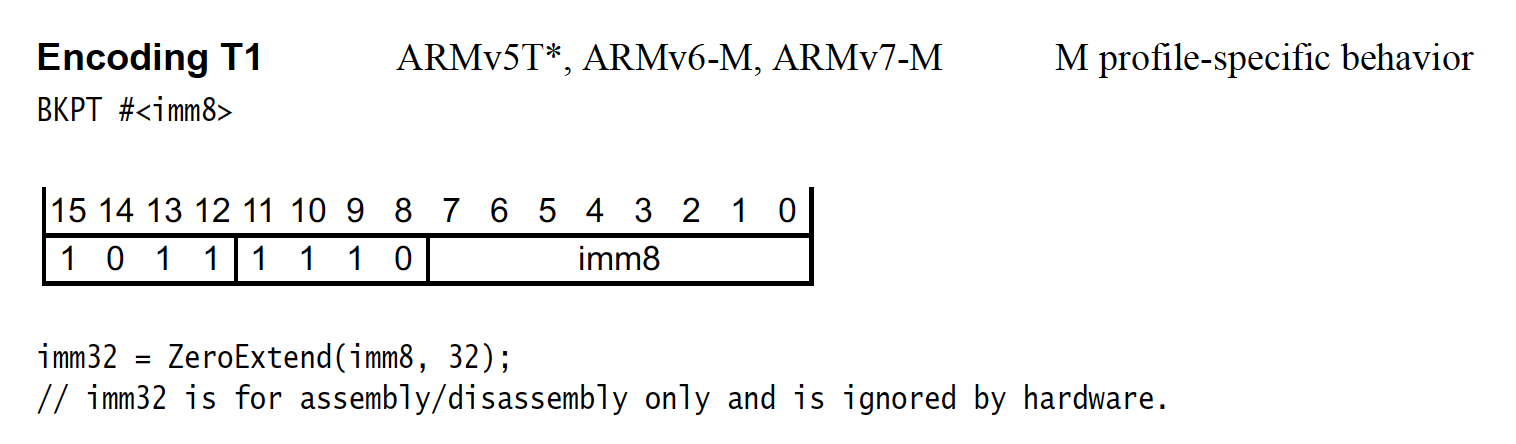
(gdb) p/x *(uint16_t*)0x000009d4
$4 = 0xbe01
Programmatically installing Breakpoints with the FPB
In the FPB we can program one of theFP_COMP register to hold the address we would like to break
on.
The layout of the FP_COMP register is a little odd but basically for a given instr_addr, FP_COMP[31:30] map
instr_addr[1:0], FP_COMP[28:2] map to instr_addr[28:2], and the lowest bit FP_COMP[0] controls
whether the breakpoint is enabled or not.
For the NRF52, we can transcribe the logic into code as follows:
bool fpb_set_breakpoint(size_t comp_id, uint32_t instr_addr) {
  if (instr_addr >= 0x20000000) {
    // for revision 1 only breakpoints in code can be installed :/
    return false;
  }
  // make sure the FPB is enabled
  FPB->FP_CTRL |= 0x3;

  const uint32_t replace = (instr_addr & 0x2) == 0 ? 1 : 2;
  const uint32_t fp_comp = (instr_addr & ~0x3) | 0x1 | (replace << 30);
  FPB->FP_COMP[comp_id] = fp_comp;
  return true;
}
For more details on how to configure the Flash Patch And Breakpoint (FPB) unit, check out our “How do breakpoints even work?” post!
To facilitate breakpoint testing, I’ve added dummy_function_1 through dummy_function_9 to my
program. All the functions do is print the name of the function being executed:
void dummy_function_3(void) {
  EXAMPLE_LOG("stub function '%s' called", __func__);
}
We will be calling these functions to test out our debug monitor mode implementation.
I’ve also added a few CLI commands to the shell to help us configure the DebugMonitor exception handler, enable breakpoints, and call the dummy functions:
shell> help
bkpt: Issue a Breakpoint Instruction
debug_mon_en: Enable Monitor Debug Mode
fpb_dump: Dump Active FPB Settings
fpb_set_breakpoint: Set Breakpoint [Comp Id] [Address]
call_dummy_funcs: Invoke dummy functions
dump_dummy_funcs: Print first instruction of each dummy function
help: Lists all commands
Let’s try configuring a breakpoint for dummy_function_4, address 0x270, and see what happens:
shell> dump_dummy_funcs
 ...
dummy_function_4: Starts at 0x270. First Instruction = 0x48024901
 ...
shell> debug_mon_en
Monitor Mode Debug Enabled!

shell> fpb_set_breakpoint 0 0x270
Set breakpoint on address 0x270 in FP_COMP[0] Succeeded

shell> fpb_dump
FPB Revision: 0, Enabled: 1, Hardware Breakpoints: 6
  FP_COMP[0] Enabled 1, Replace: 1, Address 0x270
  ...

shell> call_dummy_funcs
stub function 'dummy_function_1' called
stub function 'dummy_function_2' called
stub function 'dummy_function_3' called
DebugMonitor Exception
DEMCR: 0x01010000
DFSR:  0x00000002 (bkpt=1, halt=0, dwt=0)
Register Dump
 r0  =0x200031d8
 r1  =0x00000028
 r2  =0x00000001
 r3  =0x00000271
 r12 =0xffffffff
 lr  =0x000009ed
 pc  =0x00000270
 xpsr=0x010f0000
As expected we see our DebugMon_Handler has been invoked on address pc =0x00000270 which
is where we installed the breakpoint!
Adding a CLI to the DebugMonitor Exception
To add a CLI for DebugMonitor handling, all we need is a way to read in bytes over a UART from a ISR. This can be done by either polling the peripheral or by using an interrupt that is configured to run at a higher priority than the DebugMonitor exception to do the reading.
In our example app, we will add two commands:
-
c- To continue after the DebugMonitor exception fires -
s- To step one instruction and then return to the DebugMonitor Exception
C Code Additions for DebugMonitor CLI
typedef enum {
  kDebugState_None,
  kDebugState_SingleStep,
} eDebugState;

static eDebugState s_user_requested_debug_state = kDebugState_None;

void debug_monitor_handler_c(sContextStateFrame *frame) {
  // ... logic to dump info ...

  if (is_dwt_dbg_evt || is_bkpt_dbg_evt ||
      (s_user_requested_debug_state == kDebugState_SingleStep))  {
    EXAMPLE_LOG("Debug Event Detected, Awaiting 'c' or 's'");
    while (1) {
      char c;
      if (!shell_port_getchar(&c)) {
        continue;
      }

      EXAMPLE_LOG("Got char '%c'!\n", c);
      if (c == 'c') {
        s_user_requested_debug_state = kDebugState_None;
        break;
      } else if (c == 's') {
        s_user_requested_debug_state = kDebugState_SingleStep;
        break;
      }
    }
  } else {
    EXAMPLE_LOG("Resuming ...");
  }

  // ... other logic ...
}
Debug Monitor Continue and Step Support
Stepping over a breakpoint is a several step process:
- If it’s a
bkptinstruction, we need to advance the program counter by the size of the instruction (2 bytes). - If a
bkptevent was generated from a breakpoint configured in the FPB, we need to:- Disable the FPB. Otherwise, any attempt to continue will just hit the breakpoint again.
- Single-Step one instruction.
- Re-enable the FPB and disable single-stepping in order to resume program execution.
In our DebugMon_Handler, we can:
- inspect the
pcfrom theframeparameter passed todebug_monitor_handler_cto figure out whether or not the debug event was caused by executing a breakpoint instruction. - Disable/Enable the FPB by clearing & setting the
ENABLEbit in the FPBFP_CTRLregister. - Enable/Disable single-step functionality by setting and clearing the
MON_STEPbit in theDEMCR.
C Code Additions for DebugMonitor Breakpoint & Single-Step Handling
Let’s implement the logic described above in code:
  const uint32_t demcr_single_step_mask = (1 << 18);

  if (is_bkpt_dbg_evt) {
    const uint16_t instruction = *(uint16_t*)frame->return_address;
    if ((instruction & 0xff00) == 0xbe00) {
      // advance past breakpoint instruction
      frame->return_address += sizeof(instruction);
    } else {
      // It's a FPB generated breakpoint
      // We need to disable the FPB and single-step
      fpb_disable();
      EXAMPLE_LOG("Single-Stepping over FPB at 0x%x", frame->return_address);
    }

    // single-step to the next instruction
    // This will cause a DebugMonitor interrupt to fire
    // once we return from the exception and a single
    // instruction has been executed. The HALTED bit
    // will be set in the DFSR when this happens.
    *demcr |= (demcr_single_step_mask);
    // We have serviced the breakpoint event so clear mask
    *dfsr = dfsr_bkpt_evt_bitmask;
  } else if (is_halt_dbg_evt) {
    // re-enable FPB in case we got here via single-step
    // for a BKPT debug event
    fpb_enable();

    if (s_debug_state != kDebugState_SingleStep) {
      *demcr &= ~(demcr_single_step_mask);
    }

    // We have serviced the single step event so clear mask
    *dfsr = dfsr_halt_evt_bitmask;
  }
Single Stepping On a Running System
Now we can test out the single-step feature for dummy_function_4.
We can use disassemble in GDB to determine what we expect to see if things are working.
(gdb) disass dummy_function_4
Dump of assembler code for function dummy_function_4:
   0x00000270 <+0>:	ldr	r1, [pc, #4]	; (0x278 <dummy_function_4+8>)
   0x00000272 <+2>:	ldr	r0, [pc, #8]	; (0x27c <dummy_function_4+12>)
   0x00000274 <+4>:	b.w	0x6c0 <example_log>
   0x00000278 <+8>:	strb	r6, [r2, #21]
   0x0000027a <+10>:	movs	r0, r0
   0x0000027c <+12>:	strb	r1, [r1, #20]
   0x0000027e <+14>:	movs	r0, r0
End of assembler dump.
We will install a breakpoint at address 0x270, so if we single step after that we should see, 0x272,
0x274 and then a branch to 0x6c0 executed by the processor.
shell> debug_mon_en
Monitor Mode Debug Enabled!

shell> fpb_set_breakpoint 0 0x270

shell> call_dummy_funcs
stub function 'dummy_function_1' called
stub function 'dummy_function_2' called
stub function 'dummy_function_3' called
DebugMonitor Exception
DEMCR: 0x01010000
DFSR:  0x00000002 (bkpt=1, halt=0, dwt=0)
Register Dump
 r0  =0x200031d8
 r1  =0x00000028
 r2  =0x00000001
 r3  =0x00000271
 r12 =0xffffffff
 lr  =0x00000a05
 pc  =0x00000270
 xpsr=0x010d0000
Debug Event Detected, Awaiting 'c' or 's'
# Type 's'
Got char 's'!
 ...
 pc  =0x00000272
 ...
Debug Event Detected, Awaiting 'c' or 's'
# Type 's'
Got char 's'!
 ...
 pc  =0x00000274
 ...
Debug Event Detected, Awaiting 'c' or 's'
# Type 's'
Got char 's'!
 ...
 pc  =0x000006c0
 ...
Debug Event Detected, Awaiting 'c' or 's'
# Resume flow 'c' and we should see the
# rest of the functions get called!
Got char 'c'!

stub function 'dummy_function_4' called
stub function 'dummy_function_5' called
stub function 'dummy_function_6' called
stub function 'dummy_function_7' called
stub function 'dummy_function_8' called
stub function 'dummy_function_9' called
stub function 'dummy_function_ram' called
Nice, it works!
At this point, to make the DebugMonitor CLI interface more useful, we could extend the shell to dump the contents of the stack or other memory regions.
Applications
There’s a couple projects online today that make use of the debug monitor functionality. Notably,
- SEGGER ships an SDK8 that you compile into your project to enable Monitor Mode Debug support with SEGGER’s tools. There’s quite a few articles about how to make use of it on the NRF5x series9. On the NRF52, this let’s you set breakpoints in application code without triggering asserts in the Soft Device (because all that code runs from a higher priority interrupt).
- The Monitor For Remote Inspection Project on GitHub 1 exposes a DebugMonitor port which implements the GDB Remote Serial Protocol10. When compiled into a project, you can connect GDB directly to your board via the UART connection!
There’s a lot of additional use cases you may want to include an implementation for in your system as well. Some of my favorites include:
- exposing a debug interface for third party developers on an embedded platform.
- debugging of sealed units where there is only a UART or network interface exposed
- debugging power consumption issues where maintaining a SWD/JTAG connection would ruin attempts to monitor the quiescent current because the debug interface itself consumes a lot of power.
Final Thoughts
I hope this article taught you a little bit about ARM debug monitor mode handling and got you thinking about creative ways the feature can be leveraged.
Have you used the monitor mode debugging for any projects you’ve worked on. If so, we’d love to hear what you used it for in the discussion area below!
See anything you'd like to change? Submit a pull request or open an issue on our GitHub
References
 Chris Coleman is a founder and CTO at Memfault. Prior to founding Memfault, Chris worked on the embedded software teams at Sun, Pebble, and Fitbit.