How do breakpoints even work?
The idea of halting program execution was invented over 70 years ago as part of the ENIAC digital computer. At the time, to pause a program and debug, you had to physically unplug one of the cables controlling program flow, which was coined a “breakpoint”. 1
Today, breakpoints are a ubiquitous way of debugging programs and most chip architectures even have dedicated instructions to trigger them! Have you ever wondered how they actually work? Or at the very least, gotten upset when they do not?
In this article, we will discuss the basic types of breakpoints (hardware and software) and how they are utilized by the GNU Project Debugger, GDB. We will then explore how to configure hardware breakpoints on an ARM Cortex-M MCU using the Flash Patch and Breakpoint Unit (FPB) and examine a real-world configuration with an example application.
Note: While the focus of the article will be about breakpoints and how they work for firmware based on ARM Cortex-M MCUs, the general ideas presented apply to any compiled language and debugger.
Table of Contents
Basic Terminology
There are two classes of breakpoints known as the “hardware breakpoint” and “software breakpoint”.
Hardware Breakpoint
Hardware breakpoints are implemented by the chipset being used. At the silicon level, they are comparators that compare the instruction being fetched against an instruction configured in a peripheral register. When the instructions match, the hardware will trigger a debug event, halting the core or generating an exception. There’s usually a small, fixed number of hardware breakpoints available for any given chip. If you’ve ever used a debugger where you ran out of breakpoints, this is why!
Software Breakpoint
Software breakpoints, on the other hand, are implemented by your debugger. They work by patching the code you are trying to execute with an instruction that triggers a debug event in some fashion. This is accomplished by injecting a breakpoint instruction or when that is not supported by inserting an instruction that causes a fault that halts the core.
With software breakpoints, a debugger can essentially expose an “unlimited” number of breakpoints. There are some challenges to deal with though:
- Not all code regions are patchable (i.e Read-Only-Memory (ROM))
- If the debugger crashes, the code can be left in a bad state (patched instruction instead of the actual code!).
Example Project Setup
In the following sections, we will explore how breakpoints work by making use of a very simple bare-metal application running on a nRF52 using the following tooling:
- a nRF52840-DK2 (ARM Cortex-M4F) as our development board
- SEGGER JLinkGDBServer3 as our gdbserver (V6.80b)
- GCC 9.3.1 / GNU Arm Embedded Toolchain as our compiler4
- GNU Make as our build system
- the simple CLI shell we built up in a previous post.
- PySerial’s
miniterm.py5 to connect to the serial console on the nRF52.
Compiling and Flashing Project
If you have an nRF52840-DK and would like to follow along:
Launch JLinkGDBServer
$ JLinkGDBServer -if swd -device nRF52840_xxAA -nogui
Clone, Compile & Flash
$ git clone https://github.com/memfault/interrupt.git
$ cd examples/breakpoint

# Build
$ make
Compiling src/dummy_functions.c
Compiling src/fpb.c
Compiling src/log_port.c
Compiling src/main.c
Compiling src/minimal_nrf52_uart.c
Compiling src/shell.c
Compiling src/shell_commands.c
Compiling src/shell_port.c
Compiling src/startup.c
Linking library
Generated build/nrf52.elf

# Flash & Debug
$ make flash
(gdb)
Open a Serial Connection to Shell
# Start Miniterm (Separate Terminal)
$ miniterm.py /dev/cu.usbmodem* 115200 --raw
--- Miniterm on /dev/cu.usbmodem0006838593731  115200,8,N,1 ---
--- Quit: Ctrl+] | Menu: Ctrl+T | Help: Ctrl+T followed by Ctrl+H ---
==Booted==

shell>
GDB Breakpoint Handling
Let’s start by taking a look at how breakpoints are handled with GDB.
A full discussion of debug interfaces is outside the scope of this article but more details can be found in our post on the topic. We’ll recap the parts relevant to this post below.
At a high level, gdb (the “client”) interfaces with the embedded MCU via a gdbserver (in our case SEGGER’s JLinkGDBServer). The protocol talked between the gdb “client” and the gdb “server” is referred to as “GDB Remote Serial Protocol” (GDB RSP)6.
If we take a look at the GDB RSP docs we will find that the ‘z’ packets are used to configure breakpoints.
GDB RSP Breakpoint Command
The format of the commands are ‘Z/z type,addr,kind’ where:
| GDB Remote Serial Packet | Operation |
|---|---|
Z0,addr,kind |
Add Software Breakpoint at addr
|
z0,addr,kind |
Remove Software Breakpoint at addr
|
Z1,addr,kind |
Add Hardware Breakpoint at addr
|
z1,addr,kind |
Remove Hardware Breakpoint at addr
|
kind is architecture specific but for ARM it indicates what instruction to use. (The instruction changes depending on whether the MCU uses the ARM or Thumb instruction set).7
NOTE: The use of “software” breakpoint in GDB RSP is a bit of a misnomer. The gdbserver can choose how to best install the breakpoint. For example, the server may opt to install a “software” breakpoint as a hardware breakpoint if there are still ones available.
Debugging GDB Remote Serial Protocol
With that out of the way, let’s take a look at the actual GDB RSP commands that get sent over the wire when we install a breakpoint. Conveniently GDB has a builtin debug command, set debug remote 1, which can be used to enable printing of every single command sent between the client and server!
To facilitate breakpoint testing, I’ve added dummy_function_1 through dummy_function_9 to my
program that we can set breakpoints for. All the functions do is print the name of the
function being executed:
void dummy_function_3(void) {
  EXAMPLE_LOG("stub function '%s' called", __func__);
}
I also added dump_dummy_funcs to the firmware CLI to print information about them all:
shell> dump_dummy_funcs
dummy_function_1: Starts at 0x240. First Instruction = 0x48024901
dummy_function_2: Starts at 0x250. First Instruction = 0x48024901
dummy_function_3: Starts at 0x260. First Instruction = 0x48024901
dummy_function_4: Starts at 0x270. First Instruction = 0x48024901
dummy_function_5: Starts at 0x280. First Instruction = 0x48024901
dummy_function_6: Starts at 0x290. First Instruction = 0x48024901
dummy_function_7: Starts at 0x2a0. First Instruction = 0x48024901
dummy_function_8: Starts at 0x2b0. First Instruction = 0x48024901
dummy_function_9: Starts at 0x2c0. First Instruction = 0x48024901
dummy_function_ram: Starts at 0x20000000. First Instruction = 0x48024901
We dump the name and address to make it easier to correlate the function address with the GDB RSP and we dump the first couple instructions so we can easily check if a software breakpoint was installed (if the code was patched, the first instruction will change).
We can confirm that after a flash bootup, the info printed via the CLI matches what we see when dumping the info from the ELF file. For example:
$ arm-none-eabi-objdump --disassemble=dummy_function_1 build/nrf52.elf
[...]
00000240 <dummy_function_1>:
 240:	4901        ldr	r1, [pc, #4]	; (248 <dummy_function_1+0x8>)
 242:	4802        ldr	r0, [pc, #8]	; (24c <dummy_function_1+0xc>)
dummy_function_1 “Starts at 0x240” and “Instruction = 0x48024901” captures the first two 16-bit
instructions 0x4901 (ldr r1, [pc, #4]) and 0x4802 (ldr r0, [pc, #8]).
GDB RSP while Setting Breakpoints
Let’s flip on GDB RSP debug tracing, install a breakpoint, and see what happens.
(gdb) set debug remote 1
(gdb) break dummy_function_1
Sending packet: $m80,4#35...Packet received: 2de9f341
Sending packet: $m240,40#93...Packet received:[...]
Sending packet: $m248,4#6b...Packet received: 2f730000
Sending packet: $m248,4#6b...Packet received: 2f730000
Sending packet: $m240,2#61...Packet received: 0149
Breakpoint 1 at 0x240: file stub_functions.c, line 4.
We see some m packets
(m addr,length). These are used for requesting reads of memory but no breakpoint set commands?! Let’s continue and see what happens:
(gdb) continue
Continuing.
(gdb) c
Continuing.
==> Sending packet: $Z0,240,2#aa...Packet received: OK
==> Packet Z0 (software-breakpoint) is supported
Sending packet: $vCont?#49...Packet received:
Packet vCont (verbose-resume) is NOT supported
Sending packet: $Hc0#db...Packet received: OK
Sending packet: $c#63...
We see a $Z0,240,2 request issued which means “install a software breakpoint at address 0x240”. This matches the address of dummy_function_1 so that’s what we’d expect! It looks like breakpoints are only installed when we resume.
GDB RSP when a Breakpoint Triggers
Now let’s actually cause the breakpoint to be triggered by executing the function we installed the
breakpoint on. I’ve added a CLI command to the example project, call_dummy_funcs that simply
calls all the dummy_function_* routines in a row:
shell> call_dummy_funcs
[... GDB should have halted ...]
Sending packet: $c#63...Packet received: T05hwbreak:;thread:0000DEAD;
Sending packet: $g#67...Packet received:[...]
Sending packet: $qfThreadInfo#bb...Packet received: m0000dead
Sending packet: $qsThreadInfo#c8...Packet received: l
===>Sending packet: $z0,240,2#ca...Packet received: OK

Breakpoint 1, Sending packet: $m240,4#63...Packet received: 01490248
dummy_function_1 () at dummy_functions.c:4
4     EXAMPLE_LOG("stub function '%s' called", __func__);
We can see from the trace above that a breakpoint debug event took place. This is conveyed by the
T AA n1:r1;n2:r2;…
Stop Reply Packet where T indicates a signal was received and hwbreak indicates a hardware
breakpoint was hit.
Note: The
thread:0000DEADconveys the “thread” the signal was generated on where 0000DEAD is the thread-id. Since we are running a baremetal system, I think someone at SEGGER just had some fun and used0xdeadas the id. In GDB the only place you see it reflected is as the “Target Id” when runninginfo threads:(gdb) info threads Id Target Id Frame * 1 Thread 57005 dummy_function_1 () at dummy_functions.c:4 (gdb) p/x 57005 $1 = 0xdead (gdb)
We also see a request to remove the breakpoint was sent ($z0,240,2). That’s strange. We expect the breakpoint to keep firing once it has been installed. Let’s continue from the breakpoint and see what happens:
GDB RSP when a Continuing After a Breakpoint Trigger
(gdb) c
Continuing.
Sending packet: $Hcdead#39...Packet received: OK
===>Sending packet: $s#73... Packet received: T05hwbreak:;thread:0000DEAD;
Sending packet: $g#67...Packet received: [...]
===>Sending packet: $Z0,240,2#aa...Packet received: OK
Sending packet: $Hc0#db...Packet received: OK
===>Sending packet: $c#63...
Breaking it down:
- an
spacket is sent to indicate that the debugger is requesting a single step - The MCU generates a debug event and gdb receives a halt signal again (
T05hwbreakpacket). - Our breakpoint on
dummy_function_1is re-installed ($Z0,240,2). - The continuation we requested in the first place is issued with the
cpacket.
Thinking about this, it starts to make sense. If GDB hadn’t removed the breakpoint, the breakpoint we had set would repeatedly fire when we try to continue. By single-stepping over the instruction while breakpoints are disabled we can get past the instruction which caused the breakpoint and re-enable all the breakpoints before we miss any new ones.
The other advantage of removing and adding back breakpoints anytime the system is halted is it reduces the probability of the debugger getting killed and leaving the system in a state where breakpoints are left installed.
Fun Fact: GDB doesn’t send the
spacket for single-stepping on all targets. Some targets (such as arm-elf-linux-*) use “software single stepping” where GDB will determine the next instruction itself and install a hardware breakpoint at that location. This can be useful if native single stepping is not supported. You can check if this mode is in use by dumping the gdb-specific arch information,maintenance print architecture, and looking to see ifgdbarch_software_single_step_pis not a NULL pointer.
Cortex-M Hardware Breakpoints
Now that we have a pretty good idea of how GDB sets and removes breakpoints let’s see if we can figure out how the gdbserver is actually installing them for the nRF52 Cortex-M target.
Flash Patch & Breakpoint Unit
For ARM Cortex-M MCUs, hardware breakpoint functionality is exposed via the Flash Patch and Breakpoint Unit (FPB)8.
The FPB has two main features:
- Allows hardware breakpoints to be configured and enabled.
- Allows patching of Flash Code & Data. Historically this has been a popular way to debug ROM bootloaders or ship fixes for devices that can’t perform full over the air updates. These days more and more embedded devices perform full firmware updates and so the practice is becoming less common. The art of flash patching deserves a post of its own so we won’t be digging deeper here.
For breakpoint management, there are two register types you will care about inside the FPB, FP_CTRL & FP_COMPn.
Flash Patch Control Register, FP_CTRL, 0xE0002000
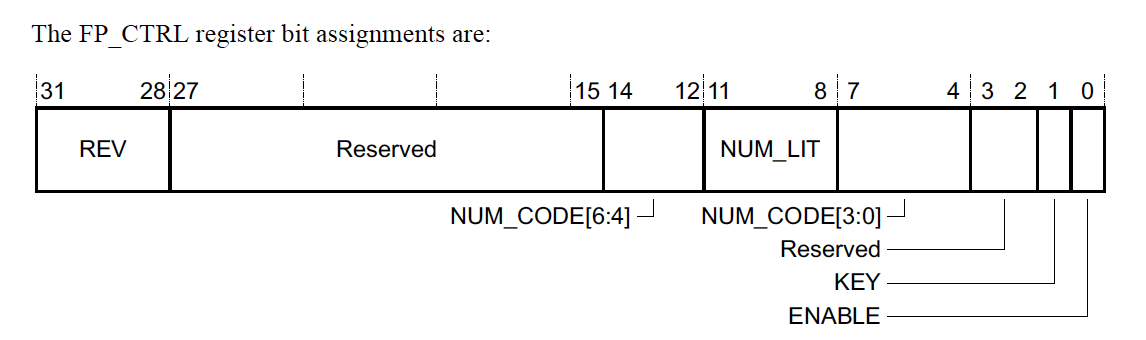
The FP_CTRL is where you can find out information about how many hardware breakpoints are supported and enable the FPB. Notably,
-
REV: There are only two revisions available today, Version 1 (REV=0) & Version 2 (REV=1). Depending on the revision, the layout of theFP_COMPnregister will be slightly different. The notable difference between the two versions is that for Version 1 breakpoints can only be installed if the address is in the ARM Code Region range (0x00000000-0x1FFFFFFF) but with Version 2 breakpoints can be installed over the entire 4GB address space. - Number of Available Hardware Breakpoints can be computed by:
FP_CTRL[6:4] << 4 | FP_CTRL[3:0] -
ENABLEturns on the FPB Unit when set to 1 and disables it when set to 0.
NOTE: A write to the
FP_CTRLregister will only take effect if theKEYbit is 1. Otherwise, the operation will be a no-op.
Flash Patch Comparator register, FP_COMPn, 0xE0002008- 0xE0002008+4n
Comparators for breakpoints will always be FP_COMP0 up to the number of supported breakpoints minus 1. Technically up to 127 hardware breakpoints can be implemented but usually only 2-6 are.
Version 1 Layout
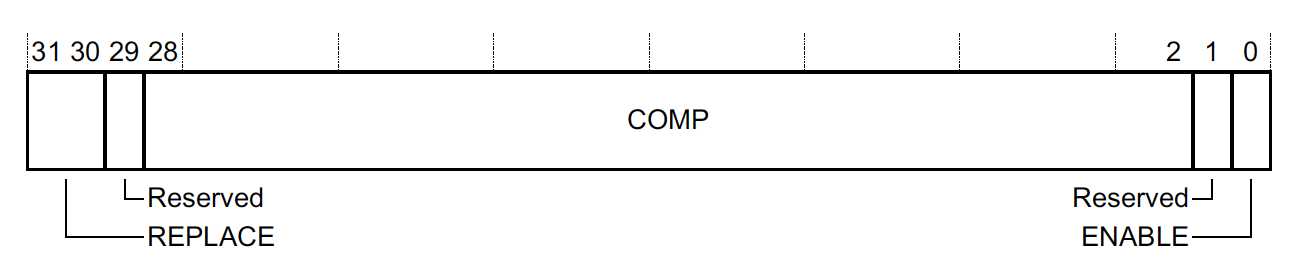
ENABLE flips on the individual comparator and REPLACE controls the behavior as follows:
| Replace | Behavior |
|---|---|
| 0b00 | N/A - Used to enable Flash Patching |
| 0b01 | Install breakpoint on instruction at 0b000:FP_COMP[28:2]:00. |
| 0b10 | Install breakpoint on instruction at 0b000:FP_COMP[28:2]:10. |
| 0b11 | Install breakpoint on instructions at both 0b000:FP_COMP[28:2]:00 & 0b000:FP_COMP[28:2]:10
|
Version 2 Layout
The Version 2 Layout is a little more straightforward. Bit 0, Breakpoint Enable (BE), controls whether or not the breakpoint is enabled:
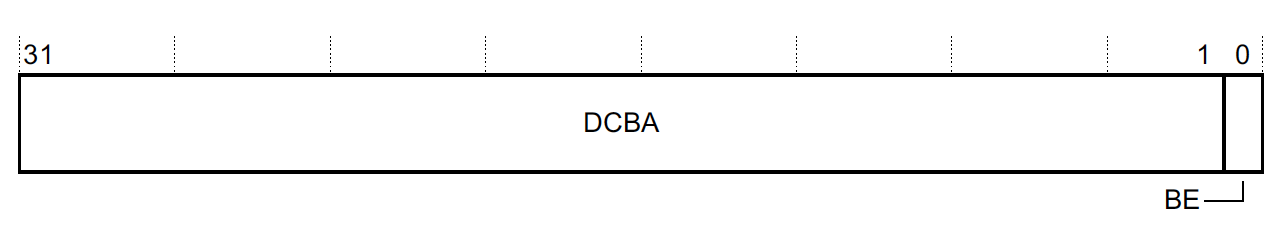
Bit 31:1 is the address to break on:

Note this is able to cover the entire 32-bit address space even though the bottom bit is used for BE because bit 0 is used to convey whether the ARM or Thumb instruction set is being used rather than encoding any address information and instructions must be aligned by their width.
Examining FPB Configuration
Recall that GDB will uninstall breakpoints when the system halts so this is a rare situation where we can only debug the configuration on a running system!
The nRF52 includes a Version 1 FPB so from here on out our code examples will make use of that implementation. Here’s a minimal snippet of code which can be used to dump the config:
C Code to Dump FPB Config
#include <stdint.h>
#include <stddef.h>

typedef struct {
  volatile uint32_t FP_CTRL;
  volatile uint32_t FP_REMAP;
  // Number Implemented determined by FP_CTRL
  volatile uint32_t FP_COMP[];
} sFpbUnit;

static sFpbUnit *const FPB = (sFpbUnit *)0xE0002000;

void fpb_dump_breakpoint_config(void) {
  const uint32_t fp_ctrl = FPB->FP_CTRL;
  const uint32_t fpb_enabled = fp_ctrl & 0x1;
  const uint32_t revision = (fp_ctrl >> 28) & 0xF;
  const uint32_t num_code_comparators =
      (((fp_ctrl >> 12) & 0x7) << 4) | ((fp_ctrl >> 4) & 0xF);

  EXAMPLE_LOG("FPB Revision: %d, Enabled: %d, Hardware Breakpoints: %d",
              revision, (int)fpb_enabled, (int)num_code_comparators);

  for (size_t i = 0; i < num_code_comparators; i++) {
    const uint32_t fp_comp = FPB->FP_COMP[i];
    const bool enabled = fp_comp & 0x1;
    const uint32_t replace = fp_comp >> 30;

    uint32_t instruction_address = fp_comp & 0x1FFFFFFC;
    if (replace == 0x2) {
      instruction_address |= 0x2;
    }

    EXAMPLE_LOG("  FP_COMP[%d] Enabled %d, Replace: %d, Address 0x%x",
                (int)i, (int)enabled, (int)replace, instruction_address);
  }
}
I’ve hooked fpb_dump_breakpoint_config() up to thefpb_dump shell command in the example app. Let’s take a look at what we get with the breakpoint from dummy_function_1 still set:
shell> fpb_dump
FPB Revision: 0, Enabled: 1, Hardware Breakpoints: 6
  FP_COMP[0] Enabled 1, Replace: 1, Address 0x240
  FP_COMP[1] Enabled 0, Replace: 0, Address 0x0
  FP_COMP[2] Enabled 0, Replace: 0, Address 0x0
  FP_COMP[3] Enabled 0, Replace: 0, Address 0x0
  FP_COMP[4] Enabled 0, Replace: 0, Address 0x0
  FP_COMP[5] Enabled 0, Replace: 0, Address 0x0
We can see that the JLinkGDBServer has installed a breakpoint in the first available comparator!
Breakpoint for function Running in RAM
Recall that Version 1 of the FPB only works on addresses in code space. Let’s install a breakpoint for a function running in SRAM (Address 0x20000000-0x3FFFFFFF) and see what happens:
(gdb) break dummy_function_ram
Sending packet: $m20000000,40#7f...Packet received: [...]
Sending packet: $m20000008,4#57...Packet received: c8730000
Sending packet: $m20000008,4#57...Packet received: c8730000
Sending packet: $m20000000,2#4d...Packet received: 0149
Breakpoint 2 at 0x20000000: file dummy_functions.c, line 41.
(gdb) c
Continuing.
==> Sending packet: $Z0,240,2#aa...Packet received: OK
==> Sending packet: $Z0,20000000,2#96...Packet received: OK
Sending packet: $c#63...
Cool, we can see GDB has requested breakpoints get installed at address 0x240 & 0x20000000.
shell> fpb_dump
FPB Revision: 0, Enabled: 1, Hardware Breakpoints: 6
  FP_COMP[0] Enabled 1, Replace: 1, Address 0x240
  FP_COMP[1] Enabled 0, Replace: 0, Address 0x0
  FP_COMP[2] Enabled 0, Replace: 0, Address 0x0
  FP_COMP[3] Enabled 0, Replace: 0, Address 0x0
  FP_COMP[4] Enabled 0, Replace: 0, Address 0x0
  FP_COMP[5] Enabled 0, Replace: 0, Address 0x0
We can see the breakpoint for dummy_function_1 is still configured in the FPB but where is the one for the RAM function?!
The only way this could have worked is if the debugger was able to install a “software breakpoint”. Let’s take a look at the instructions:
shell> dump_dummy_funcs
dummy_function_1: Starts at 0x240. First Instruction = 0x48024901
dummy_function_2: Starts at 0x250. First Instruction = 0x48024901
dummy_function_3: Starts at 0x260. First Instruction = 0x48024901
dummy_function_4: Starts at 0x270. First Instruction = 0x48024901
dummy_function_5: Starts at 0x280. First Instruction = 0x48024901
dummy_function_6: Starts at 0x290. First Instruction = 0x48024901
dummy_function_7: Starts at 0x2a0. First Instruction = 0x48024901
dummy_function_8: Starts at 0x2b0. First Instruction = 0x48024901
dummy_function_9: Starts at 0x2c0. First Instruction = 0x48024901
dummy_function_ram: Starts at 0x20000000. First Instruction = 0x4802be00
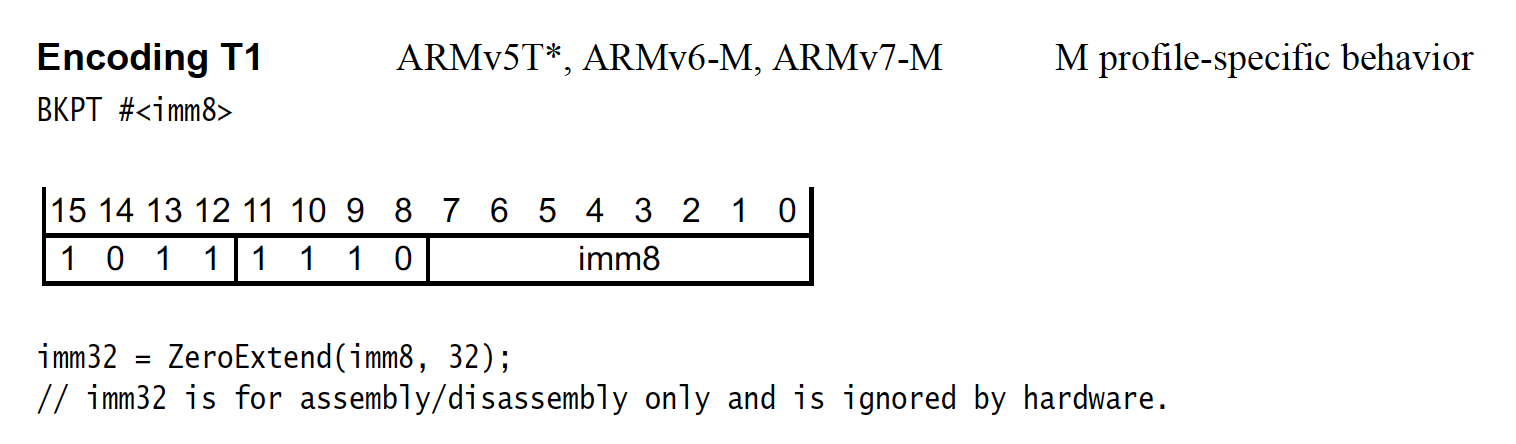
You can see that the first instruction for dummy_function_ram has been modified by the debugger from 0x4901 to 0xbe00.
The astute observer may realize right away this is the encoding for a breakpoint in thumb mode:
BKPT Instruction Encoding
Using all the Hardware Breakpoints
Let’s halt and install 5 more breakpoints, exhausting our 6 available hardware breakpoints, and see what happens!
(gdb) break dummy_function_2
Breakpoint 2 at 0x250: file dummy_functions.c, line 8.
(gdb) break dummy_function_3
Breakpoint 3 at 0x260: file dummy_functions.c, line 12.
(gdb) break dummy_function_4
Breakpoint 4 at 0x270: file dummy_functions.c, line 16.
(gdb) break dummy_function_5
Breakpoint 5 at 0x280: file dummy_functions.c, line 20.
(gdb) break dummy_function_6
Breakpoint 6 at 0x290: file dummy_functions.c, line 24.
(gdb) c
Continuing.
Sending packet: $Z0,240,2#aa...Packet received: OK
Sending packet: $Z0,250,2#ab...Packet received: OK
Sending packet: $Z0,260,2#ac...Packet received: OK
Sending packet: $Z0,270,2#ad...Packet received: OK
Sending packet: $Z0,280,2#ae...Packet received: OK
Sending packet: $Z0,290,2#af...Packet received: OK
Sending packet: $Z0,20000000,2#96...Packet received: OK
Sending packet: $c#63...
As expected, we see requests to install breakpoints on all the locations we specified. We can dump the fpb config from the CLI and confirm:
shell> fpb_dump
FPB Revision: 0, Enabled: 1, Hardware Breakpoints: 6
  FP_COMP[0] Enabled 1, Replace: 1, Address 0x240
  FP_COMP[1] Enabled 1, Replace: 1, Address 0x250
  FP_COMP[2] Enabled 1, Replace: 1, Address 0x260
  FP_COMP[3] Enabled 1, Replace: 1, Address 0x270
  FP_COMP[4] Enabled 1, Replace: 1, Address 0x280
  FP_COMP[5] Enabled 1, Replace: 1, Address 0x290
Installing Software Breakpoints in Flash
Now that we have used all of the available hardware breakpoints what happens if we try to add one for another flash-based function?
break dummy_function_7
Breakpoint 8 at 0x2a0: file dummy_functions.c, line 28.
(gdb) c
Continuing.
Sending packet: $Z0,240,2#aa...Packet received: OK
Sending packet: $Z0,250,2#ab...Packet received: OK
Sending packet: $Z0,260,2#ac...Packet received: OK
Sending packet: $Z0,270,2#ad...Packet received: OK
Sending packet: $Z0,280,2#ae...Packet received: OK
Sending packet: $Z0,290,2#af...Packet received: OK
Sending packet: $Z0,2a0,2#d7...Packet received: OK
Sending packet: $Z0,20000000,2#96...Packet received: OK
Sending packet: $c#63...
shell> fpb_dump
FPB Revision: 0, Enabled: 1, Hardware Breakpoints: 6
  FP_COMP[0] Enabled 1, Replace: 1, Address 0x250
  FP_COMP[1] Enabled 1, Replace: 1, Address 0x260
  FP_COMP[2] Enabled 1, Replace: 1, Address 0x270
  FP_COMP[3] Enabled 1, Replace: 1, Address 0x280
  FP_COMP[4] Enabled 1, Replace: 1, Address 0x290
  FP_COMP[5] Enabled 1, Replace: 1, Address 0x2a0
Interesting, it looks like the breakpoint for dummy_function_1 (address 0x240) has been removed from FP_COMP_0 and dummy_function_2 through dummy_function_7 have been configured as hardware breakpoints.
Let’s call all the functions, using the call_dummy_funcs shell command and confirm we break at dummy_function_1..dummy_function_7 as well as dummy_function_ram:
(gdb) c
Continuing.

Breakpoint 1, dummy_function_1 () at dummy_functions.c:4
4     EXAMPLE_LOG("stub function '%s' called", __func__);
(gdb) c
Continuing.

Breakpoint 3, dummy_function_2 () at dummy_functions.c:8
8     EXAMPLE_LOG("stub function '%s' called", __func__);
(gdb) c
Continuing.

[...]

Breakpoint 8, dummy_function_7 () at dummy_functions.c:28
28    EXAMPLE_LOG("stub function '%s' called", __func__);
(gdb) c
Continuing.

Breakpoint 2, dummy_function_ram () at dummy_functions.c:41
41    EXAMPLE_LOG("stub function '%s' called", __func__);
(gdb) c
Neat, they all worked so a breakpoint was installed for the flash-based function (dummy_function_1) that was missing from the FPB configuration.
Let’s dump the functions information to examine if any instructions were modified:
shell> dump_dummy_funcs
dummy_function_1: Starts at 0x240. First Instruction = 0x4802be00
dummy_function_2: Starts at 0x250. First Instruction = 0x48024901
dummy_function_3: Starts at 0x260. First Instruction = 0x48024901
dummy_function_4: Starts at 0x270. First Instruction = 0x48024901
dummy_function_5: Starts at 0x280. First Instruction = 0x48024901
dummy_function_6: Starts at 0x290. First Instruction = 0x48024901
dummy_function_7: Starts at 0x2a0. First Instruction = 0x48024901
dummy_function_8: Starts at 0x2b0. First Instruction = 0x48024901
dummy_function_9: Starts at 0x2c0. First Instruction = 0x48024901
dummy_function_ram: Starts at 0x20000000. First Instruction = 0x4802be00
Woah, we can see dummy_function_1 also was updated to include a breakpoint instruction, 0xbe00. What’s interesting here is this address is in the nRF52’s internal flash space. This means to inject this breakpoint the flash page the address is in must have been reprogrammed.
This is in fact exactly what happened. The SEGGER JLinkGDBServer implements a feature referred to
in the docs as “unlimited flash breakpoints”9 which will patch flash regions the J-Link
Software knows how to write to with bkpt instructions. To support this feature, the JLink
software ships with flash drivers for all those chips since they are not standard across different
chip vendors.
Flash Software Breakpoint Optimizations
To minimize the number of times the flash sector has to be rewritten, the JLinkGDBServer will also
perform some nifty optimizations such as caching the flash sector and “simulating”
instruction execution rather than always removing/adding breakpoints on each halt like the gdb
client requests.
Let’s walk through a quick example for our dummy_function_1 where the 0x4901 instruction at
0x240 has been replaced by the gdbserver with a breakpoint instruction.
$ arm-none-eabi-objdump  --disassemble=dummy_function_1  \
    example/breakpoint/build/nrf52.elf
[...]
00000240 <dummy_function_1>:
 240:	4901        ldr	r1, [pc, #4] ; (248 <dummy_function_1+0x8>)
 242:	4802        ldr	r0, [pc, #8] ; (24c <dummy_function_1+0xc>)
 244:	f000 b966   b.w	514 <example_log>
 248:	0000732f    .word	0x0000732f
 24c:	00007315    .word	0x00007315
As we discovered in this article, when we hit the breakpoint at dummy_function_1, the gdb client
will request that we uninstall all breakpoints. Then when we continue, the
gdb client will request a “single-step” over the instruction. In our example this means executing the instruction at
0x240 and halting again on the instruction fetch at 0x242. At this time the gdb client will ask
the server to re-install all the breakpoints (including the one originally at 0x240) and resume.
Instead, the JLinkGDBServer ignores the requests to remove/reinstall the breakpoint and when it
receives the “single-step” request, “simulates” the instruction and updates the registers
with the result directly from the debugger over the Debug Access Port. For the
instruction in our example, this would involve updating $r1 with the .word at $pc+4 (0x248) and then
advancing the $pc by two bytes.
Using this technique the GDBServer rarely has to actually reprogram the flash sector reducing flash write cycles and speeding up the average time it takes to “set” flash breakpoints.
Note: Not many debuggers have this kind of sophisticated functionality. With a gdbserver like OpenOCD or pyOCD, the request to set a breakpoint in a flash region would just fail when you run out of available hardware breakpoints.
Consequences
One adverse side-effect of this approach is if you pull the power to your board and don’t terminate things gracefully, a breakpoint instruction could get stuck on your device until you reflash the board. When no debugger is enabled, executing a breakpoint instruction will escalate to a HardFault, so this could leave your firmware in a state where it would crash loop!
We can try this ourselves:
-
Pull USB power on the nRF52
-
Instead of reattaching GDB, just start a shell:
$ miniterm.py /dev/cu.usbmodem* 115200 --raw shell> -
Dump functions and confirm breakpoint instruction,
0xbe00, is still installed.shell> dump_dummy_funcs dummy_function_1: Starts at 0x240. First Instruction = 0x4802be00 [...] -
Execute dummy functions and confirm this now causes a reboot!
shell> call_dummy_funcs
==Booted==
Final Thoughts
I hope this post taught you something new about breakpoints and that the next time you run into a problem with a debugger and setting breakpoints, you now have some ideas of what to look into!
I’d be curious to hear if you are making use of the ARM Cortex-M FPB in interesting ways for your product or if there are other topics you would have liked to have seen covered with respect to breakpoints. Either way, let us know in the discussion area below!
See anything you'd like to change? Submit a pull request or open an issue on our GitHub
References
 Chris Coleman is a founder and CTO at Memfault. Prior to founding Memfault, Chris worked on the embedded software teams at Sun, Pebble, and Fitbit.