Best Practices for Monitoring Device Connectivity
With the number of wireless SoCs on the market, “Just add connectivity” is finally a reality! “Just” does a lot of lifting in that phrase. Connectivity, whether wired or wireless, adds numerous layers of complexity to your device. Treating your connectivity as a black box early in development is easy, but this strategy will implode when thousands of devices enter the field - trust me, I know. It’s not enough to test from end to end a few times in the office. Controlled tests only partially emulate how a device’s connectivity might perform in the field.
It is crucial to thoroughly understand how your device’s connectivity performs, both presently and overtime after firmware updates. Connectivity is the central conduit delivering core data to and from users, whether through a BLE connection to a phone or gateway, or a direct Internet connection with WiFi or LTE. Device makers must have a handle on this aspect of their product. The best time to instrument your connectivity is yesterday, and the next best time is now!
This post will cover why device connectivity is complex and what methods we have available to diagnose and solve connectivity problems, both in the office and remotely in production. The tool at the core of our strategy is metrics, but we’ll briefly survey other tools like logging and protocol analysis. We’ll look in-depth at the utility of metrics and wrap up with some practical metric examples to use in your device.
Too often, teams jump into building a connected device without thinking about how to gain insights when the product is in the hands of users and not at their desks. Following these best practices, you’ll be tuned into how your connectivity path operates in the wild.
Table of Contents
The Fun Nightmares of Connected Devices
At one of my previous companies, we released a BLE hub device to forward data from our BLE-based wearable over WiFi/Ethernet. The hub allowed users to quickly upload their recorded data without requiring a phone to be near these BLE devices during transfer. Customers often would power on a new hub only to be unable to connect to a network (unsupported WiFi band) or connect to our backend (port 443 blocked). Even crossing continents caused issues as the device booted with the incorrect system time. At some point, you will experience similar nightmares of connectivity. Why do these problems exist in the first place, though? Here’s some of what makes connectivity challenging:
- Complexity: Connectivity schemes are complex, but for good reason. These protocols have separate layers responsible for security, routing, retransmission, framing, and error detection. This significant cost does bring the benefit of robustness in nearly all situations.
- Interoperability: Connectivity requires compatible operation between multiple components and entities. Let’s take the case of BLE. Here, we have to contend with our device’s BLE version, the phone/gateway’s BLE version, the phone/gateway OS-supported BLE features, the version of the device’s BLE service, the client-side compatibility with the service, etc. There’s an unlimited number of combinations to take into account.
- Environmental Conditions: One of the most challenging factors is how a device’s environment affects connectivity performance. Depending on the protocol and congestion, this can reduce bandwidth by orders of magnitude or even result in full denial of service. The device environment can manifest in strange intermittent failures or change the operating range of your device.
- Accessibility: One of the most frustrating problems is that when you need your device’s data the most, you may not be able to get it! To get insights on connectivity, either you need an out-of-band channel using a different method, or you need to be connected. To get connectivity data, we need connectivity in the first place!
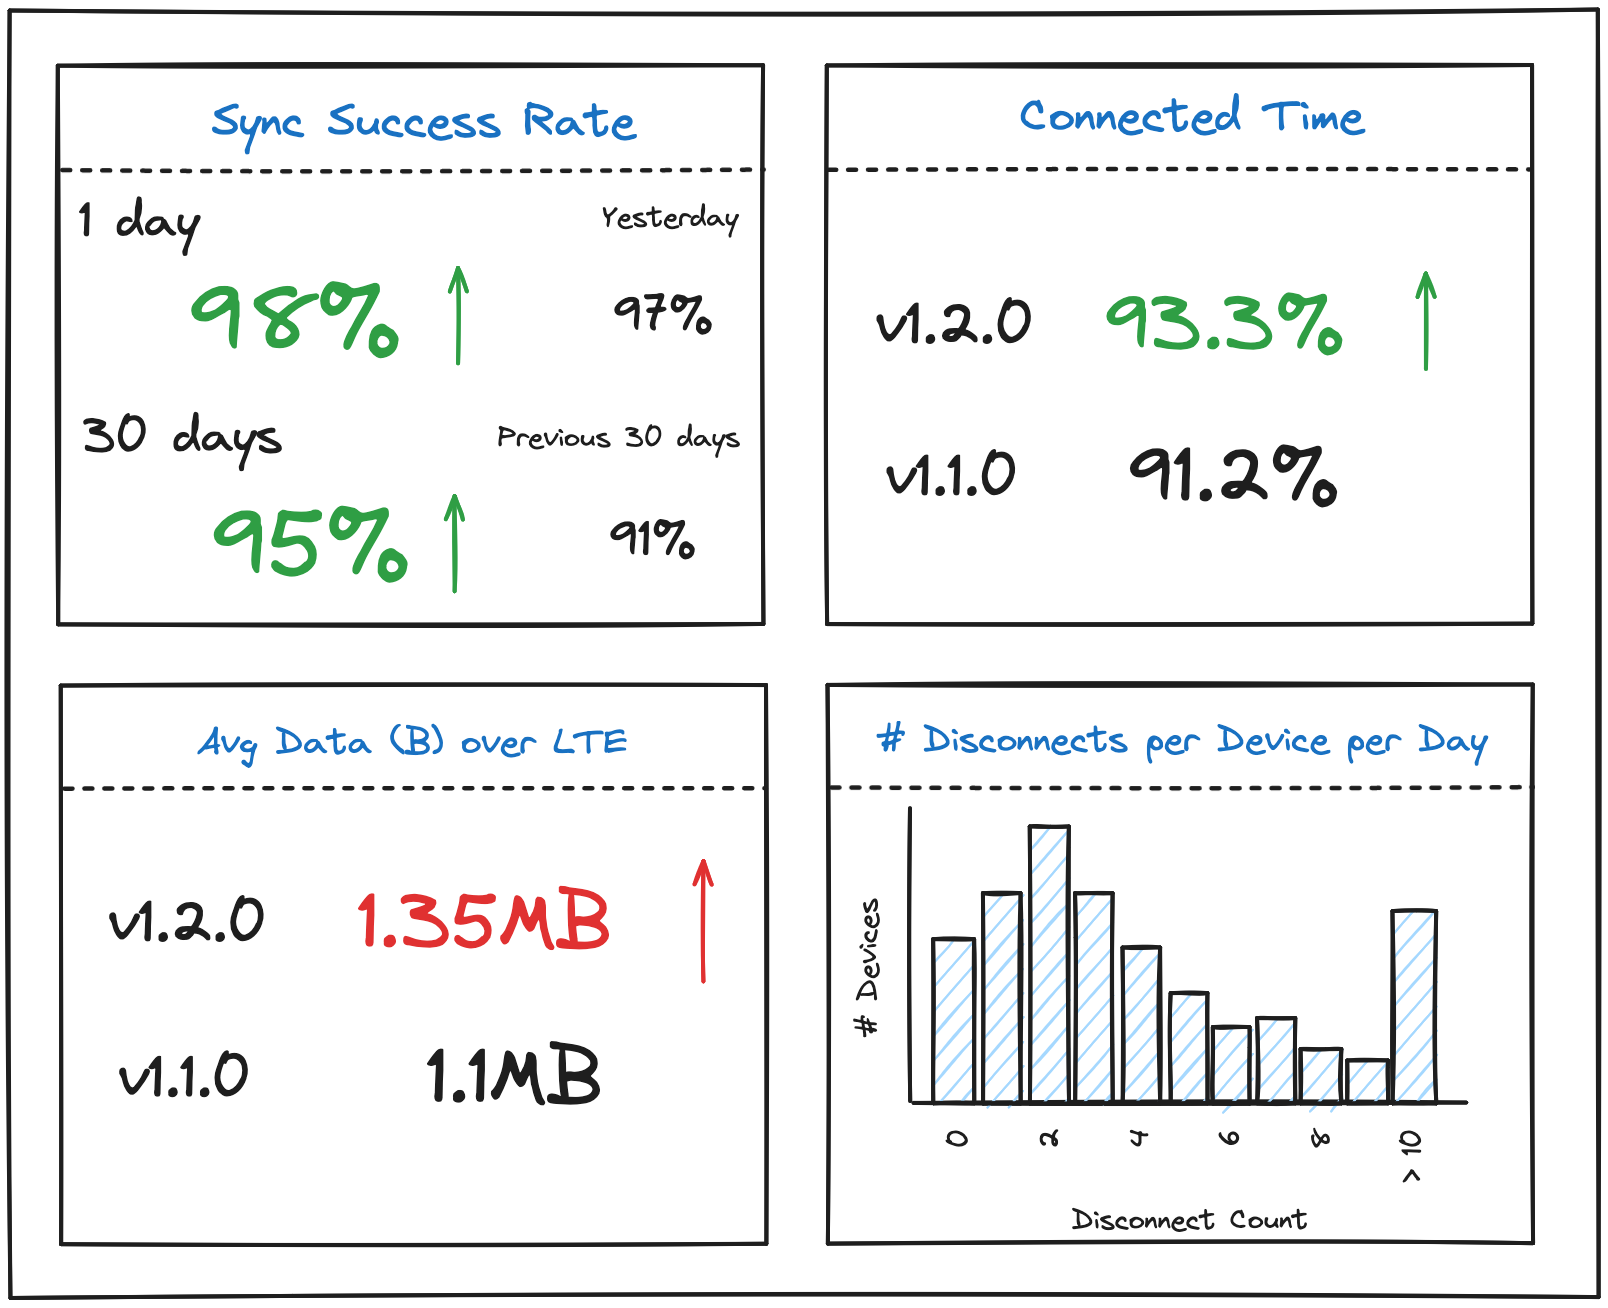
All of these are complex and challenging problems. I learned so much solving these problems, but I was terrified when a new one would pop up. It was a ton of effort each time, and it took far too long for us to get an initial monitoring component in place. I dreamed of a dashboard like this:
Techniques for Monitoring and Debugging Connectivity
Fear not! You do not have to enter this world blind. We have several tools at our disposal to tackle issues. As with any monitoring/debugging toolkit, each method complements the others. As problems pop up, it’s best to use a mix of these techniques and find what works best for your team and device. The three we’ll cover are:
- Logging
- Protocol Analyzers
- Metrics
Metrics will bring the most utility and insight as your fleet grows. Other techniques can suffice for single or small-group investigations to help solve specific problems. With metrics, you can easily measure changes from version to version or within subgroups of your fleet. You cannot do this for every device as your fleet grows. Save your sanity and start using metrics early!
Let’s start by looking at logging.
Logging
Logging is a foundational tool for understanding the behavior of embedded devices’ connectivity. Logs summarize what transpires within the connectivity stack by capturing key events and status updates. The following example is from an ESP32S3 connecting to my home wifi network:
I (454) mflt: Data poster task up and running every 60s.
I (494) pp: pp rom version: e7ae62f
I (504) net80211: net80211 rom version: e7ae62f
I (514) wifi:wifi driver task: 3fcb4c08, prio:23, stack:6656, core=0
I (524) wifi:wifi firmware version: 9aad399
I (524) wifi:wifi certification version: v7.0
...
I (554) wifi:Init dynamic tx buffer num: 32
I (554) wifi:Init static tx FG buffer num: 2
I (554) wifi:Init static rx buffer size: 1600
I (554) wifi:Init static rx buffer num: 10
I (564) wifi:Init dynamic rx buffer num: 32
...
I (584) wifi_init: tcp tx win: 5744
I (594) wifi_init: tcp rx win: 5744
I (594) wifi_init: tcp mss: 1440
...
I (614) phy_init: phy_version 601,fe52df4,May 10 2023,17:26:54
This first group provides information on the initialization and configuration of the WiFi stack. We get information on what version each component is running, the configurations selected, and memory and kernel object information. The version info is excellent for matching behavior to any known issues. The memory reservation and kernel object counts are especially useful when attempting to profile and understand the stack’s memory usage.
I (654) wifi:mode : sta (60:55:f9:f5:2a:d0)
I (664) wifi:enable tsf
I (674) wifi:new:<7,0>, old:<1,0>, ap:<255,255>, sta:<7,0>, prof:1
I (674) wifi:state: init -> auth (b0)
esp32> I (5024) wifi:state: auth -> init (200)
I (5024) wifi:new:<7,0>, old:<7,0>, ap:<255,255>, sta:<7,0>, prof:1
I (7474) wifi:new:<7,0>, old:<7,0>, ap:<255,255>, sta:<7,0>, prof:1
I (7474) wifi:state: init -> auth (b0)
I (8134) wifi:state: auth -> assoc (0)
I (8134) wifi:state: assoc -> run (10)
I (8154) wifi:connected with <my_network>, aid = 9, channel 7, BW20, bssid = <my_routers_mac_addr>
Next, the device proceeds and connects with a local WiFi router.
I (8154) wifi:security: WPA3-SAE, phy: bgn, rssi: -49
I (8164) wifi:pm start, type: 1

...
I (9174) wifi station: got ip:192.168.50.235
I (9174) wifi station: connected to ap SSID:<my_network>
I (9874) mflt: Result: 0
I (9874) mflt: Checking for OTA Update
I (10494) mflt: Up to date!
Finally, we see the device complete the connection, obtain an IP address, successfully post Memfault data, and check for updates. The collected logs are great for following along with a device; we know the approximate steps and sequence taken during the session.
Strengths:
- Easy to implement
- Human readable
- Easy to trace what happened
Best Used For:
- Small numbers of devices
- Additional context when events happen
- Local development
However, logs have many shortcomings, especially when your fleet grows beyond the “co-workers as beta testers” stage. Relying solely on logging will consume valuable time because searching through logs for each device is tedious, brittle, and slow. The Ghost of Engineer’s Past will find and haunt you… in addition to the 50 tickets whose attached logs you have yet to sift through. Check out this post on logging and heartbeat metrics for more info! We’ll get to metrics later in this post.
If you are planning on logging extensively in production, do consider using a compact logging system such as the one built into Zephyr, TRICE, or Memfault’s compact logs.
Capturing Packets With Protocol Analyzers
Protocol analyzers offer a more sophisticated approach to connectivity monitoring, enabling developers to delve deeper into the intricacies of communication protocols. These tools provide detailed insights into packet structure, message sequences, and protocol validation, but often require dedicated hardware. Check their capabilities and software compatibility against what you need and are willing to spend; you would be surprised how often only older versions of Windows are supported (always keep a laptop running Windows XP in the office). For 90% of us, some excellent free software and affordable hardware will suffice.
With regards to software, I absolutely must recommend Wireshark. Wireshark is an incredibly powerful tool that captures and analyzes WiFi + networking protocols (IP, TCP, UDP, MQTT, etc), USB, and even BLE. This tool has saved me tons of effort and helped me numerous times. I’ve used Wireshark to find a bug in a BLE stack, profile MQTT connections, and improve my USB throughput, to name a few instances. It’s insane that it’s free, and I’d pay (practically) any price they offered. Here’s an example of a capture I collected to find a problem in my BLE stack:
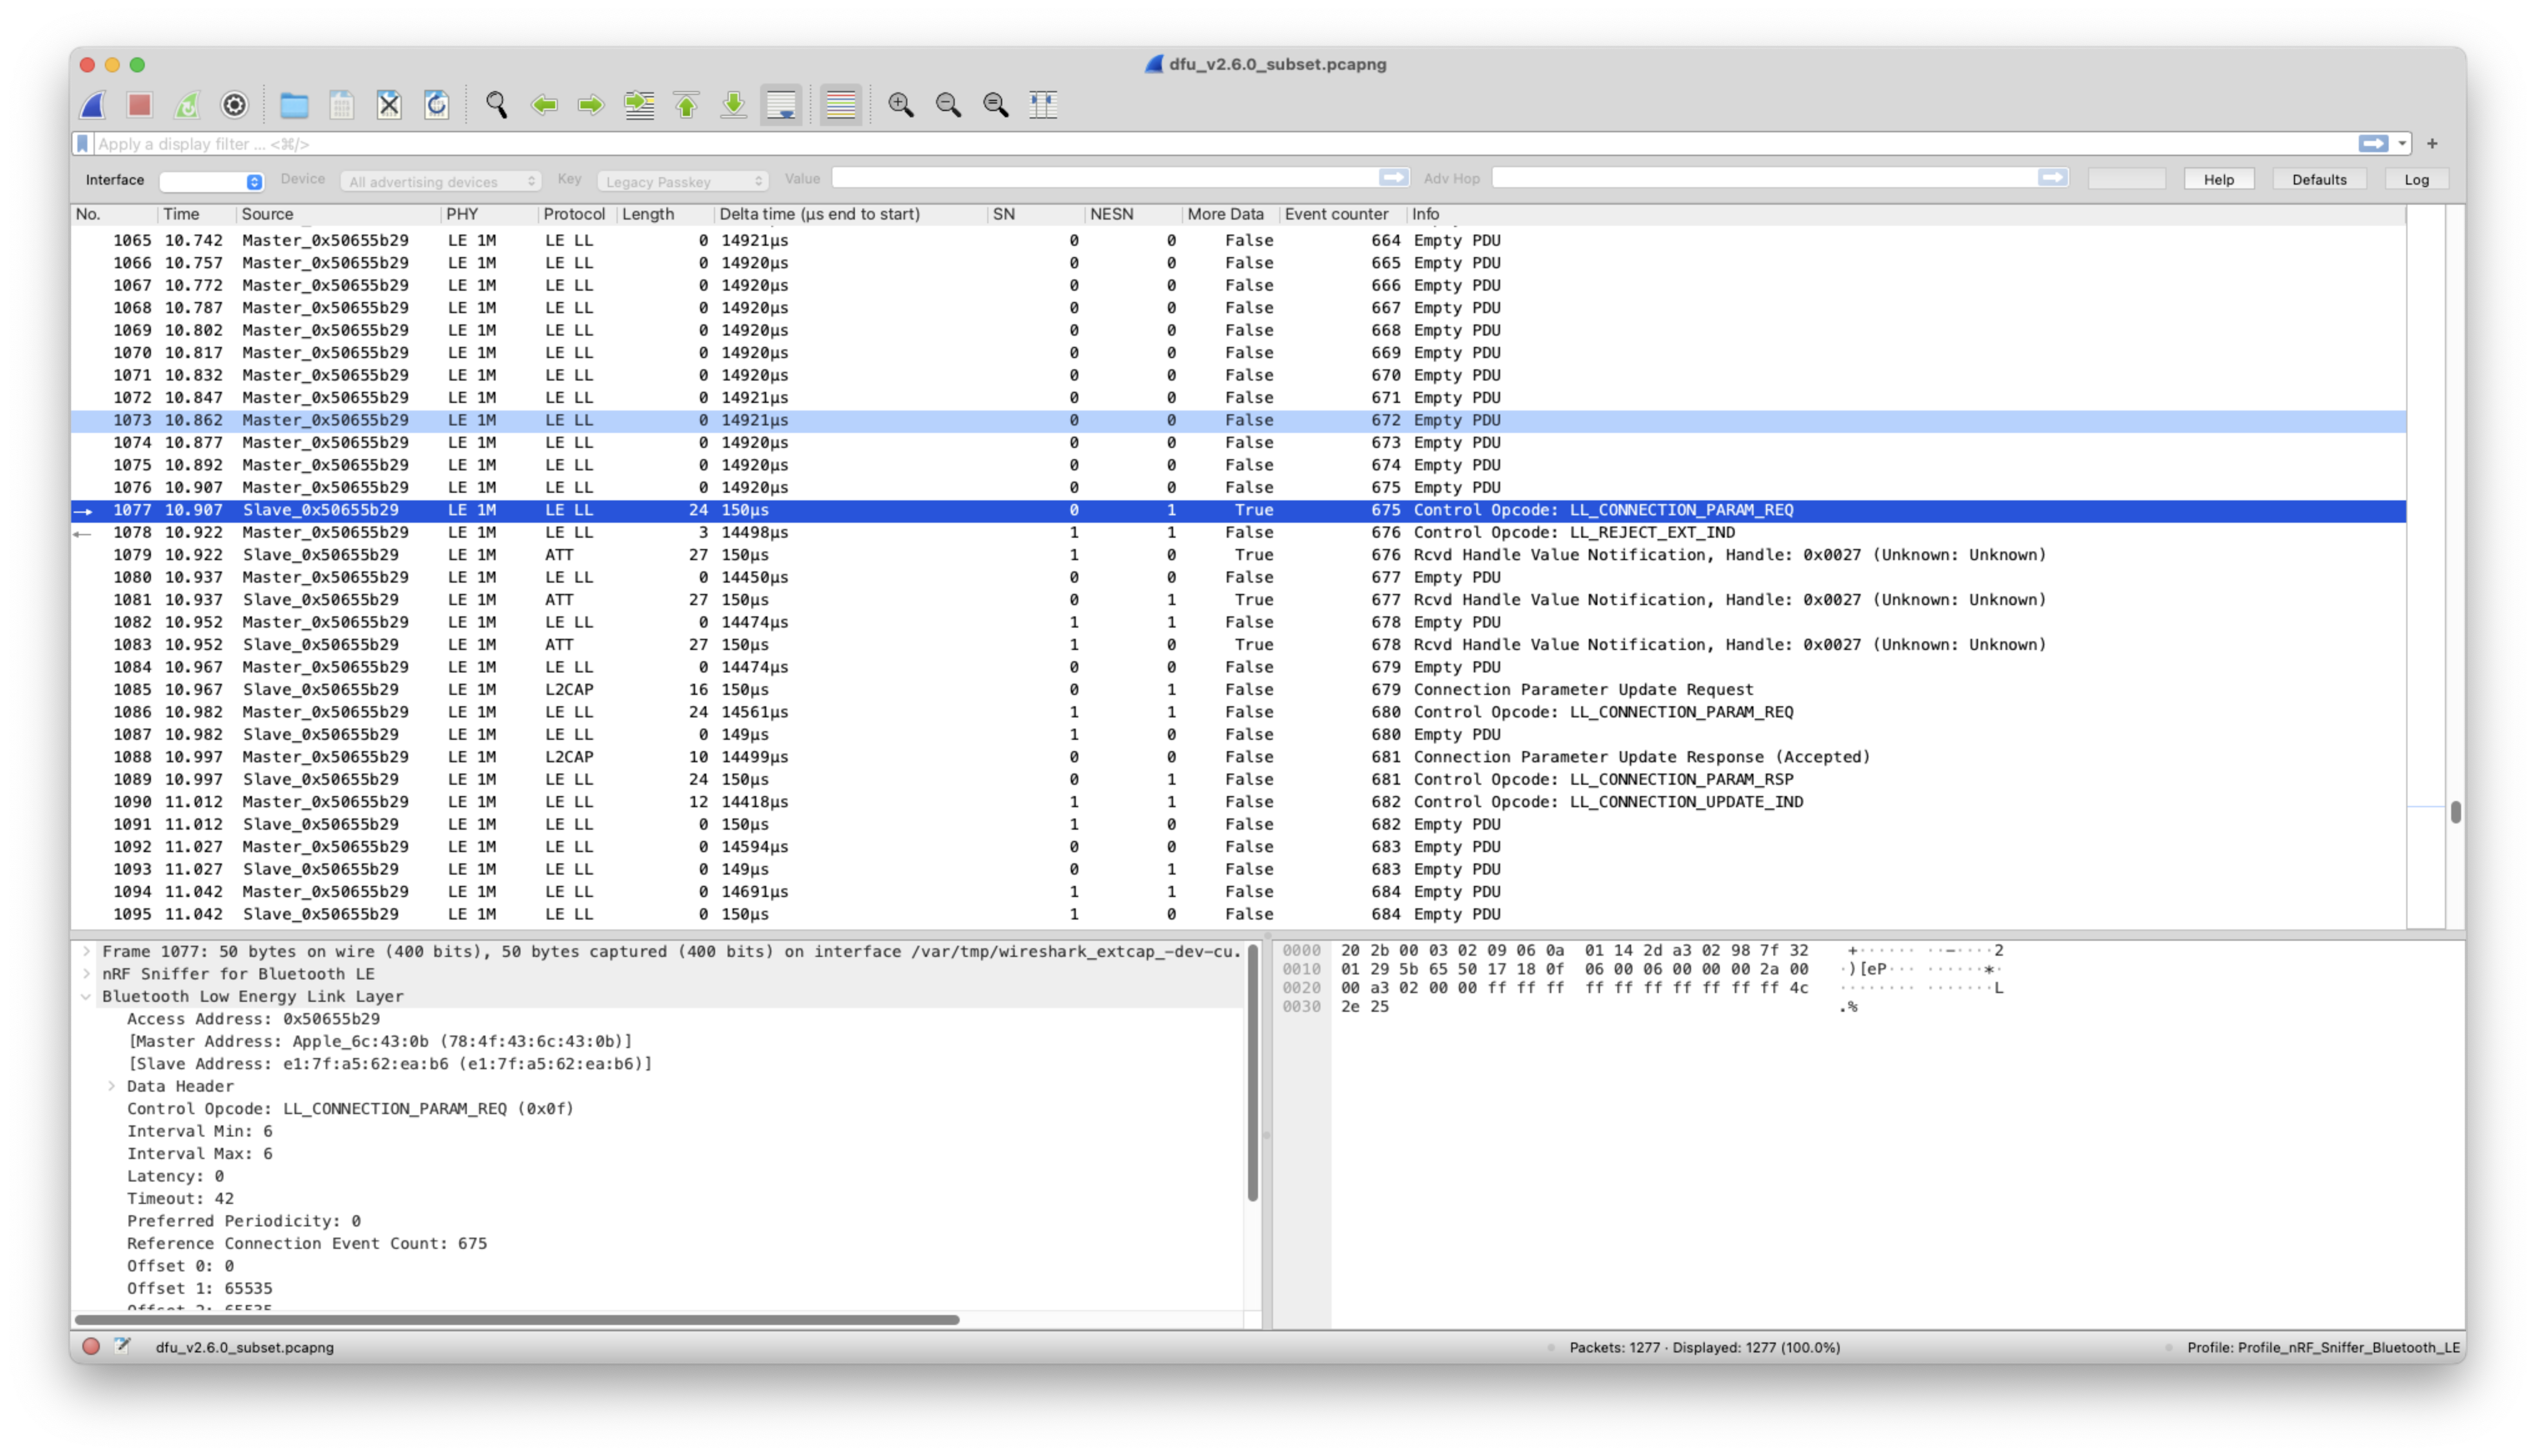
For this problem, I observed lower throughput than expected during data transfer. Logs showed that the connection parameters were set correctly initially, but the data rate did not match this. Inspecting the capture in Wireshark led me to discover that two different connection parameter update methods in the BLE stack clobbered values set by the other, resulting in decreased throughput.
Depending on the protocol, you may not need additional hardware. Wireshark can use your WiFi interface’s monitor or promiscuous mode to capture any signals in the air. It can also hook into your local Ethernet and USB interfaces for packet capture.
For BLE sniffing hardware, I reach for my closest Nordic Semiconductor nRF52 dev kit! Nordic offers a fantastic BLE Sniffer software package that includes plugins for Wireshark. It’s amazing - check it out!
Strengths:
- Incredibly detailed analysis of packets on the wire/over the air
- Great for investigating specific protocol issues
Best Used For:
- Single devices
- Local debugging/investigation
- Protocol errors and profiling specific devices
Use protocol analyzers when you need extreme detail for a single device at your bench or desk. These tools will not help in the field unless you’re present. They should rarely be used because packet captures are very large and process-intense. Packet captures focus on a single device and can’t be used to aggregate across a growing fleet.
Metrics
The best tool for gathering connectivity insights is metrics. Collecting data using counters, timers, and gauge metrics allows you to measure various aspects of connectivity performance, such as packet loss rates, latency, and throughput across your fleet. We have a previous post detailing how to implement heartbeat metrics or check out the Memfault SDK for our specific implementation.
What makes metrics so powerful is using them at any level of detail for your fleet. Use metrics for an individual device for views into operation. Pair this with logs for additional context on the metric values gathered. This zoomed-in view is excellent, especially for correlating with other events, for instance, fault handling or reboots!
The superpower of metrics is aggregating values for your fleet. None of the other tools discussed can combine in this fashion to inform about your fleet’s connectivity. Simple operations like sums and averages yield insights into message failure rates, connection uptime, throughput, etc. Additionally, we can compare different software versions in our fleet since we have these aggregates. This lets us quickly determine that the new stack version does not impact the time to connect or that a different connection parameter doesn’t degrade throughput. We can look to a single measure to judge if our connectivity is better or worse.
Let’s take a look at some examples of collected metrics. Here’s a zoomed-in look at a single device:
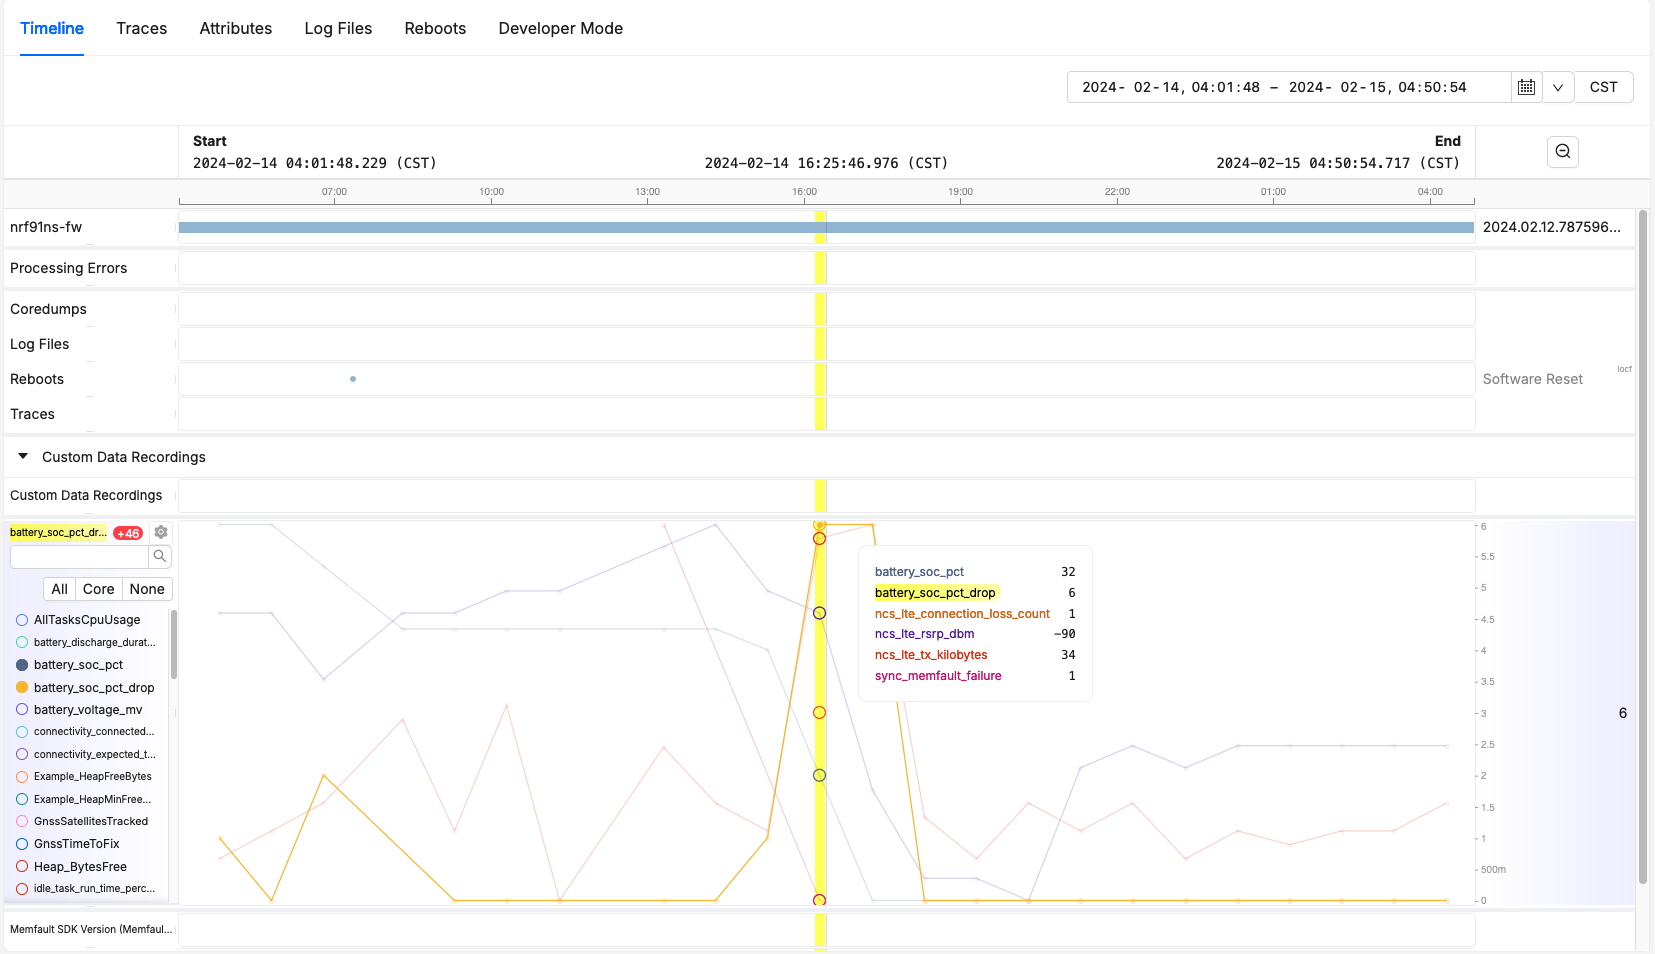
We can see that our device had a failure to send Memfault data while operating. This happened at the same time that our LTE connection lost count increment, and we can see that our RSRP is also starting to drop. The likely cause here is a poor signal causing this sync failure. Since we’re also measuring other metrics, we can see this caused quite a significant battery drop; we lost 6% in that hour!
Taking a look at our fleet, we can check out how our latest release is performing:
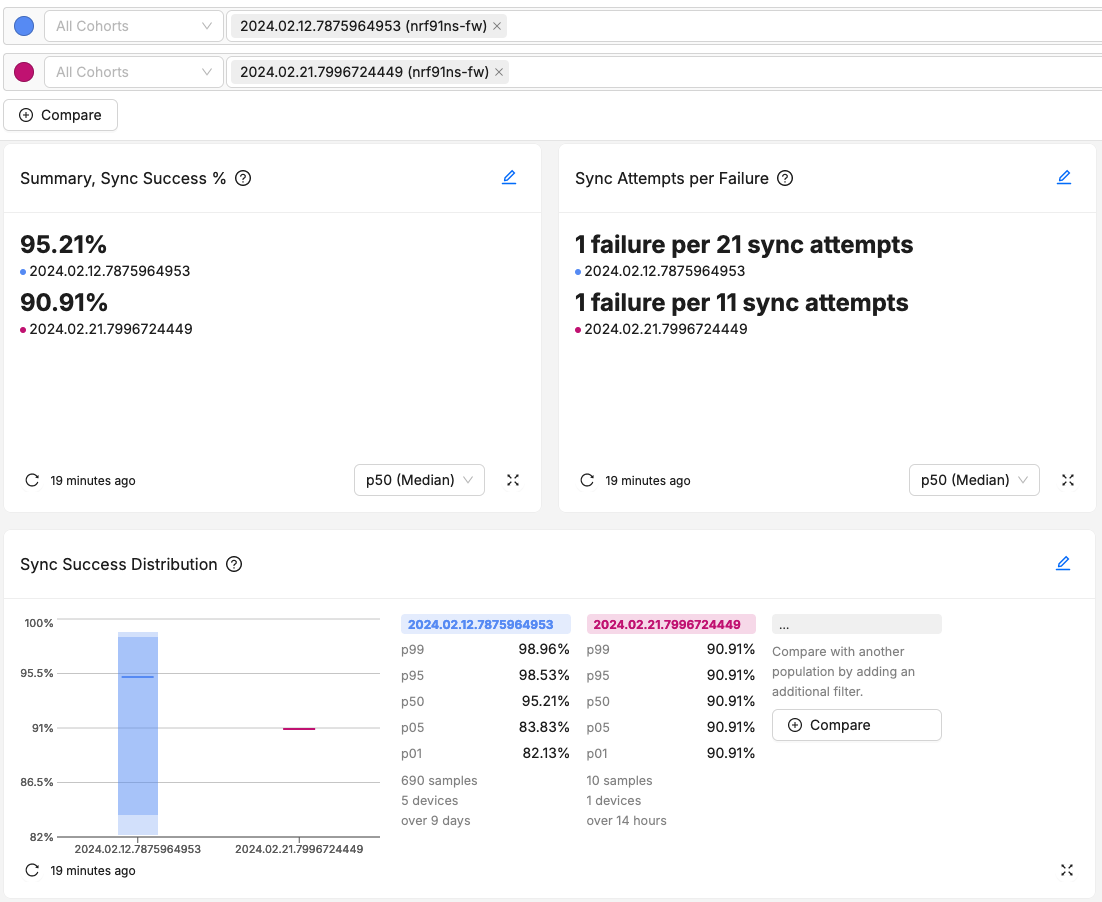
This screenshot has 3 charts built around sync success and sync failure metrics. Overall, our latest firmware version from 2024/02/21 performs worse on average than our previous version from 2024/02/14. The variation across the fleet for sync success shrunk quite a bit, likely due to the lower sample count for the latest version. Thanks to adding a metrics system on our device and a bit of data analysis on our backend, we know all of this. This is a massive improvement over what the other methods covered can do.
In short, use metrics for everything from individual device investigations to signing off on release readiness. There’s nothing better than confidently saying, “Version x is better than version y, send it!” and have assurance you’ve delivered a great new update to your entire fleet. Even if you do introduce a problem, metrics help spot regressions quickly!
Strengths:
- Efficient. Most implementations generate data points on the order of bytes.
- Simple. A simple integer to record the value of a metric and a storage structure to buffer data will suffice.
- Aggregate-friendly. It’s easy to apply aggregate functions to a metric across your devices.
Best Used For:
- Monitoring and alerting
- Entire fleets or individual devices
- Characterizing the overall performance and state of fleet connectivity
Connectivity Metrics In Practice
Once you’ve added an existing metrics implementation or created your own, the next step is figuring out how to instrument your connectivity stack. Some of the best examples apply to many different connectivity setups. To help generalize these metrics for any connectivity type, I will use the word connection to mean a data channel established between the downstream device and the upstream gateway or backend. Let’s get into some examples!
Sync Success and Connected Time
The first two metrics I’ll outline are sync success and connected time. These two metrics provide a high-level signal of how connectivity is operating overall. Sync success is aimed at devices that connect periodically, while connected time is best suited to always-on connections.
Sync Success
With a periodic connection, we want to measure each attempt to send/receive data. Each time we attempt to transmit data, we count either a success or failure. Again, instead of using the absolute counts, let’s take a ratio of success to the total sync attempts (whether successful or not):

This metric can also be used for always-on connections to determine if data can reach its destination. For periodic connections, though, this is the best summary metric.
Connected Time
Just like we can measure device stability with crash-free hours, we should measure our connectivity with a similar metric: connected time. This is best suited for devices that have an always-on or continuous connection. Instead of an absolute connected time in seconds, we’ll take a ratio between the time we expected to be connected and the actual time we were connected.
This allows an understanding of how frequently these intermittent connections are succeeding or not. Since we are using a relative measurement, we can easily compare this across different aspects of our fleet without considering the equivalent number of samples.

Connected time demonstrates how well our devices can maintain their always-on connection. This metric can also be used when a device enters a state where it knows the connection should be maintained throughout.
To compliment connected time, I also track the number of connectivity disconnections, since they often directly impact the device experience.
Measuring Time in Connectivity States
Many protocols have different states that devices will transition into and out of during operation. BLE devices start by broadcasting an advertisement packet1 that a phone or gateway would scan to connect and transfer data with the device. Many IP connections will require a device to obtain a lease on an address when it joins the network. Understanding the time spent in different connection states for LTE devices can drastically impact battery life (read our LTE post for more info). To instrument these scenarios, we use a timer metric to measure how long the device spent in a particular state and take the average time to transition into and out of the state.
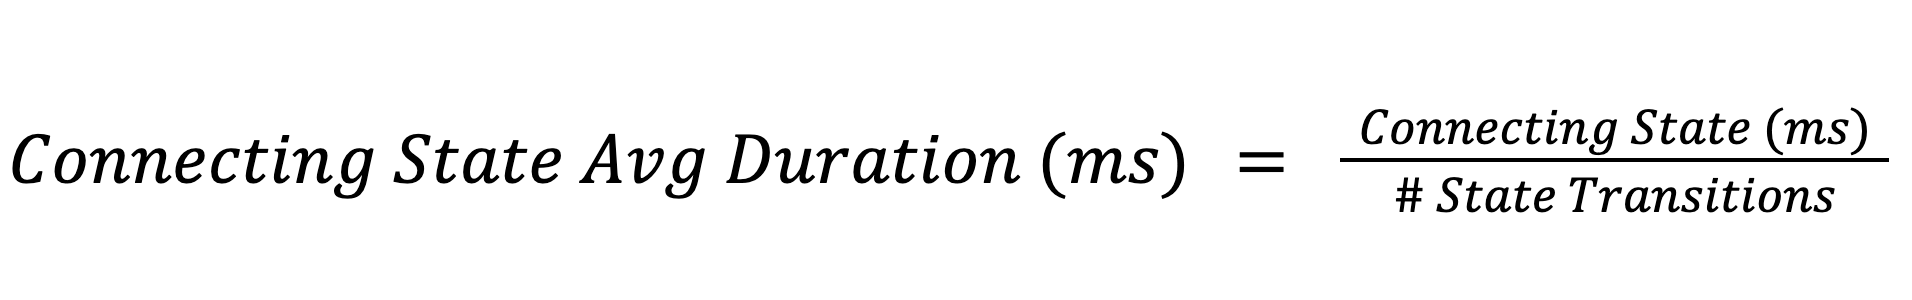
Using the average, we can easily observe changes in this value across all our devices. We can quickly identify if tweaking a connection parameter affected device behavior.
Some of the most critical states to measure are connection-forming states. These are states of a connectivity state machine that must occur because a full connection is made, and they must be completed before a device can start sending or receiving data. Measure these durations and track them over time - if they increase, your users will notice!
A few of the most common connection-forming states are:
- BLE: Total time between starting advertising to the connection established or bond formed
- LTE: Total time between idle and connected state
- WiFi: Total time to associate and obtain an IP address
Throughput
We need a good sense of how much data is sent between our device and the backend to create metrics for bytes sent and received. The key is deciding which specific point in our connectivity stack to set these two metrics. We want to be at the lowest layer available to your application and, ideally, at a single point to record bytes sent and a single point to record bytes received. Lower-level instrumentation will give us the most accurate count for these metrics, and locating our metrics updates at the points that bytes are sent/received keeps the instrumentation code to a minimum. Use simple counters to update based on the number of bytes sent and received. With a metric for sent and received data, we can easily calculate a throughput with a timer measuring the metric heartbeat period:
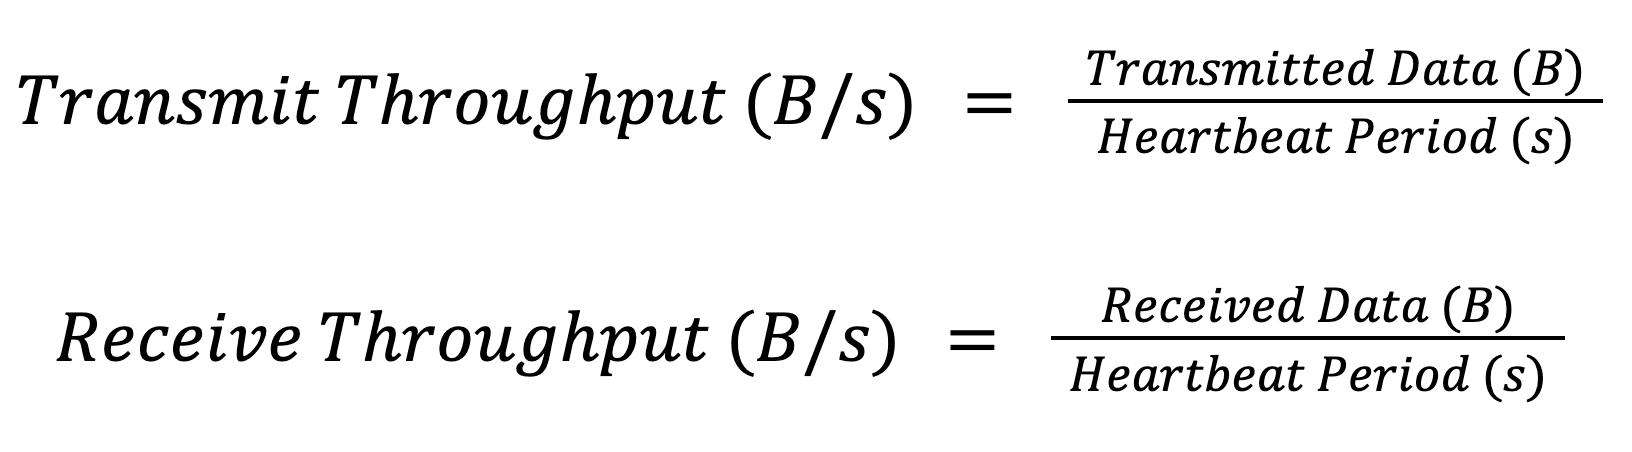
Measuring both received and transmitted bytes is essential, as your connectivity channel may not be symmetric in both directions.
Device Attributes - A Supplement To Your Tools
At Memfault, we call the key-values attached to a device “Device Attributes”. Simply put, they are strings or numbers associated with a device that change frequently or not at all. They can be used to supplement logging, metrics, and protocol traces, and they provide more context as to what is unique about the device.
Some examples of attributes are component vendors, modem firmware versions, gateway/phone OS versions, or geography identifiers. An attribute could help identify a particular battery provider between devices that frequently lose connection due to out-of-spec power output.
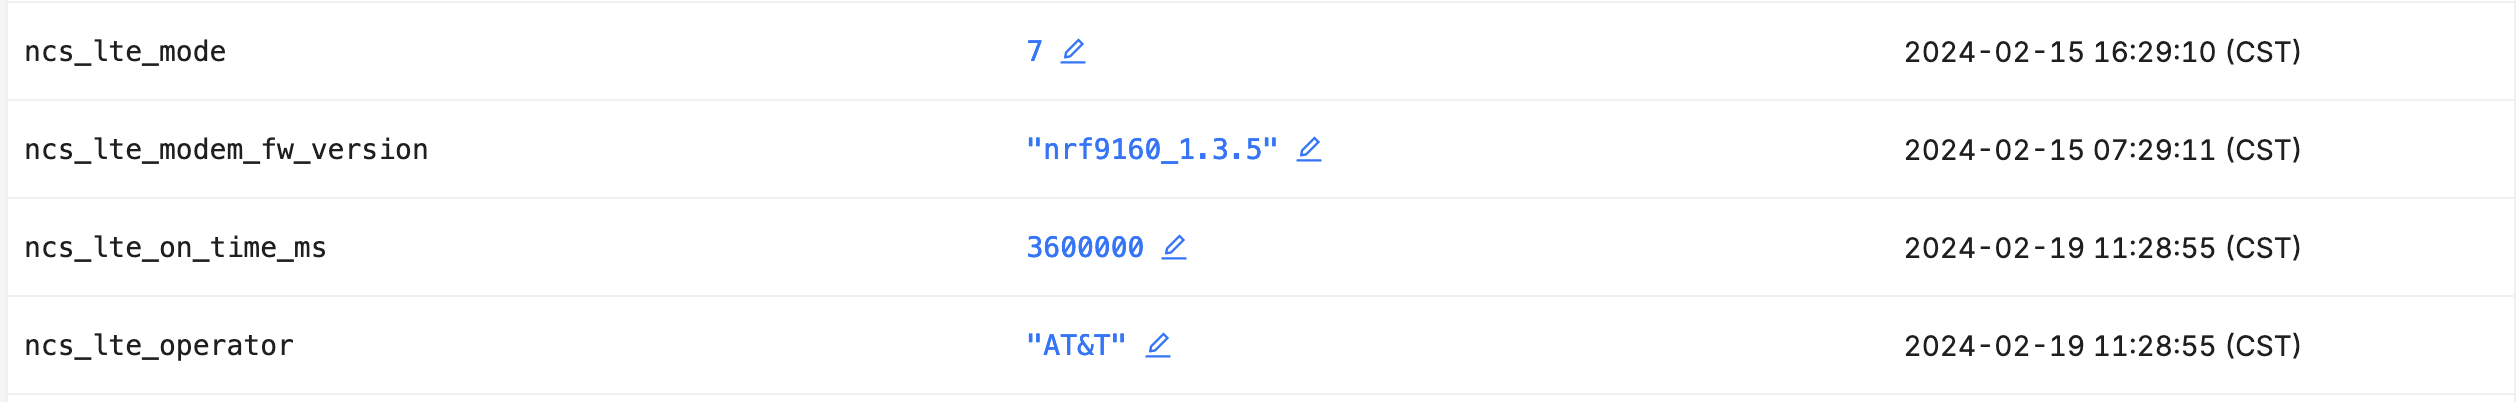
In the screenshot above, I’ve collected attributes for a Nordic Thingy:91 related to its modem version and network. If I see several devices with similar attributes later, this may help me understand the root cause of the issue.
Conclusion
A robust monitoring and debugging system for connectivity requires several different tools. Use logging for local debugging and context for what the device was doing. Use detailed protocol traces for specific and low-level problems. Use granular and aggregated metrics to monitor and observe device or fleet trends, and when there are thousands or millions of devices in production. When combining these with attributes to identify and categorize devices, the fun nightmares of connectivity become less scary and turn into sweet dreams.
See anything you'd like to change? Submit a pull request or open an issue on our GitHub
References
 Eric Johnson is a Firmware Solutions Engineer at Memfault. Eric previously worked on embedded software teams at Walgreens Health and Athos