Tracing & Logging with the `TRICE` Library (Interrupts too!)
If you develop software for an embedded system, you need some kind of system feedback. Debuggers are awesome tools, but when it comes to analyzing dynamic behavior in the field, they cannot be used.
For remote debugging, many engineers turn to printf, which can usually be quickly put in place after having a putchar() implemented. This turns out to be an expensive way, in terms of processor clocks and required FLASH memory for the strings.
If you’re using a bigger microcontroller, you might have tracing hardware like an ETM. but it requires expensive tools and a direct connection, so it can not be used to debug in-field issues.
Unhappy with this situation, you might start building clever solutions to do in-field debugging, such as using digital pins, streaming byte sequences of tracing data, or even emitting some proprietary LED blinking codes, all of which would be difficult to build and interpret.
Embedded engineers need something as easy to use as printf, usable within interrupts, small enough for today’s MCU’s, and have minimal performance impact when running. The Trice technique tries to fill this gap. It is the result of a long-year dissatisfaction and several attempts to find a loophole to make embedded programming more fun and effective.
Brief Description of Trice
Trice is a small, performant software tracer and logger and consists of these parts
- trice.c contains the less than 1KB runtime code, which uses triceConfig.h as setup.
-
trice.h containing a C language macro
TRICE, generating tiny code for getting real-timeprintfcomfort at “speed-of-light” for any microcontroller.
Example:float x = 3.14159265/4; TRICE( Id(12345), "info:π/4 is %f with the bit pattern %032b\n", aFloat(x), x ); - PC tool trice, executable on all Go platforms.

Table of Contents
- Brief Description of Trice
- The History of Trice
- How It Works
-
Trice features
- Open source
- Easy-to-use
- Small Size - using Trice frees FLASH memory
- Performance
- Robustness with COBS Encoding
- Just Like
printfbut Better - Labels, Colors, and Logging Levels
- Compile-time Disabling of
TRICEMacros on File Level - Target and Host Timestamps
- Target Source Code Location
- Multiple Target Devices in One Log Stream
- Any byte capable 1-wire connection usable
- Scalability
- Portability and Modularity
- Optional Trice Message Encryption
- Final Words
- Potentially Interesting Links
The History of Trice
Developing firmware means dealing with interrupts and timing. How do you check if an interrupt occurred? You might increment a counter and display it in a background loop with some printf-like function. What about time measurement? Set a digital output to 1 and 0 and connect a measurement device like an oscilloscope or Saleae.
I once was developing software for a real-time image processing device, and I had to hunt down what was causing a regression in processing time. A spare analog output with a video interrupt-synced oscilloscope gave me the needed information after I changed the analog output on several points in my algorithm. But this isn’t ideal. I just want to deal with my programming tasks and not worry about connecting wires and extra instruments.
printf is so cool on a PC, but an embedded device often cannot use it for performance reasons. And thus began the quest to build something better.
My very first attempt was writing the format string .const offset together with its values in a FIFO during a log statement and to do the printf in the background. Unfortunately, this is compiler specific. I modified it to use the full string address instead of the offset, but that needed more buffer space. Zephyr, for example, does something like this and calls it “deferred logging”.
Then, one day I had the idea to compute short checksums of the format strings in a pre-compile step and to use them as IDs in a list together with the format strings. That was a step forward but then I needed to write a supporting PC program to decode the information. I did that in C++ in an attempt to get something functional quickly, but I hated it, as I dislike C++ now because of all its nuts and bolts, not to mention the missing libraries issues when running it on a different PC. There was also the problem of conflicting generated short checksums. There was a way around it, but ID-based message filtering will never be possible with this issue.
The need became clear for controllable IDs and management options. I chose to implement the new solution using Go as it was an as-fast-as-C language, easy to learn, promising high programming efficiency and portability. It would be interesting to try it out on a real PC project. This is the origin story of Trice.
Trice grew, and as it got more usable, I decided to make it Open Source as a “Thank You” to the community.

Trice is also a baby girl’s name, and our daughter designed the logo. The girl’s pen symbolizes the
TRICEmacro for recording and the eyeglasses represent the PC tool trice for visualizing the logs.
How It Works
Trice performs zero costly printf-like functions on the target at all. The TRICE macro, instead, just copies an ID together with the optional values to a buffer. In the minimum case, this can happen in 6-8 processor clocks even with target timestamps included. When running on a 64 MHz clock, light can travel about 30 meters in that time.
To achieve this, an automatic pre-compile step is triggered by executing a trice update command on the PC. The trice tool then parses the source tree for macros like TRICE( "msg: %d Kelvin\n", k ); and patches them to TRICE( Id(12345), "msg: %d Kelvin\n", k );, where 12345 is a generated 16-bit identifier copied into a Trice ID List. During compilation than, the TRICE macro is translated to the 12345 ID and the optional parameter values. The format string is ignored by the compiler.
The target code is project-specific and can be configured by modifying this header file. In immediate mode, the stack is used as the Trice buffer and the TRICE macro execution includes the quick COBS encoding and the data transfer. This more straightforward, but slower architecture, can be interesting for many cases because it is anyway much faster than printf-like functions calls. In deferred mode, a service swaps the Trice double buffer periodically, encodes it according to COBS, and the background transfer is triggered.
During runtime, the PC trice tool receives everything that happened in the last ~100ms as a COBS packet from the UART port. The 0x30 0x39 is the ID 12345 and a map lookup delivers the format string msg: %d Kelvin\n and also the bit width information. Now the trice tool can write the target timestamp, set the message color, and execute printf("%d Kelvin\n", 0x0000000e);

The trice tool runs in the background allowing the developer to focus on programming tasks. Once an ID is generated from a string, it keeps the same ID unless the Trice is changed. If for example the format string gets changed into "msg: %d Celsius\n", a new ID is inserted automatically and the reference list gets extended. Obsolete IDs are kept inside the Trice ID List (til.json) for compatibility with older firmware versions. It could be possible when merging code, an ID is used twice for different format strings. In that case, the ID inside the reference list wins and the additional source gets patched with a new ID. This may be unwanted, but patching is avoidable with proper ID management. The reference list should be kept under source code control.
Trice features
This last section of the article is digging deeper into the parts of Trice which I believe developers will care most about when it comes to instrumenting embedded software.
Open source
Target code and PC tool are open source. The MIT license gives full usage freedom. Users are invited to support further Trice development.
Easy-to-use
Making it facile for a user to use Trice was the driving point just to have one trice tool and an additional source file with a project-specific simple to use triceConfig.h and to get away with the one macro TRICE for most situations. Trice understands itself as a silent helper in the background to give the developer more focus on its real task. If, for example, trice log is running and you re-flash the target, there is no need to restart the trice tool. When til.json was updated in a pre-build step, the trice tool automatically reloads the new data during logging.
The trice tool comes with many command-line switches (trice help -all) for tailoring various needs, but mostly these are not needed. Usually, only type trice l -p COMn for logging with a 115200 bit/s baud rate.
Small Size - using Trice frees FLASH memory
Compared to a printf-library code which occupies 1 to over 20 KB FLASH memory, the Trice code is really small - less 1 KB will do already but provide full support.
Performance
Can it get faster? Only 3 runtime assembly instructions per Trice are needed in the minimal case! It will require more processor cycles to add timestamps and addresses, disable and enable interrupts, and increment cycle counters, but a Trice call is still incredibly fast.
Robustness with COBS Encoding
When a Trice data stream is interrupted, the COBS encoding allows an immediate re-sync with the next COBS package delimiter byte and a default Trice cycle counter gives a high chance to detect lost Trice messages.
Before COBS was ultimately chosen, several encodings were evaluated. A bonus of using COBS is the trice tool can include different decoders if necessary since COBS can handle multiple concurrent data streams.
Just Like printf but Better
Trice is usable inside interrupts and additional format specifier support gives options like binary or boolean outputs. Transmitting runtime generated strings could be a need, so a TRICE_S macro exists supporting the %s format specifier for strings up to 1000 bytes long. It is possible to log float/double numbers using %f and the like, but the numbers need to be wrapped with the function aFloat(x) or aDouble(y). UTF-8 encoded strings are implicitly supported if you use UTF-8 for the source code.

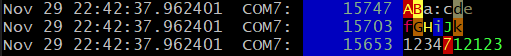
Labels, Colors, and Logging Levels
You can label each Trice with a channel specifier to colorize the output. This is free of any runtime costs because the channel strings are part of the log format strings, which are not compiled into the target. The trice tool will strip full lowercase channel descriptors from the format string after setting the appropriate color, making it possible to give each letter its color.
Loggers use log levels and offer a setting like “log everything above INFO” for example. The Trice channels implement this but can do better: Inside emitter.ColorChannels, all common log levels defined as Trice channels can coexist with user-defined channels. The user can adjust this. The trice tool has the -pick and -ban switches to control the display in detail. Also a -logLevel switch can be used to set a display threshold as channel position inside ColorChannels.
If a target-side log level control is needed, a trice tool extension could each of these log level channels assign an ID range and a target-side log threshold can control which IDs are transmitted. No need to implement that right now, because the runtime and bandwidth costs are so small for each Trice and a back control path is needed which is better designed by the user. Also, the IDManagement would get more complex.
Compile-time Disabling of TRICE Macros on File Level
After debugging code in a file, there is no need to remove or comment out TRICE macros. Write a #define TRICE_OFF just before the #include "trice.h" line and all TRICE macros in this file are ignored completely by the compiler, but not by the trice tool. In the case of re-constructing the Trice ID List, these no code generating macros are regarded.
//#define TRICE_OFF // uncomment this line to disable trice code generation in this file
#include "trice.h"
Target and Host Timestamps
Enable target timestamps with a variable you want inside triceConfig.h. This adds a 32-bit value to each Trice sequence, which can track the system clock, a millisecond timer, or another event counter. The trice tool will automatically recognize and display them in a default mode you can control. If several TRICE macros form a single line, the trice tool only displays the target timestamp of the first TRICE macro.
Embedded devices often lack a real-time clock and in some scenarios can have uptimes of weeks. Therefore the trice tool precedes each Trice line with a PC timestamp, if not disabled. This is the Trice received timestamp on the PC, which can be some milliseconds later than the target’s event timestamp.
Target Source Code Location
Some developers like to see the filename.c and line in front of each log line for quick source location. Enable this within triceConfig.h. This adds a 32-bit value to the Trice sequence containing a 16-bit file ID and a 16-bit line number. The Trice tool will automatically insert #define TRICE_FILE Id(nnnnn) with a generated file ID, and that’s it!
Multiple Target Devices in One Log Stream
Several trice tool instances can run in parallel or on different PCs. Each trice tool instance receives Trices from an embedded device. Instead of displaying the log lines, the trice tool instances can transmit them over TCP/IP (trice l -p COMx -ds) to a trice tool instance acting as a display server (trice ds). The display server can interleave these log lines in one output. For each embedded device a separate Trice line prefix and suffix is definable. This allows comparable time measurements in distributed systems. BTW: The Trice message integration could also be done directly with the COBS packets.
Any byte capable 1-wire connection usable
The usual Trice output device is a UART but also SEGGER-RTT is supported over J-Link or ST-Link devices. Many microcontroller boards can act as a Trice bridge to a serial port from any port (example).
Scalability
The various Trice ID management features allow the organization also of bigger software systems. More than 65000 possible different IDs should match also large projects. Just in case: 16-bit for the ID is a not too hard changeable value.
Portability and Modularity
The trice tool is written in the open source language Go and is therefore usable on many platforms. That means almost anyone can easily and automatically perform code patching and ID handling with trice update.
All C-compilers should be able to compile the target Trice code and there is no hardware dependency despite the byte transmission. MCUs with 8-bit to 64-bit, little or big-endian are supported.
Any user program able to read a JSON file can receive the documented Trice message format, look up the ID, and perform a printf-like action to translate into log strings. The trice tool with its log switch is a working example.
Using COBS packets starting with a package descriptor allows user protocols to pass over the same transmission line. The other way around is also possible! A developer could embed Trice messages in their own protocol.
The trice tool is expandable with several decoders, which means it is possible to implement a minimal Trice encoding, if bandwidth matters heavily and control that with switches.
When less RAM usage is more important the target double buffer is replaceable with a FIFO using a compile-time flag. Right now, an immediate mode is selectable inside triceConfig.h avoiding any buffer by paying a time toll.
The trice tool supports many command line switches.
Optional Trice Message Encryption
The encryption opportunity makes it possible to test thoroughly a binary with log output and release it without the need to change any bit but to make the log output unreadable for a not authorized person. Implemented is the lightweight XTEA, which will work for many cases. It should also be easy to add a different algorithm.
Final Words
The Trice technique is new and still under development. Additional tests and bug fixes are absolutely necessary of course, but I believe it’s in a solid place for anyone to try out and use! Feedback is welcome and appreciated.
Getting started with Trice will take only a few hours, but will pay off during further development.
Potentially Interesting Links
 Thomas Höhenleitner has developed hardware devices and moved to embedded software development.