ARM Cortex-M33 Instruction Tracing Without a Debugger
In a previous post, we talked about debugging memory corruption issues by making use of watchpoints. You may recall in that post we had to reproduce the failure so we could halt the core with a watchpoint installed in order to debug what happened.
But what if an issue is hard to reproduce or the device isn’t at your desk? In these scenarios, the execution history (instruction trace) can be invaluable for root causing the underlying issue.
In this post we will explore how to perform instruction tracing without a debugger by using the ARM Cortex-M33 Micro Trace Buffer (MTB). We will walk through a few practical examples of how to configure the MTB with Dialog Semiconductor’s DA14695 MCU.
Note: The Micro Trace Buffer (MTB) is an optional feature of the ARM architecture. Many silicon vendors do not include the feature in their MCUs. Kudos to Dialog for doing so!
Table of Contents
Basic Terminology
The Micro Trace Buffer (MTB) is a peripheral that can be used for instruction tracing. Instruction execution information is written by the MTB to a dedicated area of SRAM. This means no external pins or special debuggers are needed to view the trace history.
ARM Cortex-M33 1 and ARM Cortex-M0+2 designs may have an MTB integrated (inclusion of the feature is optional). The easiest way to find out if an MCU includes the MTB unit is to search the datasheet for mentions of “MTB”.
The MTB is not present on Cortex-M3, Cortex-M4, or Cortex-M7s. However, most Cortex-M MCUs do implement the Embedded Trace Macrocell (ETM) 3. By default, this trace information is streamed out over dedicated pins and you need special trace hardware4 to read and process the information. However, some MCUs do include an Embedded Trace Buffer (ETB) that allows trace data to be redirected to RAM instead. A full discussion of the ETM & ETB is outside the scope of this article.
How does it work?
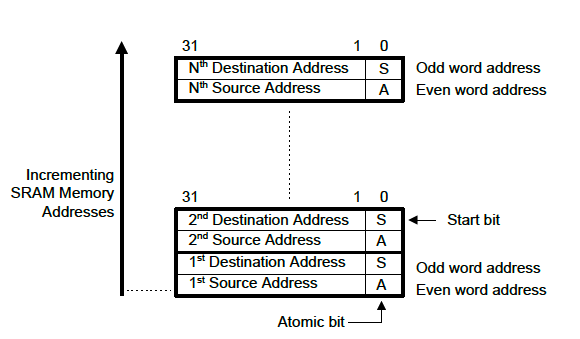
One of the things I like the most about the MTB is how incredibly simple it is. Once enabled, it writes an 8 byte packet to the trace buffer allocated in SRAM every time the program counter (PC) changes non-sequentially (i.e a branch is taken or an exception occurs).
The first 4 bytes of the packet is where the code was prior to branching (the “source address”) and the next 4 bytes is the address which was branched to (the “destination address”).
Since thumb instructions are always at least half-word aligned, the bottom bit of each word in the packet is used to encode extra information.
Bit 1 in the “source address”, referred to as the “A-bit”, differentiates the origin of the branch. When the bit is set it means the PC update occurred due to an exception or update over a debugger. When it is not set, it means a normal branch took place.
Bit 1 in the “destination address”, referred to as the “S-bit”, is set when the packet is the first one captured after a trace has been started. If the MTB has been stopped and started multiple times, this would reveal when there are gaps in the trace information.
With this information we can still recover every single instruction executed. In between branches we know sequential PCs were fetched between the destination of previous packet to source of next packet!
Putting it all together, the format looks like this:
Tracing Exception Return
You may recall that exception return for Cortex-M’s involves branching to a special EXC_RETURN value.
Returning from an exception results in two packets being written to the MTB. In the first packet, the “source address” will match the address of the instruction exiting the exception and the “destination address” will be the EXC_RETURN value. In the second packet, the “source address” will contain the EXC_RETURN value and the “destination address” will match the address of the instruction executed upon exception return.
Cortex-M33 MTB Registers
The MTB implementation present on the Cortex-M33 (MTB-M33) is comprised of seven registers:
| Address | Name | Description |
|---|---|---|
| 0xE0043000 | MTB_POSITION |
Holds current MTB write pointer offset |
| 0xE0043004 | MTB_MASTER |
Used to enable the MTB and configure its size |
| 0xE0043008 | MTB_FLOW |
Controls MTB behavior when full (default is to wrap and overwrite) |
| 0xE004300C | MTB_BASE |
Read only, reveals SRAM address where MTB packets are stored |
| 0xE0043010 | MTB_TSTART |
No config necessary for typical setup. (Allows DWT events to start MTB traces) |
| 0xE0043014 | MTB_TSTOP |
No config necessary for typical setup. (Allows DWT events to stop MTB traces) |
| 0xE0043018 | MTB_SECURE |
No config necessary for typical setup. (Allows for MTB SRAM to be split when using Trustzones) |
Typical Configuration
For a typical configuration, there are only three registers that need to be examined & updated: MTB_POSITION, MTB_MASTER, & MTB_BASE.
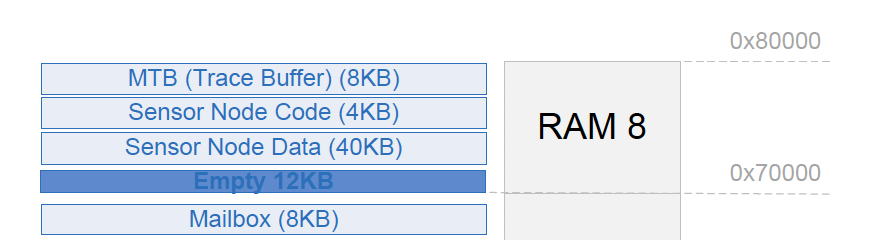
The MCU datasheet can be examined to determine the maximum amount of RAM that can be allocated to the MTB. In the Dialog datasheet we can find this in “Example of Memory Segments Mapping” 5:
MTB_BASE, 0xE004300C
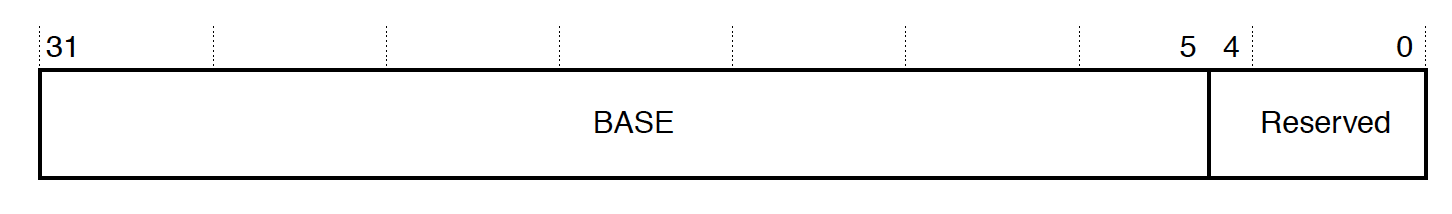
The MTB_BASE register describes where in SRAM MTB trace storage begins. We will use this value later in this article to read MTB data.
For the DA14695, we can confirm the location is at 0x2007e000 with gdb:
(gdb) p/x *(uint32_t*)0xE004300C
$1 = 0x2007e000
MTB_POSITION, 0xE0043000
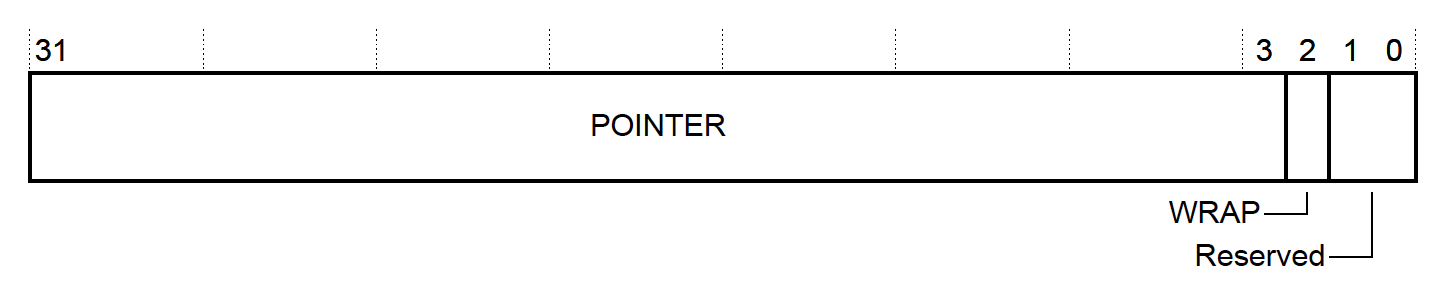
The MTB_POSITION register conveys two pieces of MTB state:
- The current write “pointer” for trace packet information. This will be where information about the next non-sequential instruction change is written. The actual SRAM address stored to can be computed as
MTB_BASE+POINTER. - Whether the data in the buffer has rolled around. If the storage has been filled and wrapped around, the “wrap” bit will be set. We can use this information to determine where the oldest trace packet is. If the “wrap” bit is set, the oldest record is at the “pointer” offset, otherwise it is at offset 0.
MTB_MASTER, 0xE0043004
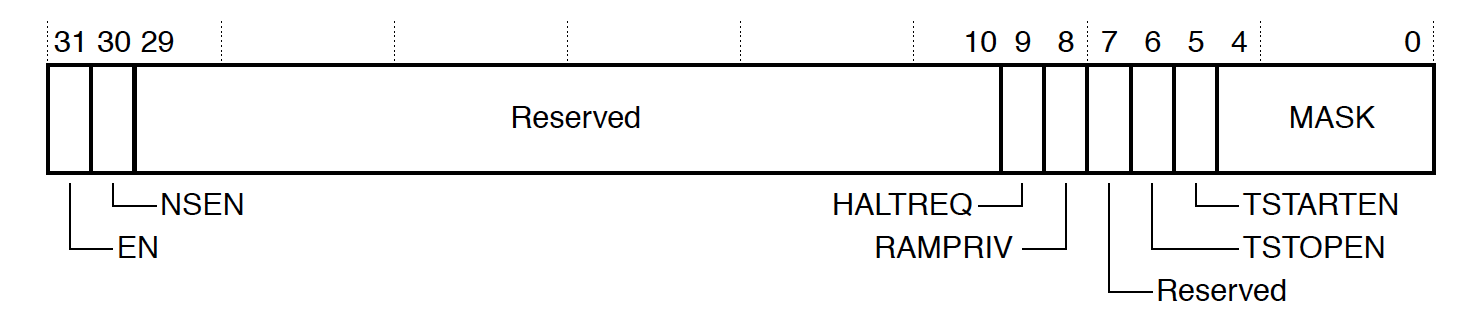
Among other things, the MTB_MASTER register is used to configure the amount of RAM to be used for tracing as well as actually enable the peripheral. The two fields you generally need to program are:
-
MASK- This controls how much space is used for the trace buffer. The size of the circular buffer used will be 2 ^ MASK + 4 up to the maximum space available. So for the DA14695, valid values will be 0 (20 + 4 = 16 bytes) up to 9 (29 + 4 = 8192 bytes). -
EN- Setting this bit will turn on MTB tracing!
Setup Code
C Code to Configure MTB
Putting it all together, we can write a basic MTB driver in a dozen or so lines of C code!
//! @file mtb.h

#include <stddef.h>

int mtb_enable(size_t size);
int mtb_disable(void);
//! @file mtb.c
// ...

typedef struct __attribute__((packed)) MtbM33 {
  __IOM uint32_t POSITION;
  __IOM uint32_t MASTER;
  __IOM uint32_t FLOW;
  __IM  uint32_t BASE;
  __IOM uint32_t TSTART;
  __IOM uint32_t TSTOP;
  __IOM uint32_t SECURE;
} sMtbM33;
static sMtbM33 *const MTB = ((sMtbM33 *)0xE0043000);

int mtb_enable(size_t mtb_size) {
  if ((mtb_size < 16) || (__builtin_popcount(mtb_size) != 1)) {
    // MTB must be at least 16 bytes and be a power of 2
    return -1;
  }

  // scrub MTB SRAM so it's easy to see what has gotten written to
  memset((void *)MTB->BASE, 0x0, mtb_size);
  const int mask = __builtin_ctz(mtb_size) - 4;

  // we are about to reconfigure so turn off MTB
  mtb_disable();

  // reset position
  MTB->POSITION = 0;

  // Start tracing!
  MTB->MASTER = (1 << 31) | (mask << 0);
  return 0;
}

int mtb_disable(void) {
  MTB->MASTER &= ~(1 << 31);
  return 0;
}
Tip: When capturing MTB traces on faults or errors for post-mortem analysis, be sure to temporarily disable the MTB to maximize the amount of useful context in the trace recording.
void HardFault_Handler(void) {
  mtb_disable();
  // ... rest of fault handling logic ...
}
GDB Python Script to Decode MTB Data
As a starting point for quick prototyping we can make use of GDB’s Python API to write a basic MTB decoder!
# mtb_decode.py
try:
    import gdb
except ImportError:
    raise Exception("This script can only be run within gdb!")

import argparse
import struct


def gdb_address_to_function(address):
    try:
        block = gdb.current_progspace().block_for_pc(address)
        while block is not None:
            if block.function:
                return str(block.function)
            block = block.superblock
    except RuntimeError:
        pass
    return hex(address)


def gdb_address_to_function_file_line(address):
    function = gdb_address_to_function(address)
    sal = gdb.find_pc_line(address)
    line = "?" if sal.symtab is None else sal.line
    filename = "?" if sal.symtab is None else sal.symtab.filename
    return (filename, line, function)


def gdb_read_word(address):
    reg_data = gdb.selected_inferior().read_memory(address, 4)
    reg_val = struct.unpack("<I", reg_data)[0]
    return reg_val


class GdbArgumentParseError(Exception):
    pass


class GdbArgumentParser(argparse.ArgumentParser):
    """Wrap argparse so gdb doesn't exit when a command fails """

    def exit(self, status=0, message=None):
        if message:
            self._print_message(message)
        # Don't call sys.exit()
        raise GdbArgumentParseError()


class Mtb(gdb.Command):
    def __init__(self):
        super(Mtb, self).__init__("mtb", gdb.COMMAND_STATUS, gdb.COMPLETE_NONE)

    def decode(self, limit=None):
        MTB_PERIPHERAL_ADDR = 0xE0043000
        MTB_POSITION = MTB_PERIPHERAL_ADDR + 0x0
        MTB_MASTER = MTB_PERIPHERAL_ADDR + 0x4
        MTB_BASE = MTB_PERIPHERAL_ADDR + 0xC

        mtb_position_val = gdb_read_word(MTB_POSITION)
        write_offset = mtb_position_val & 0xFFFFFFF8
        wrap = mtb_position_val & (1 << 2)

        mtb_base_val = gdb_read_word(MTB_BASE)

        mtb_master_val = gdb_read_word(MTB_MASTER)
        mask = mtb_master_val & 0x1F

        mtb_sram_size = 2 ** (mask + 4)
        valid_size = mtb_sram_size if wrap else write_offset
        oldest_pkt = write_offset if wrap else 0

        start = 0 if not limit else max(0, valid_size - limit * 8)

        for offset in range(start, valid_size, 8):
            pkt_addr = mtb_base_val + (oldest_pkt + offset) % mtb_sram_size

            # Read the source and destination addresses
            s_addr = gdb_read_word(pkt_addr)
            d_addr = gdb_read_word(pkt_addr + 4)

            bit_a = s_addr & 0x1
            s_addr &= 0xFFFFFFFE

            bit_s = d_addr & 0x1
            d_addr &= 0xFFFFFFFE

            if bit_s:
                print("Begin Trace Session")

            # For every valid packet, display src, dst and instruction info, i.e
            #
            # >S: 0x20000488 - HardFault_Handler @ ./main.c:107
            #  D: 0x200004e0 - mtb_disable @ ./mtb.c:41

            file_s, line_s, func_s = gdb_address_to_function_file_line(s_addr)
            file_d, line_d, func_d = gdb_address_to_function_file_line(d_addr)

            if bit_a:  # Exception or Debug State Entry / Exit
                if s_addr & 0xFFFFFF00 == 0xFFFFFF00:
                    print(">S: {} - Exception Return".format(hex(s_addr)))
                else:
                    print(
                        ">S: {} - Exception (or debug) Entry from {} @ {}:{}".format(
                            hex(s_addr), func_s, file_s, line_s
                        )
                    )
            else:  # Normal branch took place
                print(">S: {} - {} @ {}:{}".format(hex(s_addr), func_s, file_s, line_s))

            print(" D: {} - {} @ {}:{}".format(hex(d_addr), func_d, file_d, line_d))

    def invoke(self, unicode_args, from_tty):
        parser = GdbArgumentParser(description="MTB decode utility")

        parser.add_argument(
            "-l", "--limit", type=int, help="The maximum number of packets to decode"
        )

        try:
            args = parser.parse_args(list(filter(None, unicode_args.split(" "))))
        except GdbArgumentParseError:
            return

        self.decode(limit=args.limit)


Mtb()
Example Project
Now that we have put together code to configure and decode MTB info, let’s try it out! In the following sections, we will make use of the following setup to examine the MTB:
- a DA14695 Development Kit – USB6 (ARM Cortex-M33) as our development board
- SEGGER JLinkGDBServer5 as our gdbserver (V6.84a)
- GCC 9.3.1 / GNU Arm Embedded Toolchain as our compiler7
- GNU Make as our build system
Compiling and Flashing Project
Launch JLinkGDBServer
$ JLinkGDBServer -if swd -device DA14695 -nogui
Clone, Compile & Flash
$ git clone https://github.com/memfault/interrupt.git
$ cd example/mtb-m33/

# Build
$ make
Compiling main.c
Compiling startup.c
Compiling mtb.c
// ...
Linking library
Generated build/da1469x.elf

# Flash & Debug
$ make flash
(gdb)
Note the example App loads code directly into RAM so you will have to re-flash the application using
make flashafter running a test case.
Basic Usage Example
The default mode for the test application does nothing exciting but will serve as a good way to sanity check our decoder is working as expected. When the application starts up, it enters an infinite loop. The loop halts with a breakpoint instruction every five iterations:
__attribute__((optimize("O0")))
void infinite_loop(void) {
  volatile int i;
  while (1) {
    i++;

    if ((i % 5) == 0) {
      __asm("bkpt 6");
    }
  }
}

int main(void) {
   // ...
   mtb_enable(8192);
   // ...
   infinite_loop();
Let’s start the application and wait till the first breakpoint is hit:
$ make flash
Resetting target
(gdb) c
Continuing.

Program received signal SIGTRAP, Trace/breakpoint trap.
infinite_loop () at ./main.c:157
157       __asm("bkpt 6");
We can dump the disassembly of this loop to get a sense of what we expect to be recorded by the MTB:
(gdb) disassemble infinite_loop
Dump of assembler code for function infinite_loop:
    0x20000324 <+0>:	push	{r7}
    0x20000326 <+2>:	sub	sp, #12
    0x20000328 <+4>:	add	r7, sp, #0
    0x2000032a <+6>:	ldr	r3, [r7, #4]
    0x2000032c <+8>:	adds	r3, #1
    0x2000032e <+10>:	str	r3, [r7, #4]
    0x20000330 <+12>:	ldr	r1, [r7, #4]
    0x20000332 <+14>:	ldr	r3, [pc, #28]	; (0x20000350 <infinite_loop+44>)
    0x20000334 <+16>:	smull	r2, r3, r3, r1
    0x20000338 <+20>:	asrs	r2, r3, #1
    0x2000033a <+22>:	asrs	r3, r1, #31
    0x2000033c <+24>:	subs	r2, r2, r3
    0x2000033e <+26>:	mov	r3, r2
    0x20000340 <+28>:	lsls	r3, r3, #2
    0x20000342 <+30>:	add	r3, r2
    0x20000344 <+32>:	subs	r2, r1, r3
    0x20000346 <+34>:	cmp	r2, #0
*   0x20000348 <+36>:	bne.n	0x2000032a <infinite_loop+6>
    0x2000034a <+38>:	bkpt	0x0006
*   0x2000034c <+40>:	b.n	0x2000032a <infinite_loop+6>
    0x2000034e <+42>:	nop
    0x20000350 <+44>:	str	r7, [r4, #100]	; 0x64
    0x20000352 <+46>:	str	r6, [r4, #100]	; 0x64
Remember that the MTB only logs instructions when the PC is not sequential so out of the 23 instructions above only 2 of them should wind up emitting events (0x20000348 & 0x2000034c).
Let’s load our python gdb script and take a look at the decoded data!
(gdb) mtb
Begin Trace Session
>S: 0x20000510 - mtb_enable @ ./mtb.c:35
 D: 0x20000368 - main @ ./main.c:168
>S: 0x2000036e - main @ ./main.c:169
 D: 0x20000324 - infinite_loop @ ./main.c:151
>S: 0x20000348 - infinite_loop @ ./main.c:156
 D: 0x2000032a - infinite_loop @ ./main.c:154
>S: 0x20000348 - infinite_loop @ ./main.c:156
 D: 0x2000032a - infinite_loop @ ./main.c:154
>S: 0x20000348 - infinite_loop @ ./main.c:156
 D: 0x2000032a - infinite_loop @ ./main.c:154
>S: 0x20000348 - infinite_loop @ ./main.c:156
 D: 0x2000032a - infinite_loop @ ./main.c:154
Neat, what we are looking at here is a trace of the entire instruction flow up to the breakpoint.
If we want to view the exact instructions executed we can take the destination address from the previous packet and the source from the next packet and disassemble the range with gdb. We see the 0x20000348 we identified above has been recorded in the trace.
For example for the first D -> S transition we have above:
(gdb) disassemble/s 0x20000368,0x2000036e+4
Dump of assembler code from 0x20000368 to 0x20000372:
./main.c:
173   if (g_trace_example_config == 0) {
   0x20000368 <main+20>:	ldr	r3, [pc, #96]	; (0x200003cc <main+120>)
   0x2000036a <main+22>:	ldr	r3, [r3, #0]
   0x2000036c <main+24>:	cbnz	r3, 0x20000372 <main+30>

174     infinite_loop();
   0x2000036e <main+26>:	bl	0x20000324 <infinite_loop>
End of assembler dump.
And for the second we have:
(gdb) disassemble/s 0x20000324,0x20000348+4
Dump of assembler code from 0x20000324 to 0x2000034c:
./main.c:
153	void infinite_loop(void) {
   0x20000324 <infinite_loop+0>:	push	{r7}
   0x20000326 <infinite_loop+2>:	sub	sp, #12
   0x20000328 <infinite_loop+4>:	add	r7, sp, #0

154   volatile int i;
155   while (1) {
156     i++;
   0x2000032a <infinite_loop+6>:	ldr	r3, [r7, #4]
   0x2000032c <infinite_loop+8>:	adds	r3, #1
   0x2000032e <infinite_loop+10>:	str	r3, [r7, #4]

157
158     if ((i % 5) == 0) {
   0x20000330 <infinite_loop+12>:	ldr	r1, [r7, #4]
   0x20000332 <infinite_loop+14>:	ldr	r3, [pc, #28]	; (0x20000350 <infinite_loop+44>)
   0x20000334 <infinite_loop+16>:	smull	r2, r3, r3, r1
   0x20000338 <infinite_loop+20>:	asrs	r2, r3, #1
   0x2000033a <infinite_loop+22>:	asrs	r3, r1, #31
   0x2000033c <infinite_loop+24>:	subs	r2, r2, r3
   0x2000033e <infinite_loop+26>:	mov	r3, r2
   0x20000340 <infinite_loop+28>:	lsls	r3, r3, #2
   0x20000342 <infinite_loop+30>:	add	r3, r2
   0x20000344 <infinite_loop+32>:	subs	r2, r1, r3
   0x20000346 <infinite_loop+34>:	cmp	r2, #0
   0x20000348 <infinite_loop+36>:	bne.n	0x2000032a <infinite_loop+6>
Neat, so two trace packets (16 bytes of data) tells us the exact last 23 instructions which were executed by the processor! Both ranges examined end with branch instructions so our decoder appears to be working as expected!
Stack Overflow Debug Example
Let’s now go over an example of how to debug a stack overflow using the MTB.
Background Context
Most RTOS’ implement a simple stack overflow detection scheme.
First, when a new task is created the stack is scrubbed with a known pattern. For example, for FreeRTOS7 it looks like:
    /* Avoid dependency on memset() if it is not required. */
    #if ( tskSET_NEW_STACKS_TO_KNOWN_VALUE == 1 )
        {
            /* Fill the stack with a known value to assist debugging. */
            ( void ) memset( pxNewTCB->pxStack, ( int ) tskSTACK_FILL_BYTE, ( size_t ) ulStackDepth * sizeof( StackType_t ) );
        }
    #endif /* tskSET_NEW_STACKS_TO_KNOWN_VALUE */
Then, every time a task context switch takes place, the bottom of the stack is checked to see if it matches the known pattern. The FreeRTOS logic looks like this:
#define taskCHECK_FOR_STACK_OVERFLOW()                                                            \
{                                                                                                 \
   const uint32_t * const pulStack = ( uint32_t * ) pxCurrentTCB->pxStack;                       \
   const uint32_t ulCheckValue = ( uint32_t ) 0xa5a5a5a5;                                        \
                                                                                                 \
   if( ( pulStack[ 0 ] != ulCheckValue ) ||                                                      \
       ( pulStack[ 1 ] != ulCheckValue ) ||                                                      \
       ( pulStack[ 2 ] != ulCheckValue ) ||                                                      \
       ( pulStack[ 3 ] != ulCheckValue ) )                                                       \
   {                                                                                             \
       vApplicationStackOverflowHook( ( TaskHandle_t ) pxCurrentTCB, pxCurrentTCB->pcTaskName ); \
   }                                                                                             \
}


void vTaskSwitchContext( void )
{
// ...
        taskCHECK_FOR_STACK_OVERFLOW();
// ...
If the check fails, we know a stack overflow occurred at some point while the task was running. We may not have any information about what call chain led to the stack overflow however. When we context switch, the stack may no longer be at it’s deepest mark so the state may be lost! What’s super neat with the MTB is we can see the history of the functions executing leading up to the context switch for additional clues.
Let’s try out an example:
$ make flash
# Enable stack overflow example
(gdb) set g_trace_example_config=1
(gdb) continue
vApplicationStackOverflowHook (xTask=0x20008a88 <ucHeap+1832>, pcTaskName=0x20008abc <ucHeap+1884> "Algo") at ./main.c:101
101   __asm("bkpt 4");
We can load the mtb decoder script and take a look at the last 100 branches:
(gdb) mtb --limit 100

>S: 0x20000284 - recurse_func0 @ ./main.c:115
 D: 0x20000268 - recurse_func0 @ ./main.c:115
>S: 0x20000290 - recurse_func0 @ ./main.c:118
 D: 0x200002a4 - recurse_func1 @ ./main.c:123
>S: 0x200002ac - recurse_func1 @ ./main.c:123
 D: 0x200002c0 - recurse_func2 @ ./main.c:128
>S: 0x200002c8 - recurse_func2 @ ./main.c:128
 D: 0x200002dc - recurse_func3 @ ./main.c:133
>S: 0x200002e4 - recurse_func3 @ ./main.c:133
 D: 0x200002f8 - recurse_func4 @ ./main.c:138
>S: 0x20000300 - recurse_func4 @ ./main.c:138
 D: 0x20000318 - prvAlgoTask @ ./main.c:146
>S: 0x2000031a - prvAlgoTask @ ./main.c:146
 D: 0x20000e88 - vTaskDelay @ ./freertos_kernel/tasks.c:1341
>S: 0x20000e8c - vTaskDelay @ ./freertos_kernel/tasks.c:1341
 D: 0x20000ea0 - vTaskDelay @ ./freertos_kernel/tasks.c:1343
>S: 0x20000ea4 - vTaskDelay @ ./freertos_kernel/tasks.c:1343
 D: 0x20000eb0 - vTaskDelay @ ./freertos_kernel/tasks.c:1344
>S: 0x20000eb0 - vTaskDelay @ ./freertos_kernel/tasks.c:1344
 D: 0x20000bbc - vTaskSuspendAll @ ./freertos_kernel/tasks.c:2139
>S: 0x20000bc4 - vTaskSuspendAll @ ./freertos_kernel/tasks.c:2143
 D: 0x20000eb4 - vTaskDelay @ ./freertos_kernel/tasks.c:1355
>S: 0x20000eb8 - vTaskDelay @ ./freertos_kernel/tasks.c:1355
 D: 0x20000590 - prvAddCurrentTaskToDelayedList @ ./freertos_kernel/tasks.c:5265
>S: 0x200005a0 - prvAddCurrentTaskToDelayedList @ ./freertos_kernel/tasks.c:5280
 D: 0x20002540 - uxListRemove @ ./freertos_kernel/list.c:187
>S: 0x2000255e - uxListRemove @ ./freertos_kernel/list.c:208
 D: 0x200005a4 - prvAddCurrentTaskToDelayedList @ ./freertos_kernel/tasks.c:5293
>S: 0x200005a8 - prvAddCurrentTaskToDelayedList @ ./freertos_kernel/tasks.c:5293
 D: 0x200005ba - prvAddCurrentTaskToDelayedList @ ./freertos_kernel/tasks.c:5305
>S: 0x200005c0 - prvAddCurrentTaskToDelayedList @ ./freertos_kernel/tasks.c:5310
 D: 0x200005d2 - prvAddCurrentTaskToDelayedList @ ./freertos_kernel/tasks.c:5320
>S: 0x200005da - prvAddCurrentTaskToDelayedList @ ./freertos_kernel/tasks.c:5320
 D: 0x20002512 - vListInsert @ ./freertos_kernel/list.c:119
...
>S: 0x2000252e - vListInsert @ ./freertos_kernel/list.c:179
 D: 0x200005de - prvAddCurrentTaskToDelayedList @ ./freertos_kernel/tasks.c:5325
>S: 0x200005e8 - prvAddCurrentTaskToDelayedList @ ./freertos_kernel/tasks.c:5331
 D: 0x20000ebc - vTaskDelay @ ./freertos_kernel/tasks.c:1357
>S: 0x20000ebc - vTaskDelay @ ./freertos_kernel/tasks.c:1357
 D: 0x20000d18 - xTaskResumeAll @ ./freertos_kernel/tasks.c:2217
>S: 0x20000d20 - xTaskResumeAll @ ./freertos_kernel/tasks.c:2217
 D: 0x20000d2c - xTaskResumeAll @ ./freertos_kernel/tasks.c:2224
>S: 0x20000d2c - xTaskResumeAll @ ./freertos_kernel/tasks.c:2224
 D: 0x20002b94 - vPortRaiseBASEPRI @ ./freertos_kernel/portable/GCC/ARM_CM4F/portmacro.h:197
>S: 0x20002b9c - vPortRaiseBASEPRI @ ./freertos_kernel/portable/GCC/ARM_CM4F/portmacro.h:197
 D: 0x20002ba0 - vPortRaiseBASEPRI @ ./freertos_kernel/portable/GCC/ARM_CM4F/portmacro.h:197
>S: 0x20002bb8 - vPortEnterCritical @ ./freertos_kernel/portable/GCC/ARM_CM4F/port.c:420
 D: 0x20002bc4 - vPortEnterCritical @ ./freertos_kernel/portable/GCC/ARM_CM4F/port.c:420
>S: 0x20002bc4 - vPortEnterCritical @ ./freertos_kernel/portable/GCC/ARM_CM4F/port.c:420
 D: 0x20000d30 - xTaskResumeAll @ ./freertos_kernel/tasks.c:2226
>S: 0x20000d38 - xTaskResumeAll @ ./freertos_kernel/tasks.c:2228
 D: 0x20000d46 - xTaskResumeAll @ ./freertos_kernel/tasks.c:2230
...
>S: 0x20000d3c - xTaskResumeAll @ ./freertos_kernel/tasks.c:2315
 D: 0x20002bd4 - vPortExitCritical @ ./freertos_kernel/portable/GCC/ARM_CM4F/port.c:427
...
>S: 0x20002bf2 - vPortExitCritical @ ./freertos_kernel/portable/GCC/ARM_CM4F/portmacro.h:231
 D: 0x20000d40 - xTaskResumeAll @ ./freertos_kernel/tasks.c:2317
>S: 0x20000d42 - xTaskResumeAll @ ./freertos_kernel/tasks.c:2317
 D: 0x20000ec0 - vTaskDelay @ ./freertos_kernel/tasks.c:1366
>S: 0x20000ec2 - vTaskDelay @ ./freertos_kernel/tasks.c:1366
 D: 0x20000e8e - vTaskDelay @ ./freertos_kernel/tasks.c:1368
>S: 0x20000e9a - Exception (or debug) Entry from vTaskDelay @ ./freertos_kernel/tasks.c:1368
 D: 0x20002c00 - PendSV_Handler @ ./freertos_kernel/portable/GCC/ARM_CM4F/port.c:441
...
>S: 0x20002c30 - PendSV_Handler @ ./freertos_kernel/portable/GCC/ARM_CM4F/port.c:441
 D: 0x20000f08 - vTaskSwitchContext @ ./freertos_kernel/tasks.c:3012
>S: 0x20000f12 - vTaskSwitchContext @ ./freertos_kernel/tasks.c:3012
 D: 0x20000f1c - vTaskSwitchContext @ ./freertos_kernel/tasks.c:3020
>S: 0x20000f2a - vTaskSwitchContext @ ./freertos_kernel/tasks.c:3052
 D: 0x20000f44 - vTaskSwitchContext @ ./freertos_kernel/tasks.c:3052
>S: 0x20000f4a - vTaskSwitchContext @ ./freertos_kernel/tasks.c:3052
 D: 0x20000482 - vApplicationStackOverflowHook @ ./main.c:101
Scanning up through the execution history, we see a vTaskDelay() call. This is what triggered a context switch. Prior to that call we see that there is a sequence of calls from prvAlgoTask (recurse_func4 - recurse_func0). Since these were the functions executing prior to the context switch, it’s a pretty strong indicator it was one of these functions which triggered the stack overflow. We can then go and inspect the functions for large stack allocations. Examining the code we can see that recurse_func0 has an unbounded variable length array (VLA), computation_buf which likely tripped the overflow!
int recurse_func0(int val) {
  uint8_t computation_buf[val];
  memset(computation_buf, val & 0xff, sizeof(computation_buf));
  uint32_t total;
  for (size_t i = 0; i < val; i++) {
    total += computation_buf[i];
  }

  return total;
}
Cool, looking at the trace history, we were able to hone in on the problematic code path.
Memory Corruption Debug Example
Another challenging type of crash to resolve is a hardfault that arises after executing a sequence of instructions that corrupts register state. Some cases where I’ve seen this happen in the past include:
- Memory corruption leading to the execution of a random memory region as if it is a sequence of instructions
- Memory being used after it was free and a function pointer within that memory no longer being correct
- A misconfigured vector table leading to the execution of bogus code on exception entry
- Incorrect assembly leading to invalid execution path.
Let’s check out an example:
$ make flash
# Enable stack overflow example
(gdb) set g_trace_example_config=2
(gdb) Program received signal SIGTRAP, Trace/breakpoint trap.
HardFault_Handler () at ./main.c:106
106   __asm("bkpt 6");
In this scenario, even if we follow the steps from our previous post on how to recover the callstack after a HardFault, there isn’t a lot of context revealed.
p/a *(uint32_t[8] *)$psp
$2 = {
  0x0,
  0x200083b4 <ucHeap+84>,
  0xbf00de4d,
  0x2,
  0x200085a4 <ucHeap+580>,
==> lr
  0x0,
==> pc
  0xbf00de4c,
  0x61000000
}
A full discussion is outside the scope of this article but by dumping the $psp we can find out the lr prior to this exception was 0x00000000 and the pc was 0xbf00de4c. All this really tells us is something is seriously wrong!
However, with the MTB output we should be able to see the exact instruction execution history. Let’s try it out:
(gdb) mtb --limit 10
>S: 0x20002f24 - 0x20002f24 @ ?:?
 D: 0x20001ef6 - xQueueReceive @ ./freertos_kernel/queue.c:1356
>S: 0x20001efa - xQueueReceive @ ./freertos_kernel/queue.c:1361
 D: 0x20001f16 - xQueueReceive @ ./freertos_kernel/queue.c:1377
>S: 0x20001f16 - xQueueReceive @ ./freertos_kernel/queue.c:1377
 D: 0x20002bd4 - vPortExitCritical @ ./freertos_kernel/portable/GCC/ARM_CM4F/port.c:427
>S: 0x20002bda - vPortExitCritical @ ./freertos_kernel/portable/GCC/ARM_CM4F/port.c:427
 D: 0x20002be6 - vPortExitCritical @ ./freertos_kernel/portable/GCC/ARM_CM4F/port.c:428
>S: 0x20002bf2 - vPortExitCritical @ ./freertos_kernel/portable/GCC/ARM_CM4F/portmacro.h:231
 D: 0x20001f1a - xQueueReceive @ ./freertos_kernel/queue.c:1378
>S: 0x20001f1e - xQueueReceive @ ./freertos_kernel/queue.c:1378
 D: 0x2000045e - prvQueuePongTask @ ./main.c:86
>S: 0x20000468 - prvQueuePongTask @ ./main.c:91
 D: 0x200003ec - bad_asm_function @ ./main.c:75
>S: 0x200003f6 - bad_asm_function @ ./main.c:75
 D: 0xbf00de4c - 0xbf00de4c @ ?:?
>S: 0xbf00de4c - Exception (or debug) Entry from 0xbf00de4c @ ?:?
 D: 0x20000486 - HardFault_Handler @ ./main.c:107
>S: 0x20000488 - HardFault_Handler @ ./main.c:107
 D: 0x200004e0 - mtb_disable @ ./mtb.c:41
From the trace we can immediately see what was executing prior to the bad jump to 0xbf00de4c. In
this case it is a suspiciously named function that I instrumented, bad_asm_function() which was
invoked from prvQueuePongTask():
// for illustrative purposes, an assembly function that clobbers
// the lr and then jumps to a bogus address
__attribute__((naked))
static void bad_asm_function(void) {
  __asm("mov r0, 0 \n"
        "ldr r2, =3204505165 \n"
        "mov lr, 0 \n"
        "bx r2 \n"
        );
}
Although contrived, I hope the example conveys the general idea how the instruction trace can be useful for root causing this class of bug!
Postmortem Analysis
So far the examples we have walked through are still only helpful if a debugger is attached to the board so the trace stream can be pulled off. Once the product has shipped and is out in the field these strategies will not help to triage what went wrong on devices.
For production, I would recommend collecting the trace buffer and MTB peripheral block (0xE0043000-0xE0043018) when an unexpected error or fault takes place. With these two pieces of information, we can remotely recover an exact trace of the instructions that were executing prior to the issue!
Conclusion
I hope this article taught you a little bit about the MTB and got you thinking about how you could make use of it!
Or if you work for a semiconductor company, maybe this will help sway you to include the MTB in your next Cortex-M33 design :)
If you have used the MTB before, I’d be especially curious to hear what you used it for, and what else you would have mentioned in a post about it!
Either way, looking forward to hearing your thoughts in the discussion area below or on the Interrupt Slack.
Further Reading
I have not come across many discussions of the Micro Trace Buffer online but here are a few I have seen:
References
 Chris Coleman is a founder and CTO at Memfault. Prior to founding Memfault, Chris worked on the embedded software teams at Sun, Pebble, and Fitbit.