Faster Debugging with Watchpoints
One of the most challenging types of issues to debug is memory corruption! Memory corruption can be caused for a variety of reasons including when data is used after it has been freed, a read or write goes past the end of a buffer, thread safety constructs are missing, or a linker script is misconfigured. By the time the system finally faults or encounters an error, the original operation which spiraled the system into the bad state is often lost!
Data breakpoints (“Watchpoints”) can be used to catch memory corruption at the source and have personally saved me a tremendous amount of time debugging nefarious issues over the years. Whether you are a watchpoint power user or haven’t used them before, I hope this article can teach you something new!
In this post we will explore how to save time debugging by making the most of watchpoints. We will walk through a few classic use cases of watchpoints by debugging an example application with GDB. Then, we will dive into how watchpoints are implemented for ARM Cortex-M based MCUs with the Data Watchpoint & Trace (DWT) unit and explore some advanced features.
Note: While the examples in this article will use ARM Cortex-M hardware, the general ideas presented about watchpoints can be applied to any compiled language and debugger.
Table of Contents
Basic Terminology
Watchpoints are very similar to breakpoints and are often referred to as “data breakpoints”. Where breakpoints allow you to halt program flow based on a certain instruction being executed, watchpoints allow you to halt flow based on a particular data access. Watchpoints can be used to monitor “write”, “read” or “read/write” accesses. For example, a watchpoint might be configured to trip when a variable gets updated, a region of the stack is written to, or a particular buffer is read from.
In order for watchpoints to work and system execution to not grind to a halt, native hardware support for this functionality is required. This is implemented at the silicon level with a comparator. Every time a data access is made, the address accessed is compared against the value in the watchpoint comparator which can be done in parallel to the normal execution flow. If the value of the comparator matches the address being accessed, the system emits an event and the MCU is halted. If they do not match, the system keeps running as normal and there is no overhead to the operation!
Example Project Setup
In the following sections, we will explore how watchpoints work by building on top of the bare-metal application running on a nRF52 that we used to investigate how breakpoints work and how to debug without a debugger.
We will make use of the following setup:
- a nRF52840-DK1 (ARM Cortex-M4F) as our development board
- SEGGER JLinkGDBServer2 as our gdbserver (V6.84a)
- GCC 9.3.1 / GNU Arm Embedded Toolchain as our compiler3
- GNU Make as our build system
- the simple CLI shell we built up in a previous post.
- PySerial’s
miniterm.py4 to connect to the serial console on the nRF52.
Compiling and Flashing Project
If you have an nRF52840-DK and would like to follow along:
Launch JLinkGDBServer
$ JLinkGDBServer -if swd -device nRF52840_xxAA -nogui
Clone, Compile & Flash
$ git clone https://github.com/memfault/interrupt.git
$ cd example/watchpoints

# Build
$ make
Compiling src/accel_fake.c
Compiling src/dummy_functions.c
Compiling src/dwt.c
Compiling src/graphics_fake.c
Compiling src/log_port.c
Compiling src/main.c
Compiling src/minimal_nrf52_uart.c
Compiling src/shell.c
Compiling src/shell_commands.c
Compiling src/shell_port.c
Compiling src/startup.c
Linking library
Generated build/nrf52.elf

# Flash & Debug
$ make flash
(gdb)
Open a Serial Connection to Shell
# Start Miniterm (Separate Terminal)
$ miniterm.py /dev/cu.usbmodem* 115200 --raw
--- Miniterm on /dev/cu.usbmodem0006838593731  115200,8,N,1 ---
--- Quit: Ctrl+] | Menu: Ctrl+T | Help: Ctrl+T followed by Ctrl+H ---
==Booted==

shell>
Watchpoints with GDB
Almost all debuggers expose some way to configure watchpoints via their interface. For GDB, this is done through the watch <expr> command, which will configure a watchpoint for the address described in <expr>. GDB also exposes a rwatch command (for data breakpoints on read accesses) and awatch (for data breakpoints on read or write accesses).
In the following sections we will walk through configurations and examples for monitoring changes to the following C variable.
uint8_t g_array[17]
(gdb) p &g_array
$1 = (volatile uint8_t (*)[17]) 0x200029a0 <g_array>
Commands
Watch for writes to a variable
(gdb) watch g_array
The above should trigger a watchpoint when a write takes place anywhere in g_array.
Tip: Watchpoint tracing is dependent on the functionality supported by the hardware. Watching data of completely arbitrary sizes is typically not supported by hardware. For best reliability on embedded systems, I recommend using watchpoints with sizes of native types (byte, half-word, and word). We will walk through these limitations for ARM Cortex-M in the sections below or you can find more details in the architecture reference manual. 5
Watch for writes to an address
(gdb) watch *(uint32_t *)0x200029a0
The above will trigger a watchpoint when a write takes place anywhere between 0x200029a0 & 0x200029a4.
Watch for writes to an array
(gdb) watch *(uint8_t[2] *)0x200029a0
The above will trigger a watchpoint when a write takes place anywhere between 0x200029a0 & 0x200029a2.
Watch for reads to an array
(gdb) rwatch *(uint8_t[2] *)0x200029a0
The above will trigger a watchpoint when a read takes place anywhere between 0x200029a0 &
0x200029a2.
Example
The example app has two CLI commands we can use to test configuring watchpoints:
-
arr_read [idx]to read a byte at the given index -
arr_write [idx] [val]to write a byte value at a given index.
Write Watchpoint Example
Let’s start by configuring a write watchpoint on the first two bytes of g_array:
(gdb) watch *(uint8_t[2] *)0x200029a0
Hardware watchpoint 1: *(uint8_t[2] *)0x200029a0
(gdb) continue
We can then perform read and writes on g_array from the CLI:
shell> arr_read 0
Read - Addr: 0x200029a0, Index: 0, Value: 0x00000000
# Nothing happens on the read since we
# have only installed a "write" watchpoint
shell> arr_write 5 1
Write - Addr: 0x200029a5, Index: 5, Value: 0x00000001
# Nothing happened above because we
# are outside the range being watched
shell> arr_write 0 1
Write - Addr: 0x200029a0, Index: 0, Value: 0x00000001
# Debugger should have halted
In the last command we changed the value at array index 1 which should have triggered a halt:
(gdb) c
Continuing.

Hardware watchpoint 1: *(uint8_t[2] *)0x200029a0

Old value = "\000"
New value = "\001"
0x000008f6 in prv_arr_write () at ./src/shell_commands.c:153
153   return 0;
Read Watchpoint Example
We can also add a watchpoint that will only trigger on a read access using rwatch. Let’s try it out:
(gdb) rwatch *(uint8_t[4] *)0x200029a0
(gdb) continue
Now if we try a read we will see a halt:
shell> arr_read 2
# Debugger should have halted
Hardware read watchpoint 2: *(uint8_t[4] *)0x200029a0

Value = "\001\000\000"
0x00000892 in prv_arr_read () at ./src/shell_commands.c:129
(gdb)
GDB Watchpoint Implementation Quirk
When you install a watchpoint with GDB it will immediately do a read of the current values for that range. Every time a hardware watchpoint event is generated it will re-read the region so it can show you the “New value” alongside the “Old value”. If both values are equal, GDB will suppress the debug event generated and auto-resume the processor6. This is generally not a problem but can be confusing if you are testing watchpoint functionality or actually want to track every access.
When should I leverage watchpoints?
There’s a variety of scenarios where watchpoints can be used creatively for debug. Let’s walk through a couple of the most common use-cases through examples!
Memory Corruption
Consider the following (albeit contrived) accelerometer driver:
// accel.h
//! Processes raw accelerometer readings
void accel_process_reading(int x, int y, int z);

//! Prototype for handler invoked each time accel data
//! is processed
typedef void (*AccelSampleProcessedCallback)(void);

//! Register handler to be called when an accel
//! sample is processed
void accel_register_watcher(
    AccelSampleProcessedCallback data_processed_cb);
On boot, we register a watcher that gets notified as new accel samples are processed:
// main.c
void accel_data_processed(void) {
  EXAMPLE_LOG("Accel Sample Processing Complete!");
  ...
}

int main(void) {
  prv_enable_vfp();
  uart_boot();

  accel_register_watcher(accel_data_processed);
  graphics_boot(s_graphics_buf, sizeof(s_graphics_buf));
  ...
}
Our (contrived) “driver” looks like this:
static AccelSampleProcessedCallback s_data_processed_cb = NULL;

void accel_register_watcher(
    AccelSampleProcessedCallback data_processed_cb) {
  s_data_processed_cb = data_processed_cb;
}

void accel_process_reading(int x, int y, int z) {
  EXAMPLE_LOG("Processing Accel Reading ...");
  if (s_data_processed_cb == NULL) {
    return;
  }

  // ... process raw readings ...

  // notify consumer new data is available
  s_data_processed_cb();
}
I’ve wired up the accel_example CLI command to call accel_process_reading() so we can test it out:
shell> accel_example
accel_handle_reading()
# Debugger should have halted!
In GDB, we see:
(gdb)
Continuing.

Program received signal SIGTRAP, Trace/breakpoint trap.
0x00000950 in HardFault_Handler ()
That’s strange, this code is extremely simple. What happened?! Let’s add some breakpoints in the accel driver code to investigate.
(gdb) mon reset
(gdb) continue
(gdb) break accel_register_sample_handler
(gdb) break accel_example
(gdb) c
Continuing.

Breakpoint 1, accel_register_watcher (data_processed_cb=0x469 <accel_data_processed>) at ./src/accel_fake.c:17
17      AccelSampleProcessedCallback data_processed_cb) {
(gdb)
It looks like we are registering the handler, accel_data_processed, as expected. Let’s continue and call accel_example again and we should hit our second breakpoint:
shell> accel_example
# debugger should have halted at
# accel_process_reading()
Breakpoint 2, accel_process_reading (x=x@entry=7, y=y@entry=1, z=z@entry=1) at ./src/accel_fake.c:22
22    EXAMPLE_LOG("Processing Accel Reading ...");
(gdb) p s_data_processed_cb
$3 = (AccelSampleProcessedCallback) 0xffeeffee
We see s_data_processed_cb looks like a bogus address, 0xffeeffee, but we verified it was set correctly on boot. Confusing! Let’s add a watchpoint to track down when the variable is getting set:
(gdb) watch *(uint32_t*)&s_data_processed_cb
(gdb) mon reset
(gdb) c


Hardware watchpoint 1: *(uint32_t*)&s_data_processed_cb

Old value = 4293853166
New value = 0
0x00000a6a in prv_cinit () at ./src/startup.c:33
33    for (uint32_t *dst = &_sbss; dst < &_ebss;) {
This makes sense, s_data_processed_cb is getting set to zero when we initialize BSS. Onward …
(gdb) continue

Hardware watchpoint 1: *(uint32_t*)&s_data_processed_cb

Old value = 0
New value = 1129
0x000002e2 in accel_register_watcher (data_processed_cb=0x469 <accel_data_processed>) at ./src/accel_fake.c:18
18    s_data_processed_cb = data_processed_cb;
This also makes sense, this is where we set the correct value. Onward …
(gdb)

Hardware watchpoint 1: *(uint32_t*)&s_data_processed_cb

Old value = 1129
New value = 65518
0x0000040e in graphics_boot (buf=buf@entry=0x20002080 <s_graphics_buf>, len=len@entry=4) at ./src/graphics_fake.c:5
5     for (size_t i = 0; i < len; i++) {
This is suspicious! s_data_processed_cb is getting updated from our graphics stack?! Let’s examine the code
(gdb) list graphics_boot

4	void graphics_boot(uint16_t *buf, size_t len) {
5     for (size_t i = 0; i < len; i++) {
6       buf[i] = 0xffee;
7     }
The fact that we are writing over s_data_processed_cb suggests the len parameter above may be
incorrect and we are writing past the end of the array.
(gdb) list s_graphics_buf
[...]
40	static uint16_t s_graphics_buf[2];
[...]
Now we can see the issue!
s_graphics_buf is uint16_t array with two entries. The for loop in graphics_boot is
setting each entry in the array to 0xffee. However, when we review the call to graphics_boot,
we see the size of the buffer,sizeof(s_graphics_buf), was passed instead of the array length,
sizeof(s_graphics_buf) / sizeof(s_graphics_buf[0]):
graphics_boot(s_graphics_buf, sizeof(s_graphics_buf));
This means the for loop is writing at indexes 2 & 3 which is past the end of the array and we are clobbering memory!
We can confirm in GDB that s_registered_handler has been allocated right after s_graphics_buf and is getting corrupted:
(gdb) x/a s_graphics_buf
0x20002080 <s_graphics_buf>:	0xffeeffee
(gdb)
0x20002084 <s_registered_handler>:	0xffee
Sweet, using a watchpoint just saved a bunch of time traipsing through code to find this bug!
Stack Overflows
Watchpoints can also aid in halting execution before a stack overflow occurs. Let’s run a different command in the app, math_example, and investigate:
shell> math_example
Running math_function()
# Debugger should have halted
Program received signal SIGTRAP, Trace/breakpoint trap.
0x00000998 in HardFault_Handler ()
(gdb) x/a $sp
0x1fffffd0:	0x0 <g_pfnVectors>
Yikes, we have hit another hardfault. What’s interesting here is our stack pointer, $sp, ran off the end of RAM, 0x2000.0000. This suggests a stack overflow took place. It’s hard to see what happened because we ran off valid RAM and so not all the register state will be on the stack.
Note: For a deeper dive into debugging Cortex-M faults in general, check out our post on the topic.
Since the overflow is reproducible, let’s see if we can intercept before the overflow and get a stack trace. We will install a watchpoint near the bottom of the stack:
(gdb) mon reset
(gdb) continue
(gdb) watch *(uint32_t*)0x20000010
(gdb) c
shell> math_example
# Debugger should have halted
(gdb)
Old value = 0
New value = 536870936
0x00000734 in math_function (n=799, n@entry=-1) at ./src/shell_commands.c:95
95	int math_function(int n) {
(gdb) bt
#0  0x00000734 in math_function (n=799, n@entry=-1) at ./src/shell_commands.c:95
#1  0x00000786 in math_function (n=0, n@entry=-1) at ./src/shell_commands.c:107
#2  0x00000786 in math_function (n=0, n@entry=-1) at ./src/shell_commands.c:107
[...]
#202 0x000007d6 in prv_math_example (argc=<optimized out>, argv=<optimized out>) at ./src/shell_commands.c:141
#203 0x000006c2 in prv_process () at ./src/shell.c:117
#204 shell_receive_char (c=<optimized out>) at ./src/shell.c:143
#205 0x00000928 in shell_processing_loop () at ./src/shell_port.c:60
#206 0x00000462 in main () at ./src/main.c:51
So we have a recursive function in this case that’s blowing through our stack! Using the watchpoint made it much easier to root cause the code path triggering the overflow.
How do watchpoints work?
Now that we have a good idea of what watchpoints do and how they can help us out, let’s examine what is actually happening under the hood!
GDB Watchpoint Handling
Let’s start by taking a look at how watchpoints are handled with GDB. We’ll employ a similar strategy to what we used investigating how breakpoints work. We’ll briefly recap the important parts here.
At a high level, gdb (the “client”) interfaces with the embedded MCU via a gdbserver (in our case SEGGER’s JLinkGDBServer). The protocol talked between the gdb “client” and the gdb “server” is referred to as “GDB Remote Serial Protocol” (GDB RSP)7.
If we take a look at the GDB RSP docs we will find that the ‘z’ packets are used to configure watchpoints.
GDB RSP Watchpoint Command
The format for enabling and disabling watchpoints is ‘Z/z addr,kind’. kind specifies the number of bytes after addr that will be watched and we have the following options:
| GDB Remote Serial Packet | Operation |
|---|---|
Z2,addr,kind |
Add Read Watchpoint at addr
|
z2,addr,kind |
Remove Read Watchpoint at addr
|
Z3,addr,kind |
Add Write Watchpoint at addr
|
z3,addr,kind |
Remove Write Watchpoint at addr
|
Z4,addr,kind |
Add Access (Read/Write) Watchpoint at addr
|
z4,addr,kind |
Remove Access (Read/Write) Watchpoint at addr
|
Debugging GDB Remote Serial Protocol
Now we can take a look at the actual GDB RSP commands that get sent over the wire when we install a watchpoint and compare against the table above. GDB has a builtin debug command, set debug remote 1, which can be used to dump this trace.
GDB RSP while Setting Watchpoints
Let’s flip on GDB RSP debug tracing, install a watchpoint, and see what happens!
(gdb) set debug remote 1
(gdb) watch *(uint8_t[4] *)&g_array
Sending packet: $m200029a0,4#8b...Packet received: 00000000
Sending packet: $m200029a0,4#8b...Packet received: 00000000
Hardware watchpoint 2: *(uint8_t[4] *)&g_array
We see some m packets
(m addr,length). These are used for requesting reads of memory but no watchpoint set commands yet.
These reads are used to cache the “old value” for the data range being watched that we discussed above.
Let’s continue and see what happens:
(gdb) continue
Continuing.
Sending packet: $m200029a0,4#8b...Packet received: 00000000
=> Sending packet: $Z2,200029a0,4#d6...Packet received: OK
Packet Z2 (write-watchpoint) is supported
Sending packet: $c#63...
We see a $Z2,200029a0,4 request issued which means “install a software watchpoint for writes between address 0x200029a0 - 0x200029a4”. This matches the address of g_array so that’s what we’d expect! It looks like watchpoints are only installed when we resume just like breakpoints.
GDB RSP when a Watchpoint Triggers
Now let’s actually cause the watchpoint to be triggered by using the same arr_write command from above to write a new value into the array:
shell> arr_write 0 1
Write - Addr: 0x200029a0, Index: 0, Value: 0x00000001
# Debugger should have halted
=> Packet received: T05watch:200029A0;thread:0000DEAD;
...
Sending packet: $m200029a0,4#8b...Packet received: 01000000
Sending packet: $z2,200029a0,4#f6...Packet received: OK
...
Sending packet: $s#73...Packet received: T05watch:00000000;thread:0000DEAD;
...
Sending packet: $m200029a0,4#8b...Packet received: 01000000
...

Hardware watchpoint 1: *(uint8_t[4] *)&g_array

Old value = "\000\000\000"
New value = "\001\000\000"
Sending packet: $m886,4#73...Packet received: e2e7a718
0x00000886 in prv_arr_write (Sending packet: $m20001f80,40#be...Packet received: c41b0000c30600009c280020a6280020a82800200000000000000000000000000000000000000000000000000000000000000000000000000000000000000000
Sending packet: $m6c2,4#98...Packet received: b1e79428
argc=<optimized out>, argv=<optimized out>) at ./src/shell_commands.c:140
140   return 0;
We can see from the trace above that a watchpoint debug event took place. This is conveyed by the
T AA n1:r1;n2:r2;…
Stop Reply Packet where T indicates a signal was received and watch indicates a hardware
watchpoint was the event type.
There’s also a single step (the s instruction). For Cortex-M’s this doesn’t serve any real purpose but watchpoints take a similar code path to breakpoints. For breakpoints, the single step is necessary so we are likely just picking up the behavior for that.
Recovering Instruction Triggering Watchpoint
TIP: When a watchpoint event is triggered the
$pchas already advanced to the next instruction. With the additional single step we saw above, it means by the time the system halts we are two instructions past where the load or store occurred. In this particular example we can see it was astrbinstruction that triggered the watchpoint by looking at the assembly in GDB:(gdb) disassemble $pc ... 0x000008f2 <+70>: strb r5, [r6, r4] 0x000008f4 <+72>: movs r0, #0 => 0x000008f6 <+74>: b.n 0x8be <prv_arr_write+18>
Finally, we see a request to remove the watchpoints was sent ($z2,240,2). Removing watchpoints
reduces the probability of the debugger getting killed and leaving the system in a state where watchpoints are left installed.
GDB RSP when Continuing After a Watchpoint Trigger
(gdb) c
Continuing.
Sending packet: $m200029a0,4#8b...Packet received: 01000000
Sending packet: $Z2,200029a0,4#d6...Packet received: OK
Sending packet: $Hc0#db...Packet received: OK
Sending packet: $c#63...
Nothing too exciting here. We see that the watchpoint is re-enabled with the Z2 command and the system is resumed.
Setting the same value
We can write the same value again and confirm the system does not halt. We can however see that there is GDB RSP traffic between the server and client handling the auto resumption:
shell> arr_write 0 1
Write - Addr: 0x200029a0, Index: 0, Value: 0x00000001
shell>
Packet received: T05watch:200029A0;thread:0000DEAD;
[...]
Sending packet: $m200029a0,4#8b...Packet received: 01000000
Sending packet: $z2,200029a0,4#f6...Packet received: OK
Sending packet: $Hcdead#39...Packet received: OK
Sending packet: $s#73...Packet received: T05watch:00000000;thread:0000DEAD;
[...]
Sending packet: $m200029a0,4#8b...Packet received: 01000000
Sending packet: $m200029a0,4#8b...Packet received: 01000000
Sending packet: $m200029a0,4#8b...Packet received: 01000000
Sending packet: $Z2,200029a0,4#d6...Packet received: OK
Sending packet: $Hc0#db...Packet received: OK
Sending packet: $c#63...
Cortex-M Hardware Watchpoints
Now that we have a pretty good idea of how GDB sets and removes watchpoints, let’s examine how they are implemented in hardware for Cortex-M targets. For our debug setup, it’s SEGGER’s JLinkGDBServer that will be responsible for this programming.
Data Watchpoint and Trace Unit
For ARM Cortex-M MCUs, hardware watchpoint functionality is exposed via the “Data Watchpoint and Trace Unit” (DWT)5.
The DWT implements many tracing features and there are many articles to write on the topic. Today we will focus exclusively on the watchpoints and the registers needed to configure them.
DWT Control register, DWT_CTRL, 0xE0001000
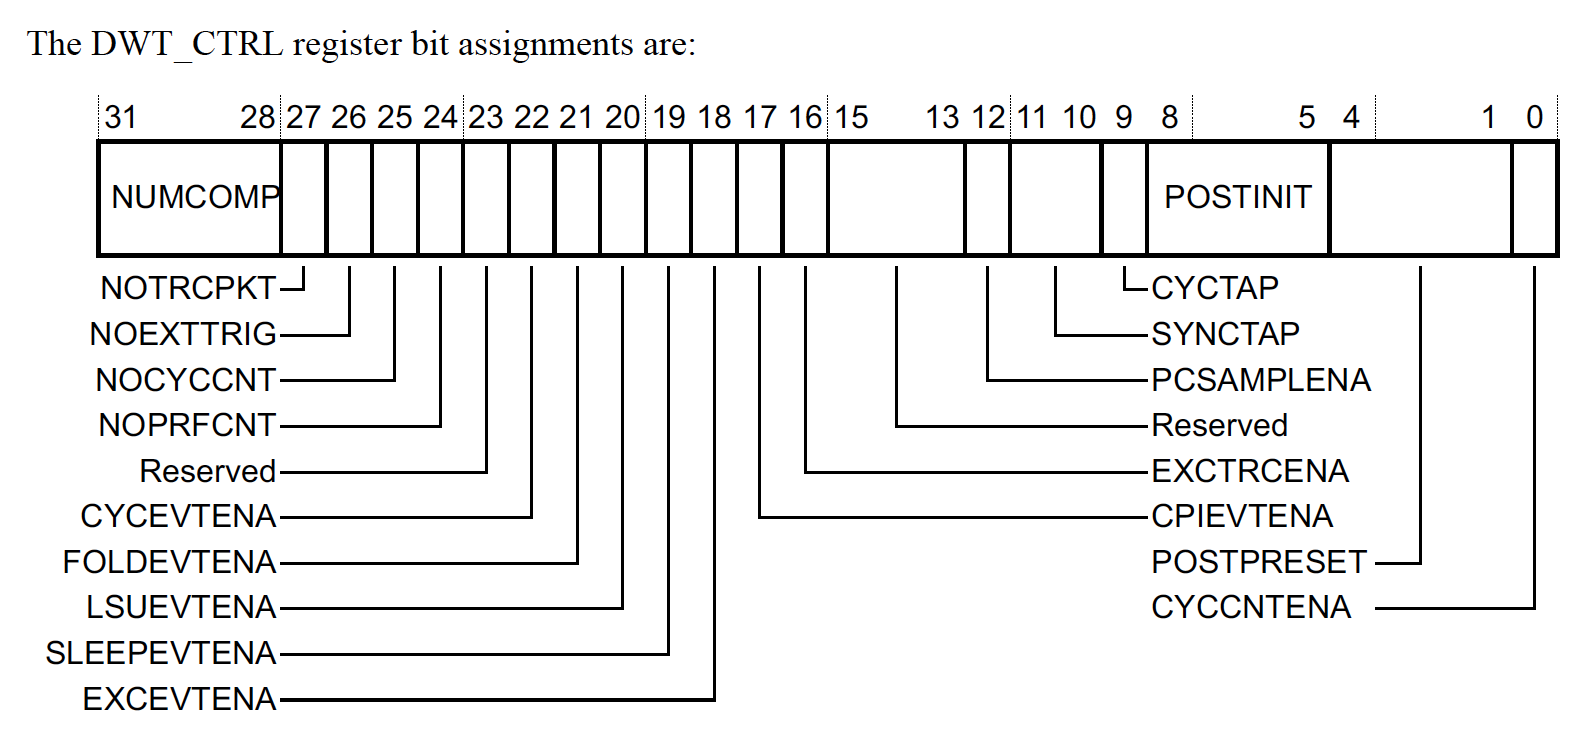
The DWT_CTRL is where you can find out information about how many hardware watchpoints are supported. Notably,
-
NUMCOMP: The number of watchpoint comparators implemented or 0 in the case the DWT is not included in the hardware.
Provided the Cortex-M supports at least one watchpoint, we can configure them using three registers, DWT_FUNCTIONn,DWT_COMPn & DWT_MASKn. We will explore the configuration setting for these registers in more detail below.
Comparator Function register DWT_FUNCTIONn, 0xE0001028 + 16n
The function register controls the type of memory to watch and what will happen when a watchpoint event occurs. We can configure a “watchpoint event” which either triggers a halting event or a DebugMonitor exception.
Note: One can also configure the peripheral to emit events out via the tracing subsystem (i.e ITM, ETM) but that is outside the scope of this article.
The DWT_FUNCTION register definition looks like this:
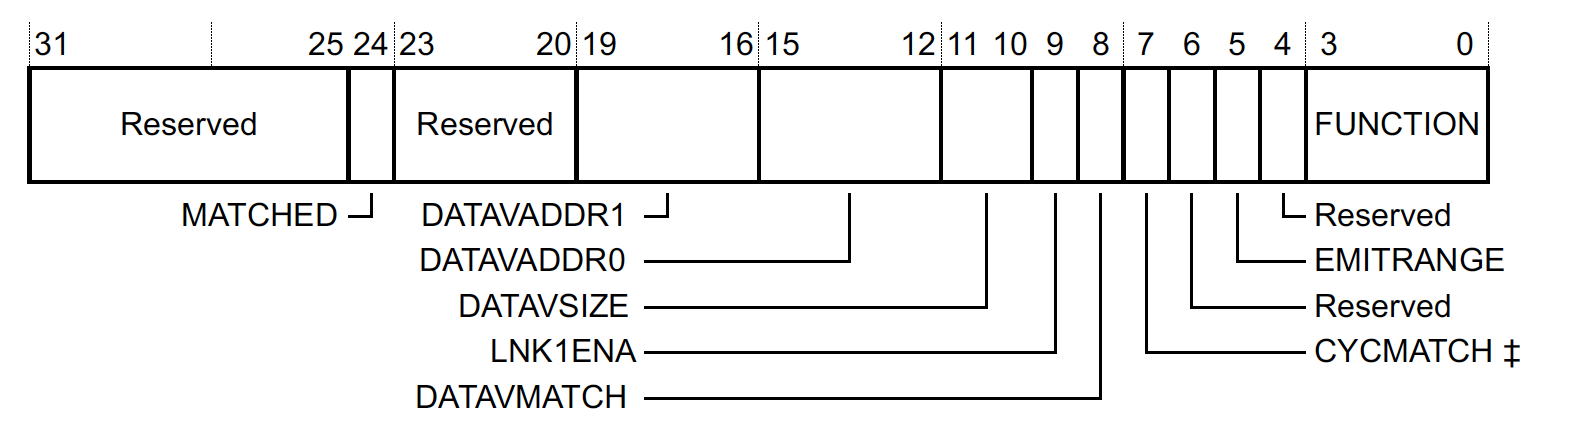
where,
-
MATCHEDIndicates if there was a match since the last time the register was read. This can be used by a debugger to determine if this was the source of the debug event emitted. It’s cleared on read so you will likely never see it set when using a debugger. -
DATAVADDR1,DATAVADDR0,DATAVSIZE,LNK1ENAWe won’t go into too many details but these registers can be used to trigger a watchpoint event when a certain “data value” pattern is written over an address range. I’m not aware of an easy way to configure this with most debuggers, but the feature is really neat! For example, you can use it to to halt at a specific index in a for loop or if a certain data pattern is written anywhere in RAM! This type of watchpoint is only implemented in comparator 1 for most Cortex-M targets. -
CYCMATCHOnly implemented for comparator 0. This can be used to trigger a watchpoint after a certain number of CPU cycles have passed. -
FUNCTION- Controls the type of comparison which is performed. When this field is set to 0, the comparator is disabled.
FUNCTION values for typical watchpoint
For the typical, “data address” watchpoint we have talked about so far in the article, the following configurations can be used to generate watchpoint events:
| FUNCTION | Evaluation Performed | Event Generated |
|---|---|---|
0b0000 (0x0) |
None | Comparator is Disabled |
0b0100(0x4) |
Instruction Fetch | PC watchpoint debug event |
0b0101 (0x5) |
Read/Load Data Access | Watchpoint debug event |
0b0110 (0x6) |
Write/Store Data Access | Watchpoint debug event |
0b0111 (0x7) |
Read or Write Data Access | Watchpoint debug event |
Comparator registers, DWT_COMPn, 0xE0001020 + 16n
If we have configured the DWT_FUNCTION register to look for a data address access, this register simply holds that address.
Comparator Mask registers, DWT_MASK, 0xE0001024 + 16n
The setting in the MASK defines the number of bits to ignore when performing a comparison. The maximum mask size is implementation defined but you can easily figure out the max size by writing 0x1F to the field and seeing which bits remain set. For example, on the NRF52:
(gdb) set *(uint32_t*)0xE0001024=0x1f
(gdb) p/x *(uint32_t*)0xE0001024
$3 = 0xf
This means we can mask out up to 15 bits and that a single watchpoint can be used to monitor a data access over a 32kB aligned RAM region!
Cortex-M Example DWT Configurations
Now that we have a basic understanding let’s look at a few practical configurations made via GDB and what we would expect the settings to look like:
| GDB Command Trigger Condition |
DWT_FUNCTION | DWT_COMP | DWT_MASK |
|---|---|---|---|
watch *(uint8_t *)0x20000001 (Write to 0x20000001) |
0x6 | 0x20000001 | 0x0 |
watch *(uint16_t *)0x20000000 (Any write between 0x20000000-0x20000002 ) |
0x6 | 0x20000000 | 0x1 |
watch *(uint8_t[4] *)0x20000010 (Any write between 0x20000010- 0x20000014) |
0x6 | 0x20000010 | 0x2 |
rwatch *(uint8_t[16] *)0x20000020 (Any read between 0x20000020-0x2000002F) |
0x5 | 0x20000020 | 0x4 |
Note: An important observation here is it is only possible to watch ranges of addresses that are aligned on the size being watched. For example, if you wanted to watch 4 bytes starting at 0x20000002, you would need two watchpoints (
DWT_COMP=0x20000002,DWT_MASK=1&DWT_COMP=0x20000004,DWT_MASK=1). GDB does not manage this for you so care should be taken to install watchpoints on aligned boundaries.
Examining DWT Configuration
Since watchpoints are disabled when GDB is halted, it will be useful to be able to inspect the watchpoint config from the CLI. I’ve added two commands to assist with this:
-
dwt_dumpDisplays the current watchpoint configuration in the DWT -
dwt_resetResets the DWT configuration
C Code to Dump and Reset DWT
#include <stddef.h>
#include <stdint.h>

#include "hal/logging.h"

typedef struct {
  volatile uint32_t COMP;
  volatile uint32_t MASK;
  volatile uint32_t FUNCTION;
  volatile uint32_t RSVD;
} sDwtCompCfg;

typedef struct {
  volatile uint32_t CTRL;
  volatile uint32_t CYCCNT;
  volatile uint32_t CPICNT;
  volatile uint32_t EXCCNT;
  volatile uint32_t SLEEPCNT;
  volatile uint32_t LSUCNT;
  volatile uint32_t FOLDCNT;
  volatile const  uint32_t PCSR;
  sDwtCompCfg COMP_CONFIG[];
} sDWTUnit;

static sDWTUnit *const DWT = (sDWTUnit *)0xE0001000;

void dwt_dump(void) {
  EXAMPLE_LOG("DWT Dump:");
  EXAMPLE_LOG(" DWT_CTRL=0x%x", DWT->CTRL);

  const size_t num_comparators = (DWT->CTRL>>28) & 0xF;
  EXAMPLE_LOG("   NUMCOMP=0x%x", num_comparators);

  for (size_t i = 0; i < num_comparators; i++) {
    const sDwtCompCfg *config = &DWT->COMP_CONFIG[i];

    EXAMPLE_LOG(" Comparator %d Config", (int)i);
    EXAMPLE_LOG("  0x%08x DWT_FUNC%d: 0x%08x",
                &config->FUNCTION, (int)i, config->FUNCTION);
    EXAMPLE_LOG("  0x%08x DWT_COMP%d: 0x%08x",
                &config->COMP, (int)i, config->COMP);
    EXAMPLE_LOG("  0x%08x DWT_MASK%d: 0x%08x",
                &config->MASK, (int)i, config->MASK);
  }
}


void dwt_reset(void) {
  const size_t num_comparators = (DWT->CTRL>>28) & 0xF;

  for (size_t i = 0; i < num_comparators; i++) {
    sDwtCompCfg *config = &DWT->COMP_CONFIG[i];
    config->FUNCTION = config->COMP = config->MASK = 0;
  }
}
Inspecting watchpoints configured with GDB
Let’s configure the watchpoints from above and examine the watchpoint configuration:
(gdb) watch *(uint8_t *)0x20000001
Hardware watchpoint 1: *(uint8_t *)0x20000001
(gdb) watch *(uint16_t *)0x20000000
Hardware watchpoint 2: *(uint16_t *)0x20000000
(gdb) watch *(uint8_t[4] *)0x20000010
Hardware watchpoint 3: *(uint8_t[16] *)0x20000010
(gdb) rwatch *(uint8_t[16] *)0x20000020
Hardware read watchpoint 4: *(uint8_t[16] *)0x20000020
(gdb) c
Continuing.
[...]
Sending packet: $Z2,20000000,2#98...Packet received: OK
Sending packet: $Z2,20000001,1#98...Packet received: OK
Sending packet: $Z2,20000010,4#c8...Packet received: OK
Sending packet: $Z3,20000020,10#ca...Packet received: OK
Sending packet: $c#63...
We see three Z2 commands to install write watchpoints and one Z3 command to install a read watchpoint. The kind values of 0x2, 0x1, 0x4, 0x10 line up with the sizes we requested as well.
Examining SEGGER JLinkGDBServer Configuration
Let’s dump the config from the CLI and see how SEGGER’s JLinkGDBServer did configuring our requests!
shell> dwt_dump
DWT Dump:
 DWT_CTRL=0x40000001
   NUMCOMP=0x4
 # Config for "watch *(uint8_t[4] *)0x20000010"
 Comparator 0 Config
  0xe0001028 DWT_FUNC0: 0x00000006
  0xe0001020 DWT_COMP0: 0x20000010
  0xe0001024 DWT_MASK0: 0x00000002
 # Config for "rwatch *(uint8_t[16] *)0x20000020"
 Comparator 1 Config
  0xe0001038 DWT_FUNC1: 0x00000a05
  0xe0001030 DWT_COMP1: 0x20000020
  0xe0001034 DWT_MASK1: 0x00000002
 # Config for "watch *(uint8_t *)0x20000001"
 Comparator 2 Config
  0xe0001048 DWT_FUNC2: 0x00000006
  0xe0001040 DWT_COMP2: 0x20000001
  0xe0001044 DWT_MASK2: 0x00000000
 # Config for "watch *(uint16_t *)0x20000000"
 Comparator 3 Config
  0xe0001058 DWT_FUNC3: 0x00000006
  0xe0001050 DWT_COMP3: 0x20000000
  0xe0001054 DWT_MASK3: 0x00000001
For the most part, things look like they line up with expectations. For the read watchpoint at 0x20000020, we expect to see 0x00000006 for DWT_FUNC1 but some extra bits were left set. These bits map to DATAVSIZE which is not used in our current config and LNK1ENA which is a read only bit so these settings are fine.
What is more problematic is the DWT_MASK2 setting. It should be 4 to watch the 16 bytes that were requested. However, it was set to 2. It appears there is a limitation in the SEGGER watchpoint implementation and only 1, 2, and 4-byte watchpoints work!
Advanced Topics
Configuring Watchpoints in C Code
It’s also possible to generate watchpoints from C code. Here’s a function that does just that:
void dwt_install_watchpoint(
    int comp_id, uint32_t func, uint32_t comp, uint32_t mask) {
  const size_t num_comparators = (DWT->CTRL>>28) & 0xF;
  if (comp_id > num_comparators) {
    EXAMPLE_LOG("Invalid COMP_ID of %d", comp_id);
    return;
  }

  sDwtCompCfg *config = &DWT->COMP_CONFIG[comp_id];
  config->COMP = comp;
  config->MASK = mask;
  // set last since this will enable the comparator
  config->FUNCTION = func;
}
For example, we can enable one over the first 16 bytes of the g_array at address 0x200029a0 that we were examining earlier:
shell> watchpoint_set 0 6 0x200029a0 4
# Access at offset 16 should not halt since we are only watching the first 16 bytes
shell> arr_write 16 1
Write - Addr: 0x200029b0, Index: 16, Value: 0x00000001

# Access to an array we are watch
shell> arr_write 15 2
Write - Addr: 0x200029af, Index: 15, Value: 0x00000002
# Debugger should have halted
As expected, our debugger halts:
Program received signal SIGTRAP, Trace/breakpoint trap.
prv_arr_write () at ./src/shell_commands.c:146
146   return 0;
(gdb)
One useful thing here is since the watchpoint is not registered through GDB or the gdbserver, the system will always halt when a watchpoint event is emitted by hardware. This means you can use watchpoint features not supported by the debugger (such as watchpoints of larger sizes).
Extending Watchpoint Functionality with GDB Python
Since the DWT peripheral has some interesting configurations not natively supported with GDB, there’s also an opportunity for us to extend the current behavior by making use of GDB’s Python API!
We’ll add support for regular watchpoints with some extra validation to make sure we have requested a valid region and an example of a “data value” watchpoint under a watch_ext GDB CLI command. Below you can find the code needed in it’s entirety:
# gdb_watchpoint_ext.py
try:
    import gdb
except ImportError:
    raise Exception("This script can only be run within gdb!")

import argparse
import math
import struct


class DwtWatchpointException(Exception):
    pass


DWT_CTRL = 0xE0001000
DWT_COMP_BASE = 0xE0001020
DWT_MASK_BASE = 0xE0001024
DWT_FUNC_BASE = 0xE0001028


class Dwt:
    @staticmethod
    def _write_memory(addr, value):
        gdb.selected_inferior().write_memory(addr, struct.pack("<I", value))

    @classmethod
    def _write_dwt_comp_reg(cls, reg_base, comp_id, value):
        addr = reg_base + 16 * comp_id
        cls._write_memory(addr, value)

    @classmethod
    def set_addr_watchpoint(cls, addr, size):
        if addr % size != 0:
            raise DwtWatchpointException("Address needs to be aligned by size")
        if size & (size - 1) != 0:
            raise DwtWatchpointException("size must be power of 2")

        mask = int(math.log(size, 2))

        # For example purposes always use comparator 0 and overwrite
        # what was there previously.
        comp_id = 0
        cls._write_dwt_comp_reg(DWT_COMP_BASE, comp_id, addr)
        cls._write_dwt_comp_reg(DWT_MASK_BASE, comp_id, mask)
        func = 0x6  # Install a write watchpoint
        cls._write__write_dwt_comp_reg(DWT_FUNC_BASE, comp_id, func)

    @classmethod
    def set_data_value_watchpoint(cls, value, size):
        if size not in [1, 2, 4]:
            raise DwtWatchpointException(
                "Pattern watch must be a byte, half-word, or word in size"
            )

        # For values with a size less than a word, the value must be copied
        # into the other parts of the comparator register
        if size == 2:
            value = value | (value << 16)
        elif size == 1:
            value = value | value << 8 | value << 16 | value << 24

        # For Cortex-M4's data value matching is only supported in comparator 1
        comp_id = 1
        cls._write_dwt_comp_reg(DWT_COMP_BASE, comp_id, value)
        cls._write_dwt_comp_reg(DWT_MASK_BASE, comp_id, 0)

        # The range scanned can be filtered with other comparators
        # or disabled by setting the value to the comparator being
        # used. For this example, let's just disable:
        #   DATAVADDR0 (bits[19:16]) = comp_id
        #   DATAVADDR1 (bits[15:12]) = comp_id
        #
        # Rest of Config:
        #   DATAVSIZE (bits[11:10]) = size >> 1
        #   DATAVMATCH (bit[8]) = 1
        #     Encoding is 00 (byte), 01 (half-word), 10 (word)
        #   FUNCTION = 0x6 for a write-only watchpoint
        datavsize = (size >> 1) << 10
        func = (comp_id << 16) | (comp_id << 12) | (1 << 8) | datavsize | 0x6
        cls._write_dwt_comp_reg(DWT_FUNC_BASE, comp_id, func)


class GdbArgumentParseError(Exception):
    pass


class GdbArgumentParser(argparse.ArgumentParser):
    """Wrap argparse so gdb doesn't exit when a command fails """

    def exit(self, status=0, message=None):
        if message:
            self._print_message(message)
        # Don't call sys.exit()
        raise GdbArgumentParseError()


class WatchpointExtensionCliCmd(gdb.Command):
    """Extension of  GDB's watch for Cortex-M """

    def __init__(self):
        super(WatchpointExtensionCliCmd, self).__init__("watch_ext", gdb.COMMAND_USER)

    def complete(self, text, word):
        # We expect the argument passed to be a symbol so fallback to the
        # internal tab-completion handler for symbols
        return gdb.COMPLETE_SYMBOL

    def invoke(self, unicode_args, from_tty):
        # We can pass args here and use Python CLI utilities like argparse
        # to do argument parsing
        parser = GdbArgumentParser(
            description="Additional Cortex-M Watchpoint Utilities"
        )

        parser.add_argument(
            "-c", "--comp", help="The memory address or value to watch for"
        )
        parser.add_argument("-s", "--size", help="The size to watch")
        parser.add_argument(
            "--compare-value",
            type=bool,
            help="Watch for value written instead of address written",
        )

        try:
            args = parser.parse_args(list(filter(None, unicode_args.split(" "))))
        except GdbArgumentParseError:
            return

        comp = int(args.comp, 0)
        size = int(args.size, 0)

        if not args.compare_value:
            print("Setting Address Watchpoint")
            Dwt.set_addr_watchpoint(comp, size)
        else:
            print("Setting Data Value Watchpoint")
            Dwt.set_data_value_watchpoint(comp, size)


WatchpointExtensionCliCmd()
The commands can be added to a GDB session by sourcing the script:
# Script is at $INTERRUPT_REPO/examples/watchpoints/gdb_watchpoint_ext.py
(gdb) source gdb_watchpoint_ext.py
This script implements two utilities:
-
watch_ext -c <address_to_watch> -s <size>: This is equivalent to GDB’swatch *(uint8_t[<size>] *)<address_to_watch>except that a helpful error is raised if the configuration requested is invalid due to the limitations we discussed above and that the system will always halt on the write access rather than only halting when a value changes. -
watch_ext -c <pattern_to_watch> -s <size> --compare-value: This command will halt anytime<pattern_to_watch>is stored somewhere in RAM. Thesizeis the size of the pattern and must be 1, 2, or 4 bytes. There’s no way to configure something like this with GDB directly!
At the moment there is no command to disable the watchpoints once enabled or track “Old Value” and “New Value” like GDB does natively. Both are do-able in GDB python and are left as an exercise to the reader.
Data Value Watchpoint Example Using GDB Python
Inside the math_example CLI command, I’ve hidden a write of a special pattern when the recursion level is 10:
  if (n == 10) {
    work_buf[0] = 0xbadcafe;
  }
Let’s see if we can use the Cortex-M “data value” watchpoint functionality we added to the watch_ext command to halt when the 0xbadcafe pattern is written:
Source the GDB Script
# Script is at $INTERRUPT_REPO/examples/watchpoints/gdb_watchpoint_ext.py
(gdb) source gdb_watchpoint_ext.py
(gdb) watch_ext --help
usage: [-h] [-c COMP] [-s SIZE] [--compare-value COMPARE_VALUE]

Additional Cortex-M Watchpoint Utilities

optional arguments:
  -h, --help            show this help message and exit
  -c COMP, --comp COMP  The memory address or value to watch for
  -s SIZE, --size SIZE  The size of the address to watch
  --compare-value COMPARE_VALUE
  Watch for value written instead of address written
Enable Data Value Watchpoint And Test
(gdb) watch_ext -c 0xbadcafe -s 4 --compare-value 1
Setting Data Value Watchpoint
(gdb) c
shell> math_example 30
Running math_function()
# Debugger should have halted
Program received signal SIGTRAP, Trace/breakpoint trap.
0x000007c6 in math_function (n=1006295455, n@entry=-1111622150) at ./src/shell_commands.c:82
82    for (size_t i = 0; i < sizeof(work_buf)/sizeof(work_buf[0]); i++) {
(gdb)
(gdb) p/x work_buf
$1 = {0xbadcafe, 0xa0a0a0a, 0xa0a0a0a}
Neat, we can see the system has halted on the write of the 0xbadcafe pattern!
Final Thoughts
I hope this post taught you something new about watchpoints or got you thinking about how to use them to speed up debug the next time you face a weird memory corruption bug!
I’d be curious to hear if you are making use of the watchpoints in interesting ways for your product or if there are other items you would have liked to see covered on the topic. Either way, let us know in the discussion area below!
See anything you'd like to change? Submit a pull request or open an issue on our GitHub
Further Reading
I haven’t found too many resources about watchpoints on the web, but here’s a few other articles on the topic I’ve enjoyed:
- Examining The Stack For Fun And Profit
- Making use of Cortex-M watchpoints at Runtime
- Configuring watchpoints for ARM in eclipse
References
 Chris Coleman is a founder and CTO at Memfault. Prior to founding Memfault, Chris worked on the embedded software teams at Sun, Pebble, and Fitbit.