
Real-Time Video on Embedded Linux Cameras with WebRTC
The purpose of this article is to give readers an overview of various video software stacks used in embedded IP Camera applications. Then, we’ll specifically dive into real time video streaming, tools used to implement those kinds of systems, and how you can monitor and optimize their performance, using Memfault.
Table of Contents
Background
There are two main categories that most camera applications fit into:
- Real Time Video Streaming: examples include cameras used for video calls. These applications optimize for a quick Time to First Frame (TTFF) and low latency, at the expense of video quality (e.g. frame rate, resolution). Users want some video now even if it means sacrificing clarity.
- Recording: examples include capturing video for viewing later, such as a consumer camera for recording content to an SD card or memory stick. These applications optimize for video quality, at the expense of higher processing delays - users may need to wait until video capture is complete to view anything.
These two categories are generally at odds with each other because they pull the design in opposite directions. Prioritizing a quick TTFF means the first video frame must be encoded and sent over a remote IP link as fast as possible. A smaller, lower-resolution frame is quicker to encode and transmit than a larger, high-resolution one, so optimizing for TTFF pushes the design toward lower quality. Recording applications have the opposite goal: they can afford extra processing time to preserve resolution and frame rate since nobody is waiting on the first frame.
However, a single device could support both modes by streaming video through different pipelines that optimize for different constraints. A common example is an IP Camera for home security. Using a single device, a user may want to see their home in real-time to communicate with a person at their front door right now, or they may need high quality video from that same camera, to use as evidence in legal proceedings in the weeks or months following a break-in.
The remainder of this article will focus on real time streaming, and how to monitor the related services.
Real Time Video and WebRTC
Real Time video is challenging for a multitude of reasons, some of which - but certainly not all - I’ll list below. In many of these cases - and for the rest of this article - I’ll use the example of a user using a PC web app to try to remotely (i.e. from a different LAN) view a video stream from a security IP camera that’s inside their home.
- Peer to Peer Access: most devices are connected to the internet via a NAT (e.g. home Wi-Fi router) that doesn’t allow external devices to establish connections to its downstream devices. In other words, the IP Camera cannot establish a direct connection to transmit bytes to the computer, nor can the computer directly connect to the camera to receive bytes. Furthermore, devices might not even know their own IP address on the public internet, to share with their peer.
- Link Quality: both devices are often connected wirelessly, over a potentially bandwidth limited link, which both devices need to adapt to, even if it changes mid-stream. The camera should always try to send the highest quality video it can, for the best user experience, but of course subject to what’s achievable via the available link.
- Communication Standards: devices and clients may support different sets of video encodings, quality, frame rates, security protocols, etc.
WebRTC is a common, standardized framework (W3C’s “WebRTC: Real-Time Communication in Browsers”1, or IETF RFC88252), with numerous implementations for embedded devices (webrtcbin3, liburtc, libpeer, metaRTC), that defines a system to solve these problems. It establishes handshakes and coordination to inform each peer - e.g. camera and PC web app - how the other can be accessed, what capabilities exist, and how the state of the link is changing. Below is an architecture diagram of the devices and servers involved, as well as a description of the flow of information between those parties.
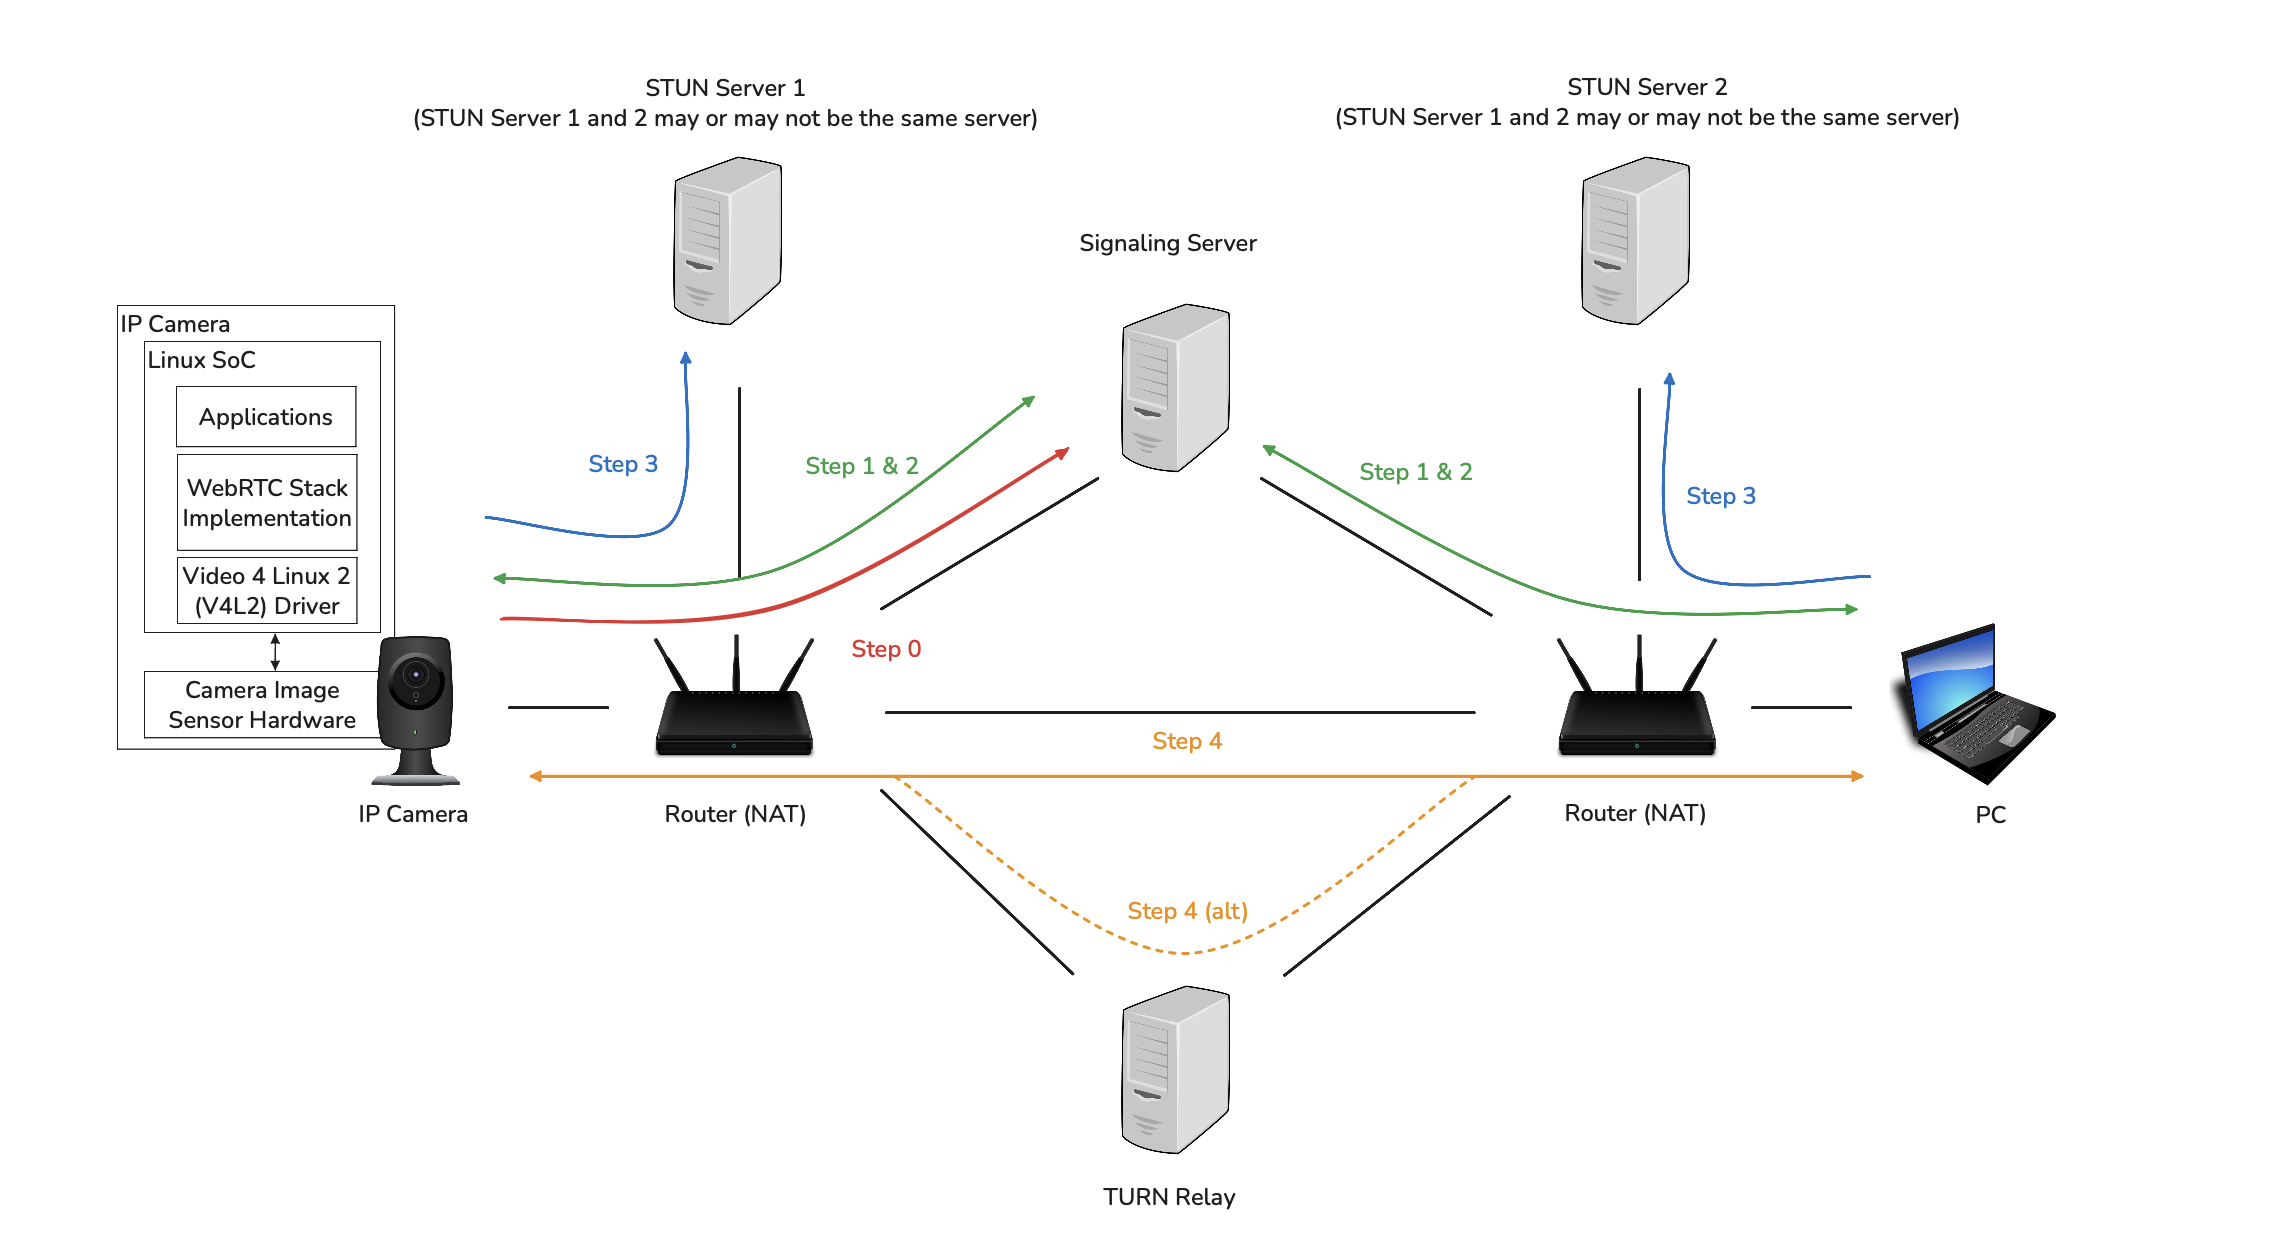
Figure 1: A standard System Diagram of the components involved in a WebRTC session/negotiation.
Note: the routers themselves are not actively doing any work here; they are merely forwarding messages to and from their LAN devices, per the NAT traversal policies - just like any other client <-> router interaction.
| Step | Description |
|---|---|
| 0 | (precondition) The IP Camera and viewer Web App - which are usually provided by the same manufacturer - open a connection to the Signaling Server, which is also generally owned/controlled/contracted by the product manufacturer. This gives devices an intermediary through which to communicate, despite being behind NATs. |
| 1 | The user on the PC Web App requests to start a stream - the request is sent from the PC to the Signaling Server, which then sends it to the IP Camera; this exchange also includes Session Description Protocol (SDP) Offer/Answers, which include information about supported media features, security protocols, and more. |
| 2 | Leveraging the STUN servers - which are simple services that devices can call from behind a NAT to determine their own public-IP identity - devices gather and send information (Interactive Connectivity Establishment, or “ICE” candidates) about how they can be reached, again, to each other via the Signaling Server. |
| 3 | Devices negotiate a pathway (which may be UDP-based, hence avoiding the term “connection”) via which to stream; preference is given to a direct, peer-to-peer connection, if NAT-traversal is possible; otherwise, the TURN relay is used to forward packets via existing connections initiated from respective peer devices to the TURN server. |
| 4 | Using the negotiated connectivity method, video data begins flowing from the camera to the PC! |
Monitoring and Optimizing Performance
As discussed in the first section, TTFF is of primary concern to many real time applications. Generally speaking, users easily become impatient with slow, unresponsive interfaces, and more saliently, if you get a notification that a burglar is breaking into your home, you want to instantly see what’s going on. While it generally wouldn’t monitor your Web or Mobile App (the viewer), Memfault (see Integrating Memfault into an Embedded Linux Project for setup on a Raspberry Pi) can be used to monitor and optimize your TTFF, insofar as your embedded device sees it, and break down the various aspects of that KPI, so you can identify and resolve bottlenecks.
I’ve published a very stripped-down, highly simplified WebRTC demo at https://github.com/jakegwood/gst-webrtc-camera-demo which runs on an RPi. More details can be found in the README, but the major simplifications are as follows:
- Signaling server, web page server, and camera sender service run on the same RPi hardware
- Assumes all systems, (except the STUN server and some webpage js dependencies) are on the LAN
- Signaling and the web-page server (which communicate on the LAN) use plaintext, and are unauthenticated
Below, I include a diagram of the system, and a description of the points that are being monitored by Memfault, as well as a screenshot of the very simple web UI. Following along with the demo hands-on is optional.
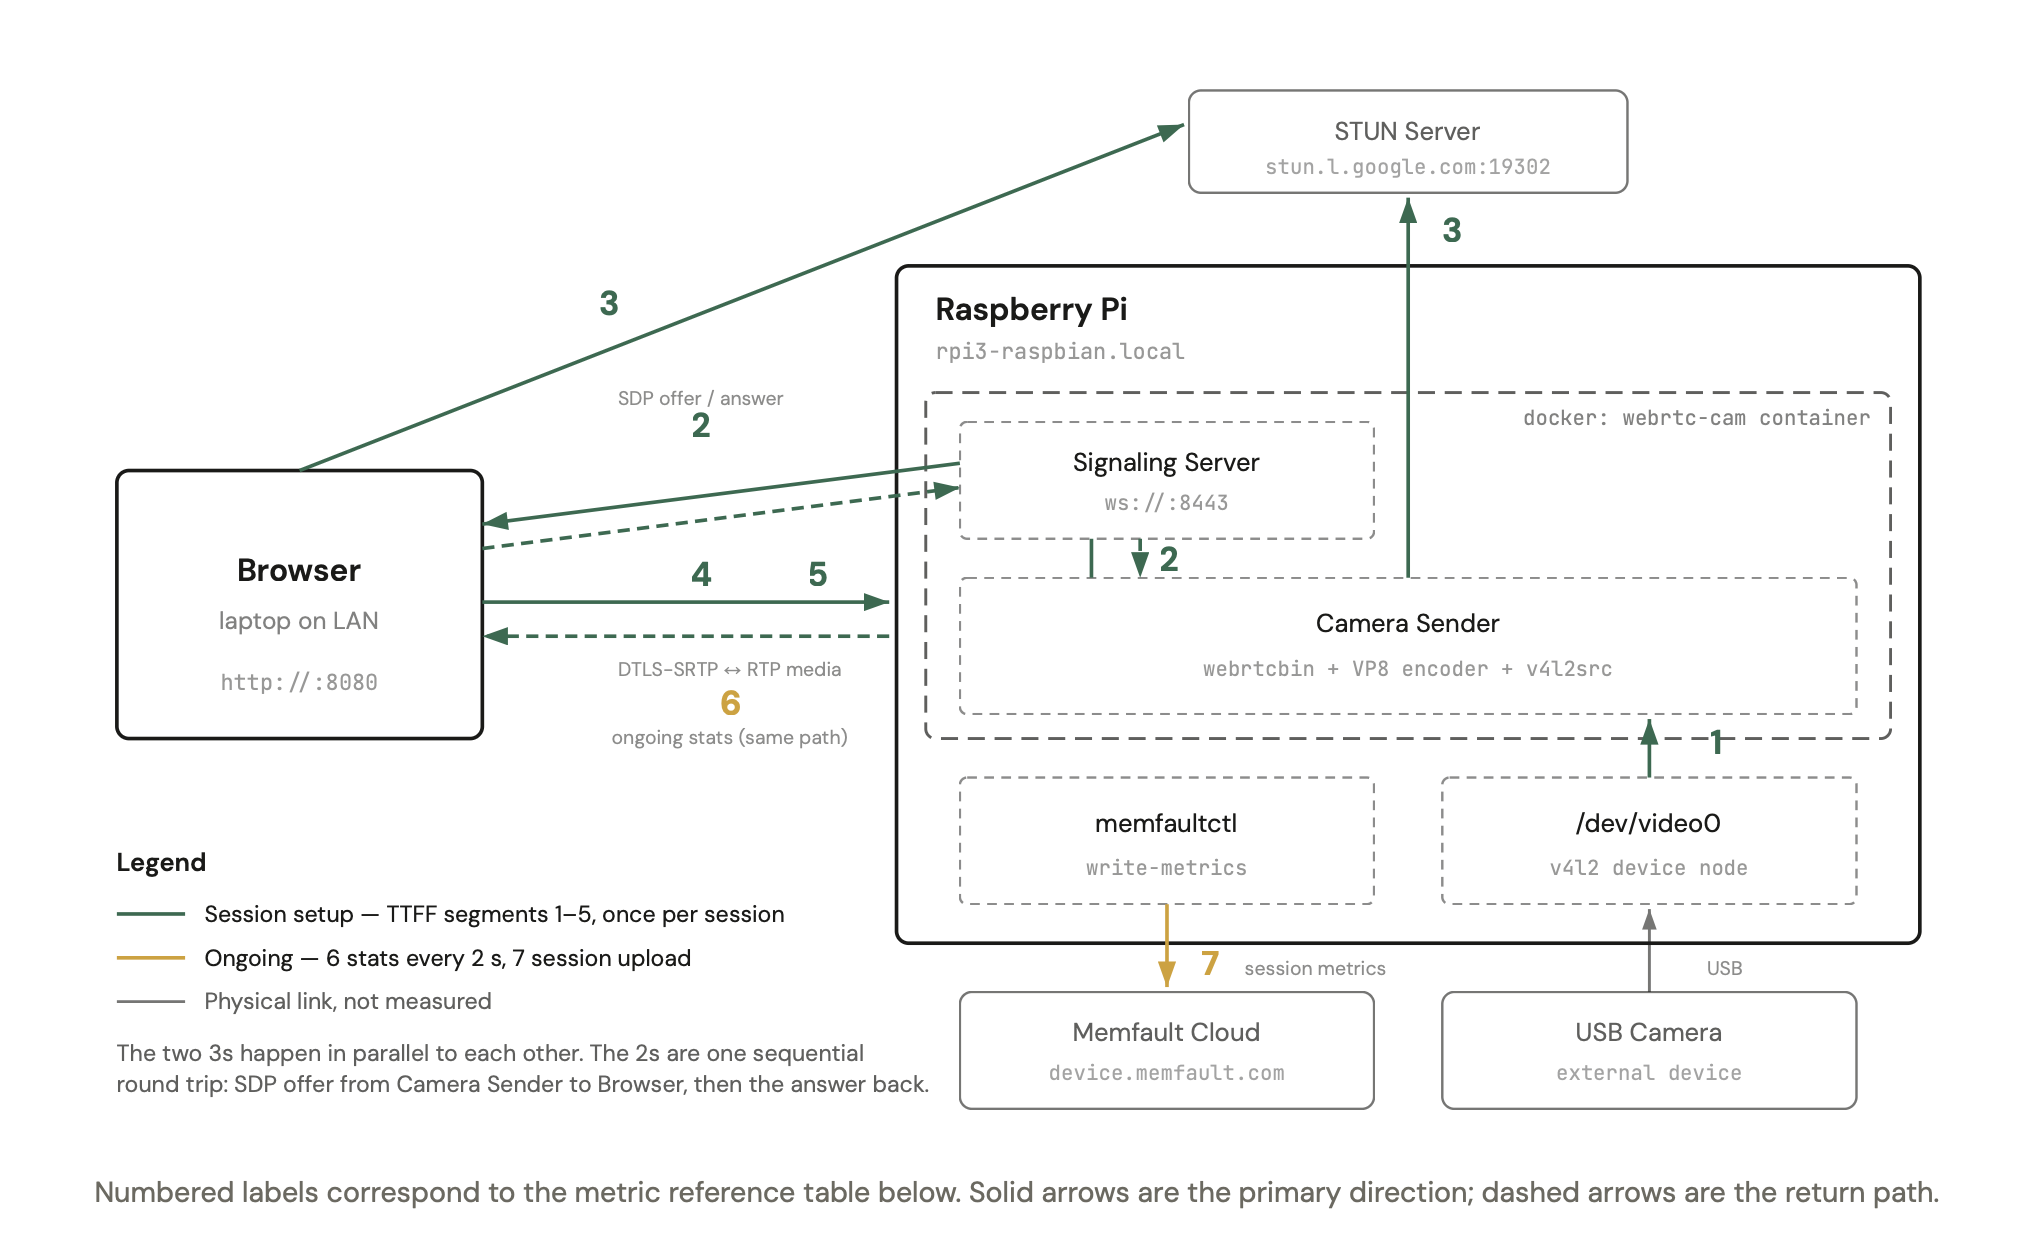
Figure 2: Block diagram for the highly simplified WebRTC system I implemented on a single RPi, to be used on the same LAN with a personal computer on the same LAN.
Note: while this simplifies and omits some components (such as the TURN server) not needed on a LAN, it still demonstrates some of the key handshakes in WebRTC streaming and link management.
The table below provides names and descriptions for the times that are measured
by the camera sender and reported to Memfault. Each metric is the time between
two named marks (shown in parentheses in the Description), as defined in
memfault_metrics.py:26-33;
“Source” links to where those marks are recorded in the repo linked above, as a
sample you can leverage in your project.
| Metric | Description | Label | Source |
|---|---|---|---|
negotiation_setup_ms |
Pipeline creation + VP8 encoder init (t0 → offer_created) | 1 | webrtc_sendrecv.py:241 |
signaling_rtt_ms |
Signaling round-trip as seen by Camera Sender: offer sent → answer received (includes browser processing + relay hops) | 2 |
webrtc_sendrecv.py:227, webrtc_sendrecv.py:535
|
ice_ms |
ICE candidate exchange + connectivity checks (answer_received → ice_connected) | 3 | webrtc_sendrecv.py:291 |
dtls_ms |
DTLS-SRTP handshake (ice_connected → dtls_connected) | 4 | webrtc_sendrecv.py:298 |
media_start_ms |
First RTP packet observed as sent, via a webrtcbin stats poll every 10 ms (dtls_connected → first_rtp) |
5 | webrtc_sendrecv.py:325 |
ttff_total_ms |
Device-side total time-to-first-frame (t0 → first_rtp); NB: the segments above are contiguous and never overlap, but the short interval between creating and sending the offer (offer_created → offer_sent) is not tracked as its own segment, so the segments always sum to slightly less than the total (by 1.5–9.4 ms in the following examples).
|
1–5 | memfault_metrics.py:32 |
video_bitrate_kbps, rtt_ms
|
Ongoing streaming stats, sampled from webrtcbin every 2 s during the stream and sent to memfaultd over StatsD; Memfault aggregates them over the session |
6 |
memfault_metrics.py:142, memfault_metrics.py:149
|
| (all of the above) | Session metrics: the TTFF segments are written with memfaultctl write-metrics, and memfaultd uploads everything in the session to Memfault Cloud |
7 | memfault_metrics.py:123 |
All of these metrics will be reported to Memfault as part of a Memfault
session named live-view, so statistics are intuitively grouped by each time
a user requests to view a live stream from their camera. For more on choosing
device-side KPIs, see Counting Crashes to Improve Device
Reliability.
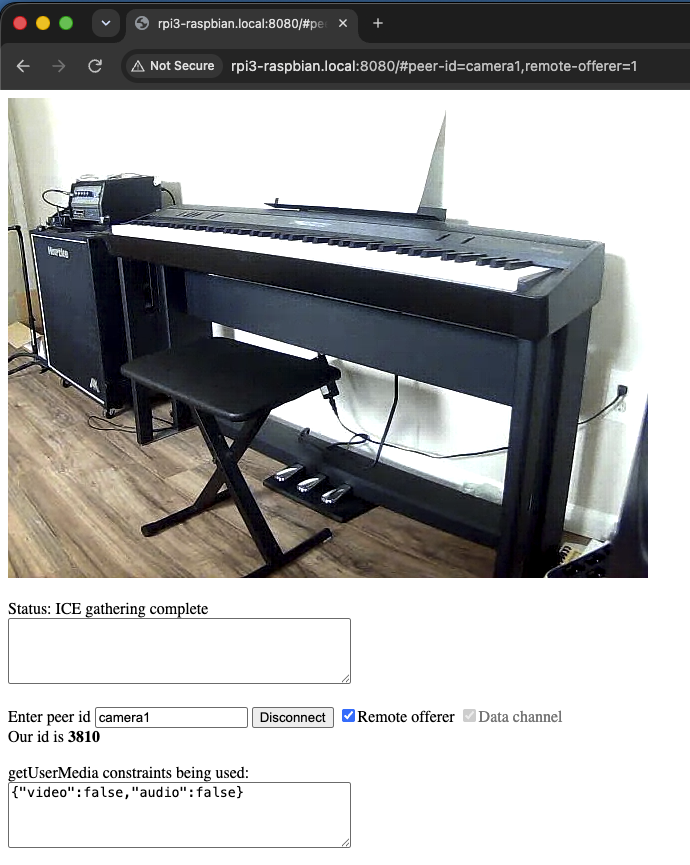
Figure 3: If you set up the system locally on your RPi, it will host a page you can navigate to and view a video stream coming from the webcam connected to your RPi, as you can see here (in Firefox).
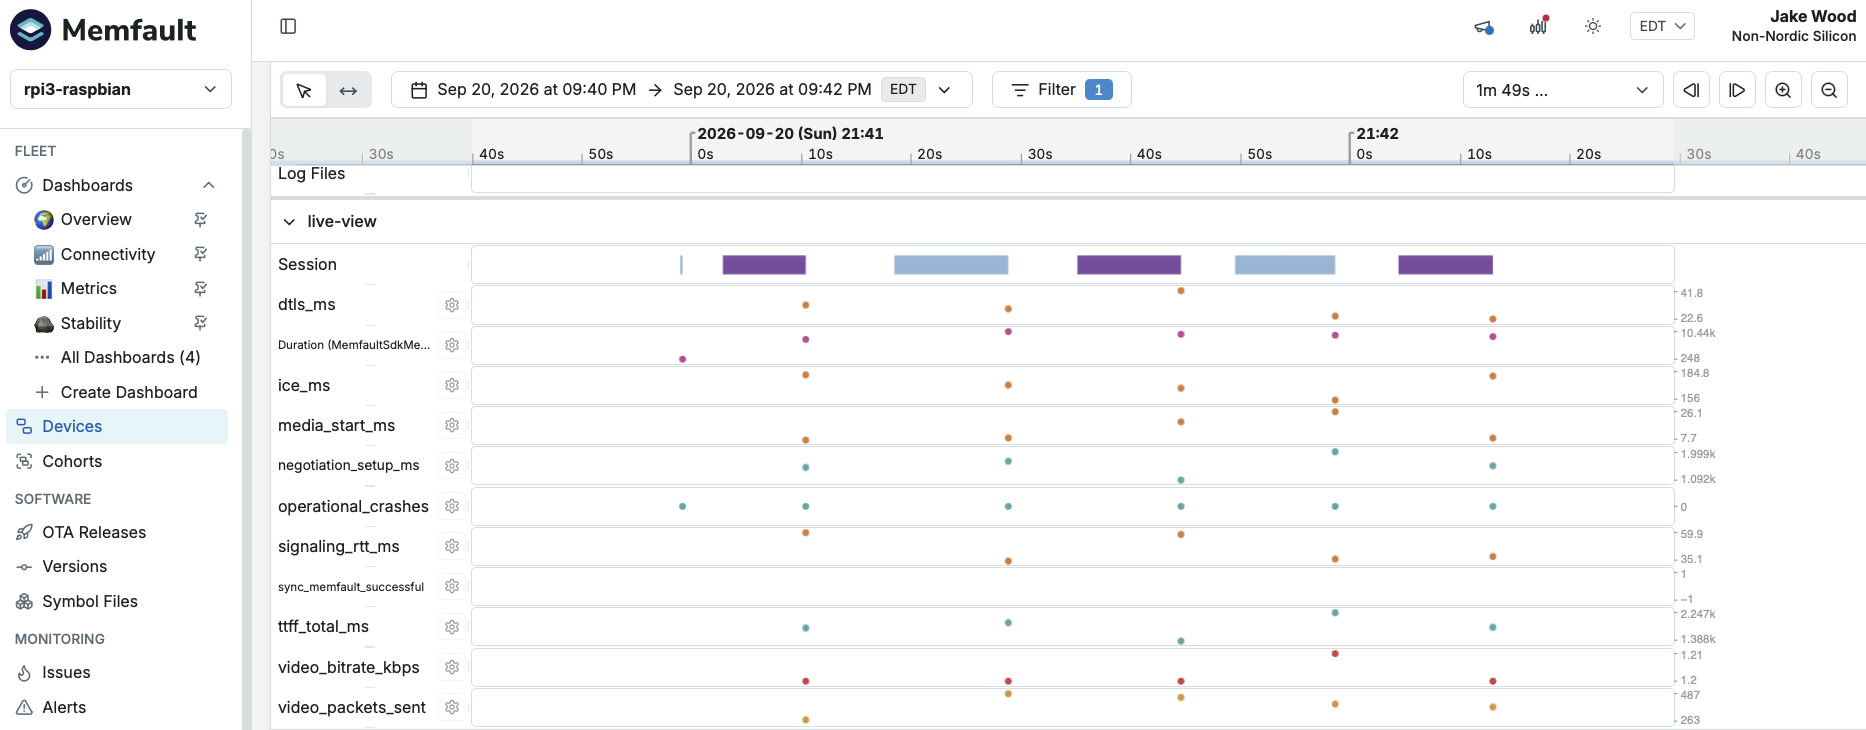
Figure 4: A sample screenshot of my Memfault Timeline view after clicking connect/disconnect in the above web UI for a few iterations.
With this system up and running on my RPi3 (streaming 640×480 MJPEG from the webcam, encoded to VP8 in software), and Firefox open to the page, I clicked connect/disconnect five times, collecting data on five video streaming iterations, with the following results:
| Session | Negotiation Setup | Signaling RTT | ICE | DTLS | Media Start | TTFF Total |
|---|---|---|---|---|---|---|
| 1 | 1273.6 | 78.8 | 260.0 | 29.9 | 5.3 | 1657.0 |
| 2 | 1388.9 | 42.4 | 134.4 | 34.9 | 11.0 | 1617.0 |
| 3 | 1180.2 | 104.3 | 182.5 | 38.7 | 6.3 | 1517.9 |
| 4 | 1046.0 | 50.2 | 122.4 | 36.3 | 14.8 | 1277.2 |
| 5 | 1378.1 | 143.2 | 105.6 | 34.7 | 5.1 | 1674.6 |
| Avg | 1253.4 | 83.8 | 161.0 | 34.9 | 8.5 | 1548.7 |
| Min | 1046.0 | 42.4 | 105.6 | 29.9 | 5.1 | 1277.2 |
| Max | 1388.9 | 143.2 | 260.0 | 38.7 | 14.8 | 1674.6 |
One obvious standout from this data that I realized (I swear, I genuinely learned this right alongside you - this wasn’t planned for the blog post!) is that the negotiation - which covers the camera daemons’ pipeline and process startup, up until the offer is created - is the clear bottleneck. To resolve that, I added a keep-alive mode that changes four things:
- The camera stays open. The camera is opened when the sender starts, so the sensor never re-initializes between viewers.
-
The encoder stays running. The source and encoder pipeline stays up
permanently; only
webrtcbinand one queue are added and removed for each viewer. -
The sender process persists. One-time, per-process costs - such as
GStreamer plugin loading and whatever
webrtcbininitializes on its first use - are paid once at startup, instead of for every viewer. - A keyframe is forced when a viewer attaches. Because the encoder has been running, the next frame is almost certainly a delta frame that the new viewer can’t decode. Without forcing a keyframe, a viewer could wait up to 2000 frames (about 66 s at 30 fps) for a decodable picture.
For those following along, I wrapped these changes in an ENV variable flag, so
you, too, could see the difference with and without them. Stop the service with
stop.sh and restart it with start.sh --keep-alive to enable these changes.
Again, connecting/disconnecting five times, I collected the following data.
| Session | Negotiation Setup | Signaling RTT | ICE | DTLS | Media Start | TTFF Total |
|---|---|---|---|---|---|---|
| 1 | 1022.2 | 111.8 | 166.8 | 84.2 | 11.2 | 1402.8 |
| 2 | 45.2 | 173.9 | 137.3 | 116.1 | 5.8 | 479.8 |
| 3 | 44.1 | 44.9 | 133.1 | 38.6 | 10.0 | 273.7 |
| 4 | 37.8 | 89.9 | 134.3 | 22.6 | 6.3 | 296.4 |
| 5 | 36.3 | 119.0 | 151.8 | 27.6 | 6.2 | 347.0 |
| Avg (2–5) | 40.9 | 106.9 | 139.1 | 51.2 | 7.1 | 349.2 |
| Min (2–5) | 36.3 | 44.9 | 133.1 | 22.6 | 5.8 | 273.7 |
| Max (2–5) | 45.2 | 173.9 | 151.8 | 116.1 | 10.0 | 479.8 |
You can see that the first iteration still pays a one-time startup cost, but subsequently, the improvement is stark. Frames start leaving the device over one full second sooner. That’s a game-changing improvement for a critical customer KPI. Keep-alive isn’t free, of course, as the sensor, encoder, and various software components remain running all the time, whether or not they are actually needed, all consuming power, and making it a poor fit for battery-constrained devices. For devices with line-power, though, it is the obvious choice.
While that improvement resolved an issue with device behavior, there are
plenty of delays and bugs that can happen as a result of cloud service
dependencies. In this example I simulated delay between the camera and the
Signaling Server using tc
and its netem
(network emulator) qdisc, which adds 250 ms of delay to traffic going to and
from the Signaling Server:
# create an empty queue (1:4) for the traffic we want to delay
sudo tc qdisc add dev lo root handle 1: prio bands 4
# delay everything in queue 1:4 by 250 ms
sudo tc qdisc add dev lo parent 1:4 handle 40: netem delay 250ms

# Messages from "Camera Sender" to "Signaling Server"
sudo tc filter add dev lo protocol ip parent 1: prio 1 u32 \
    match ip protocol 6 0xff match ip dport 8443 0xffff flowid 1:4
# Messages from "Signaling Server" to "Camera Sender"
sudo tc filter add dev lo protocol ip parent 1: prio 2 u32 \
    match ip protocol 6 0xff match ip sport 8443 0xffff flowid 1:4

# after you've finished running tests with delay, don't forget to remove it
# with this command!
sudo tc qdisc del dev lo root
and then, still in keep-alive mode, collected the following results:
| Session | Negotiation Setup | Signaling RTT | ICE | DTLS | Media Start | TTFF Total |
|---|---|---|---|---|---|---|
| 1 | 39.4 | 539.4 | 177.4 | 27.2 | 6.0 | 791.0 |
| 2 | 44.5 | 527.9 | 99.5 | 26.2 | 5.3 | 705.4 |
| 3 | 40.5 | 600.6 | 340.8 | 105.9 | 5.2 | 1094.6 |
| 4 | 38.7 | 565.8 | 163.1 | 87.3 | 3.8 | 863.6 |
| 5 | 39.7 | 527.4 | 125.9 | 88.3 | 6.6 | 791.4 |
| Avg | 40.6 | 552.2 | 181.3 | 67.0 | 5.4 | 849.2 |
| Min | 38.7 | 527.4 | 99.5 | 26.2 | 3.8 | 705.4 |
| Max | 44.5 | 600.6 | 340.8 | 105.9 | 6.6 | 1094.6 |
Clearly, the round trip to the Signaling Server was impacted: average TTFF rose by 500 ms over the keep-alive baseline (349.2 → 849.2 ms), matching the two 250 ms delays added to the signaling path. In real life, an increase like this could represent a poor cellular connection, a congested home Wi-Fi network, or an overloaded server, depending on how it manifests. This is a powerful concept: while Memfault is not directly a cloud observability tool, it does allow you to turn your fleet of thousands or millions of IoT devices into external, independent observers. This fleet can track your cloud’s performance, identifying service or infrastructure issues that, (a) you aren’t measuring, or (b) your cloud can’t measure introspectively.
While the Signaling Server runs on the Pi for this demo, in reality - as illustrated in Figure 1 - that is a separate cloud service that all of your devices are wholly dependent on for streaming. Even if your cloud observability tools indicate a healthy instance, anything that causes delays between your devices and that service - whether or not inherent to the service itself - is a key concern for your business - something your devices, using Memfault, can alert on or use to trigger other workflows.
Conclusion
Like all interesting problems in IoT, real time video - and TTFF in particular - is not something you can measure once on the bench and forget. It is dependent on numerous different services, local wireless environments, various clients - such as browsers or mobile apps - that users use, and much, much more. Hopefully this overview helps you understand the components worth monitoring and how they can be used to drive optimizations in your system.
Further reading: for another look at embedded Linux observability, see A Practical Guide to Embedded Linux Logging.
See anything you'd like to change? Submit a pull request or open an issue on our GitHub
References
 Jake G. Wood is Director of Field Engineering at Nordic nRF Cloud. He has spent his career developing products in the semiconductor and electronics industries alongside customers and partners.