Firmware Static Analysis with CodeChecker
The pitfalls of C programming are well known: undefined behavior abounds, uninitialized variables lie in wait, memory leaks, and buffers overflow.
While we wait for the utopia of memory-safe languages, our best bet is to rely on tools to catch some of the more egregious errors in our code for us. Compiler warnings are a great place to start, but today I want to take it one step further and talk about static analysis.
Static analysis is simply the analysis of a piece of software while it is not executing. Some static analyzers are very simple, while other rely on symbolic execution to trace through code paths and find potential problems.
Many of you will be familiar with proprietary tools like Coverity or Klocwork for static analysis. Or perhaps you had to run Fortify to fulfill a requirement from your employer’s security team. However, an open source alternative has emerged recently: CodeChecker.
Codechecker1 is built on top of the excellent clang static analyzer, an open source tool with support for cross-translation-unit analysis and an impressive number of checkers. Adding CodeChecker to your product is easy, and is a quick way to catch a wide array of bugs in your code before they reach your customers.
In this post, I go over how to set up CodeChecker on a firmware project to reap the benefits of static analysis. I’ll also cover ways to deal with false positives, and configure your assert functions to be analysis-friendly.
Table of Contents
Setting up CodeChecker CodeChecker is a combination of two tools:
- The command-line
CodeCheckertool which can be used to start analysis runs on your firmware project - The CodeChecker database which collects data from your runs and lets you track false positives, and new issues as they crop up.
That last piece is crucial: static analyzers often generate loads of issues as well as some false positives when you first start using them. By tracking them in a database, you can look at what new issues are discovered in new changes and pull requests, and you can mute false positives rather than continuously see them in your results.
We’ll first install the command-line tool, and run it on our project.
Linux CLI Installation
CodeChecker is currently available on Linux and MacOSX. Windows is not
officially supported, though your mileage may vary.
Note: on Mac, CodeChecker requires disabling SIP, as it uses a man-in-the-middle approach to instrumenting your build. It does not currently work on M1 chips.
On Linux, here are some simple instructions from the CodeChecker documentation2:
# Install mandatory dependencies for a development and analysis environment.
# NOTE: clang or clang-tidy can be any sufficiently fresh version, and need not
#       come from package manager!
sudo apt-get install clang clang-tidy build-essential curl doxygen gcc-multilib \
      git python3-dev python3-venv

# Install nodejs dependency for web. In case of Debian/Ubuntu you can use the
# following commands. For more information see the official docs:
# https://nodejs.org/en/download/package-manager/
curl -sL https://deb.nodesource.com/setup_12.x | sudo -E bash -
sudo apt-get install -y nodejs

# Check out CodeChecker source code.
git clone https://github.com/Ericsson/CodeChecker.git --depth 1 ~/codechecker
cd ~/codechecker

# Create a Python virtualenv and set it as your environment.
make venv
source $PWD/venv/bin/activate

# Build and install a CodeChecker package.
make package

# For ease of access, add the build directory to PATH.
export PATH="$PWD/build/CodeChecker/bin:$PATH"

cd ..
Note: CodeChecker depends on Node 12.x, which is why you cannot simply install the latest node package from default repositories.
You should now be able to run CodeChecker from the command line:
$ CodeChecker -h
CodeChecker
usage: CodeChecker [-h] {analyze,analyzer-version,analyzers,check,checkers,cmd,fixit,log,parse,server,store,version,web-version} ...

Run the CodeChecker sourcecode analyzer framework.
Please specify a subcommand to access individual features.

[...]
Thereafter, you will need to source the Python virtual env in the codechecker
folder every new session before you use the tool:
$ source ~/codechecker/venv/bin/activate
(CodeChecker venv) $ CodeChecker -h
Using CodeChecker with your Project
Setup
In this post, we will use ChibiOS as our example project. ChibiOS is a popular RTOS with support for a wide variety of chips. Most importantly, it is relatively straightforward to set up and comes with lots of examples.
You can download the latest ChibiOS release from their
website, though I simply clone-d
it from GitHub:
$ git clone https://github.com/ChibiOS/ChibiOS/
You’ll need to install a few dependencies, like an ARM toolchain and the make
build system:
$ apt install gcc-arm-none-eabi make p7zip-full
Before you proceed, make sure to decompress the libraries in the ext folder:
$ cd ext
$ ls *.7z | xargs -I {} 7z x {}
At this point, you should be able to build an example. I will use
RT-STM32-LWIP-FATFS-USB:
$ cd demos/STM32/RT-STM32-LWIP-FATFS-USB
$ make -f make/stm32f769_discovery.make
[...]
Linking build/stm32f769_discovery/ch.elf
lto-wrapper: warning: Options to Xassembler do not match: -alms=./build/stm32f769_discovery/lst/crt1.lst, -alms=./build/stm32f769_discovery/lst/hal.lst, dropping all -Xassembler and -Wa options.
Creating build/stm32f769_discovery/ch.hex
Creating build/stm32f769_discovery/ch.bin
Creating build/stm32f769_discovery/ch.dmp

   text    data     bss     dec     hex filename
 126224     232  430496  556952   87f98 build/stm32f769_discovery/ch.elf
Creating build/stm32f769_discovery/ch.list

Done
Alright, we’ve got a project to statically analyze!
Running the analysis
CodeChecker uses a very neat technique to instrument your builds: it wraps your existing compiler and keeps track of what files are compiled in what order. This means that you do not need to setup a separate compiler or build target.
To get started, make sure you’ve sourced the virtual env:
$ source ~/codechecker/venv/bin/activate
Next set up the CC_LOGGER_GCC_LIKE environment variable to let CodeChecker
know that arm-none-eabi-gcc is just another GCC build.
$ export CC_LOGGER_GCC_LIKE=arm-none-eabi-gcc
You can now run the CodeChecker log command and pass it our standard build
invocation as an argument. Make sure you clean your build first, as any file
skipped in the rebuild will be ignored by CodeChecker:
$ make clean
$ CodeChecker log -b "make -f make/stm32f769_discovery.make" -o compilation.json
[INFO 2021-05-18 05:34] - Starting build ...
[... standard build output for your project ...]
[INFO 2021-05-18 05:34] - Build finished successfully.
This will produce a compilation.json file which contains the list of build
commands you’ve just executed.
Next, we must run the analysis itself. This is done with the analyze command,
which can be configured in a number of way. I will cover two of them:
-
--enable [default | sensitive | extreme]selects the sensitivity of the analysis. What it does under the hood is enable/disable individual checkers based on their false-positive rate. I recommendsensitive. -
--ctuenables cross-translation-unit analysis. A translation unit is a single C file, so without this flag the analysis only consider files one at a time. It is therefore not able to trace bugs that happen when functions from different files are used together. Enable CTU solves this issue, at the cost of a slower analysis run.
Putting those together, we get:
CodeChecker analyze ./compilation.json --output ./reports --enable sensitive --ctu
You might want to go grab yourself a coffee while this run, it can be pretty slow!
This command will create the reports folder with the output from your
analysis.
Note that CodeChecker can be run incrementally. For example, if we make a
change in a single file, we can re-run the log and analyze commands, they
will analyze that file only and update the data in reports.
Inspecting the results
Our reports are not yet human readable. To make sense of them, we finally use
the parse command.
CodeChecker parse ./reports --print-steps
[...]
----==== Summary ====----
[...]
-----------------------
Severity | Report count
-----------------------
MEDIUM   |           77
LOW      |           44
HIGH     |           24
-----------------------
----=================----
Total number of reports: 145
----=================----
As you can see, we’ve found 145 issues in our project, including 24 high severity issues (mostly uninitialized variables being used and null pointer dereferences).
With --print-steps we told the tool to print-out the execution steps to get
to the error. Inspecting this output, we can immediately see some real issues!
[HIGH] /root/ChibiOS/demos/STM32/RT-STM32-LWIP-FATFS-USB/source/web.c:57:15: The left operand of '>=' is a garbage value [core.UndefinedBinaryOperatorResult]
    if (buflen>=5 &&
              ^
  Report hash: 5976a48b4e0090847228a1fce0f5791a
  Steps:
     1, web.c:110:10: Entering loop body
     2, web.c:114:5: Calling 'http_server_serve'
     3, web.c:42:1: Entered call from 'http_server'
     4, web.c:45:3: 'buflen' declared without an initial value
     5, web.c:53:5: Calling 'netbuf_data'
     6, netbuf.c:195:1: Entered call from 'http_server_serve'
     7, netbuf.c:202:7: Assuming field 'ptr' is equal to NULL
     8, netbuf.c:203:5: Returning without writing to '*len'
     9, web.c:53:5: Returning from 'netbuf_data'
    10, web.c:57:15: The left operand of '>=' is a garbage value

Found 1 defect(s) in web.c
Let’s take a look at this code in more detail. You can find it on Github at ChibiOS/web.c at master · ChibiOS/ChibiOS · GitHub.
static void http_server_serve(struct netconn *conn) {
  struct netbuf *inbuf;
  char *buf;
  u16_t buflen;
  err_t err;

  /* Read the data from the port, blocking if nothing yet there.
   We assume the request (the part we care about) is in one netbuf */
  err = netconn_recv(conn, &inbuf);

  if (err == ERR_OK) {
    netbuf_data(inbuf, (void **)&buf, &buflen);

    /* Is this an HTTP GET command? (only check the first 5 chars, since
    there are other formats for GET, and we're keeping it very simple )*/
    if (buflen>=5 &&
        buf[0]=='G' &&
        buf[1]=='E' &&
        buf[2]=='T' &&
        buf[3]==' ' &&
        buf[4]=='/' ) {
...
Indeed we can see that the code does not check the return value of
netbuf_data, and in the event that function returns an error, buflen ends
up uninitialized. The fix is simple:
diff --git a/demos/STM32/RT-STM32-LWIP-FATFS-USB/source/web.c b/demos/STM32/RT-STM32-LWIP-FATFS-USB/source/web.c
index d2a8de056..61d8c4d73 100644
--- a/demos/STM32/RT-STM32-LWIP-FATFS-USB/source/web.c
+++ b/demos/STM32/RT-STM32-LWIP-FATFS-USB/source/web.c
@@ -50,16 +50,17 @@ static void http_server_serve(struct netconn *conn) {
   err = netconn_recv(conn, &inbuf);

   if (err == ERR_OK) {
-    netbuf_data(inbuf, (void **)&buf, &buflen);
+    err_t err = netbuf_data(inbuf, (void **)&buf, &buflen);

     /* Is this an HTTP GET command? (only check the first 5 chars, since
     there are other formats for GET, and we're keeping it very simple )*/
-    if (buflen>=5 &&
+    if (!err && (
+        buflen>=5 &&
         buf[0]=='G' &&
         buf[1]=='E' &&
         buf[2]=='T' &&
         buf[3]==' ' &&
-        buf[4]=='/' ) {
+        buf[4]=='/' )) {
We can now rerun our analysis:
(CodeChecker venv) $ CodeChecker log -b "make -f make/stm32f769_discovery.make" -o compilation.json
[INFO 2021-05-18 06:15] - Starting build ...
Compiling web.c
[...]
[INFO 2021-05-18 06:15] - Build finished successfully.

$ CodeChecker analyze ./compilation.json --output ./reports     --enable sensitive --ctu
[...]
[INFO 2021-05-18 06:15] - ----==== Summary ====----
[INFO 2021-05-18 06:15] - Successfully analyzed
[INFO 2021-05-18 06:15] -   clang-tidy: 1
[INFO 2021-05-18 06:15] -   clangsa: 1
[INFO 2021-05-18 06:15] - Reanalyzed compilation commands: 2
[INFO 2021-05-18 06:15] - Total analyzed compilation commands: 1
[INFO 2021-05-18 06:15] - ----=================----
[...]
[INFO 2021-05-18 06:15] - Analysis length: 0.5719277858734131 sec.
Thanks to incremental updates, this was very fast (0.5s)! CodeChecker no longer
finds issues in web.c:
$ CodeChecker parse ./reports-ctu-3 --print-steps | grep web.c
Found no defects in web.c
HTML Export
Wading through reports on the command line is not very ergonomic, so I
recommend you export the reports to HTML. This can be achieved with the
--export html flag within the parse command:
$ CodeChecker parse --export html --output ./reports_html ./reports
You can then open the resulting reports_html/index.html with your browser of
choice. This will give you a nice HTML UI with a list of all the defects, and
detailed views such as this one:
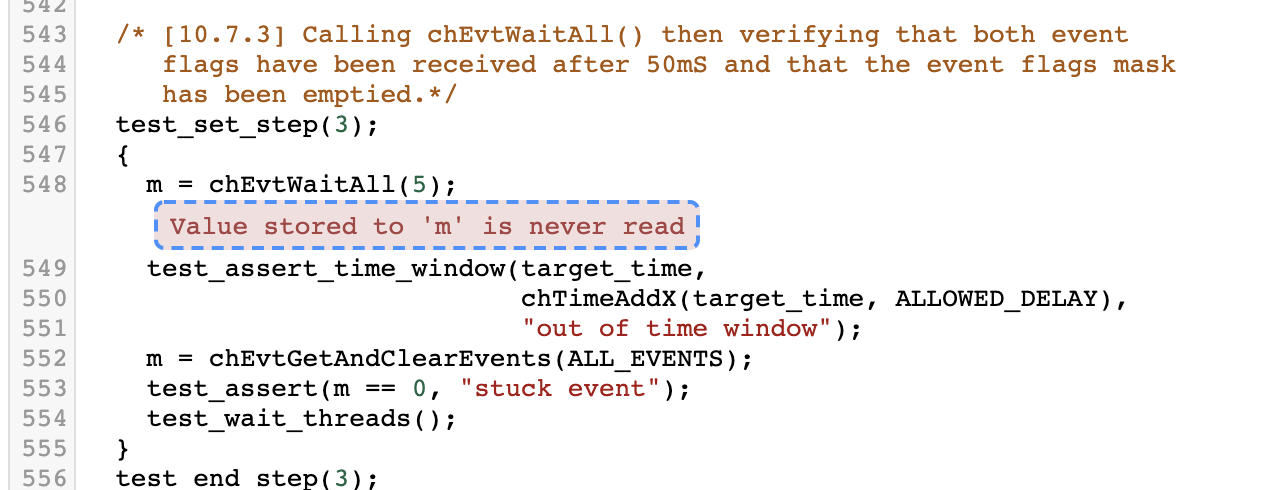
Dealing with false positives
The first time you run CodeChecker, you will get a good number of false positives. Most of the time this will be due to a code path which cannot actually happen in your program but is plausible to the analyzer.
There are two ways to deal with false positives: adding assert calls to your
code, and annotating the offending code paths with CodeChecker specific
comments.
Adding asserts
First, you should try adding assert calls to your code. Most projects have an
assert function which can be used to crash the program if an assumption is
violated (i.e. something that should never happen, happens). ChibiOS has such a
function, which it calls osalDbgAssert.
By adding assertions to your code, you tell the static analyzer that those code paths are invalid and it will not exercise them. For example, if you have:
osalDbgAssert(p != NULL, "invalid null pointer")
*p = 123;
CodeChecker will thereafter assume p is non-null and won’t report the
following line as a null pointer dereference.
For CodeChecker to identify a function as being an assertion, you need to
annotate it with the noreturn attribute. This is done with the
__attribute__ keyword:
void foo(void) __attribute__((noreturn));
CodeChecker annotations
If all else fails, you can add comments to tell CodeChecker to ignore an issue.
This is done by adding codechecker_suppress to your comment. For example:
void test() {
  int x;
  // codechecker_suppress [all] this is a false positive
  x = 1;
}
The following code would emit a “dead store” error without the comment. The syntax of the comment is as follow:
// codechecker_suppress [<checkers>] <note>
Where checkers is the list of checkers to disable (all for all checkers),
and note is a comment or note to explain why you disabled it.
While CodeChecker’s database can be used to track false positive, it is recommended to use comments and asserts as well so you do not lose all that state in the event the database is lost or reset.
Closing
Thank you for reading! I hope this post convinced you that static analysis is a great tool to add to your toolbelt. While false positives can be daunting, they can be managed with a few annotations and they should not discourage you from finding real errors with CodeChecker.
Next time, I will write about running static analysis in CI and I will introduce the CodeChecker database which can be used to track error state.
What do you think of CodeChecker? Do you use another static analysis tool you like? Tell us in the comments!
See anything you'd like to change? Submit a pull request or open an issue on our GitHub
References
 François Baldassari has worked on the embedded software teams at Sun, Pebble, and Oculus. He is currently the CEO of Memfault.