Share Your Debugging Scripts
One of my favorite ways to debug is to let GDB and a set of previously written Python scripts do all the work for me. These scripts could parse the heap and data structures, investigate fault registers, and paint an accurate picture of a system at the time of a crash.
Did I know how to assemble and make sense of all this knowledge myself using the debugger and a raw GDB prompt? Maybe 5-10%. What made this possible was a common set of GDB scripts that the team of firmware engineers improved constantly, and the project automatically loaded them into GDB when we launched the debugger. It was wonderful.
In this short-form post, I want to share how you can go about keeping a central gdbinit file that you can commit into your project’s repo and automatically source it in the popular editor and IDE environments that firmware engineers find themselves in today.
Table of Contents
Overview
Enabling the sharing of debugging techniques and scripts amongst the team is a 1 man-hour (and at max 1 day if you have a sad IDE or environment) effort to improve the productivity of every engineer on the team. The best way to do this is to share a project-level gdbinit script that is loaded automatically when GDB is launched. It’s even more powerful if the newly defined functions and commands have help menus and instructions about how to use them!
I won’t go into how to define custom GDB commands because we’ve written about it in a few posts. This post is about how to share custom commands easily with your team.
It all starts with a single project.gdbinit file that is committed into the project’s repository. When a debugger is launched with the project as its working directory, it can easily load the project.gdbinit on launch.
Automatically Loading .gdbinit Scripts
I will cover the three most popular debugging setups where a developer is typically using GDB. If you have a configuration that I have missed, I encourage you to either submit a pull request or leave a comment to help others!
GDB In the Shell
GDB can run startup commands at various phases in the load sequence. We can use these hooks to load GDB scripts at the right time and automatically.
The one thing I would recommend every project have is a common start-gdb.sh script or something equivalent, which wraps the GDB invocation. Having this script helps out in a few ways:
- It’s easy. Onboarding a new employee or having trouble recalling the exact launch sequence for debugging? Just run the simple script, which includes the latest and greatest functionality and scripts.
- It’s source-controlled. Required commands and arguments to GDB change over time. When checking out new or old revisions, you can always assume the
start-gdb.shscript is the right way to launch GDB. - It’s a consistent API. If one developer makes improvements or adds functionality, everyone on the team will immediately benefit without having to remember exactly how to invoke GDB.
- No stale Wiki pages or README’s. No questions in Slack about how to launch GDB now that pull-request #1234 has been merged.
These are the ways I like to load GDB scripts from favorite to least favorite.
Shared Shell Script
You can commit a shell script that everyone on the team uses to launch GDB and debug the firmware.
#!/bin/bash

SYMBOLS="$1"
arm-none-eabi-gdb-py $SYMBOLS -ix=tools/gdb/memfault.gdbinit
Then a member of the team can run it with the following (assuming it’s marked as executable):
$ ./gdb.sh build/output/symbols.elf
If Bash scripts aren’t your jam (they aren’t mine) and would prefer writing Python instead, you should check out my previous post on wrapping GDB with Invoke.
GDB in VSCode
If you are using vanilla VSCode & GDB or using an extension with VSCode, you should likely be able to define an autorun section in your launch.json where you can place source ....
{
  "version": "0.2.0",
  "configurations": [
    {
      "type": "gdb",
      "request": "launch",
      "name": "Launch Program",
      "target": "./build/${workspaceFolderBasename}.elf",
      "cwd": "${workspaceFolder}",
      "gdbpath": "/opt/esp/xtensa-esp32-elf/bin/xtensa-esp32-elf-gdb",
      "autorun": [
        "source ${workspaceFolder}/project.gdbinit",
        "other...commands"
      ],
      "preLaunchTask": "openocd"
    }
  ]
}
You can also use
"debugger_args": ["-ix", "source path/to/project.gdbinit"].
If you are using Cortex-Debug, you would add a preLaunchCommands section to your launch.json.
{
    "version": "0.2.0",
    "configurations": [
        {
            "type": "cortex-debug",
            "request": "launch",
            "name": "Debug (OpenOCD)",
            "servertype": "openocd",
            "preLaunchCommands": [
                "source ${workspaceFolder}/project.gdbinit",
            ]
        }
    ]
}
For PlatformIO, you can add this hook to your platformio.ini under the [env:debug] section:
platform = ...
board = ...
debug_extra_cmds =
  source ./project.gdbinit
You can then commit the launch.json file to the repo and all team members can load it.
GDB in Eclipse Embedded CDT
You should be able to add the custom GDB hooks under Debug Configuration -> GDB . Debugging* -> Your Configuration -> GDB Client Setup -> Commands
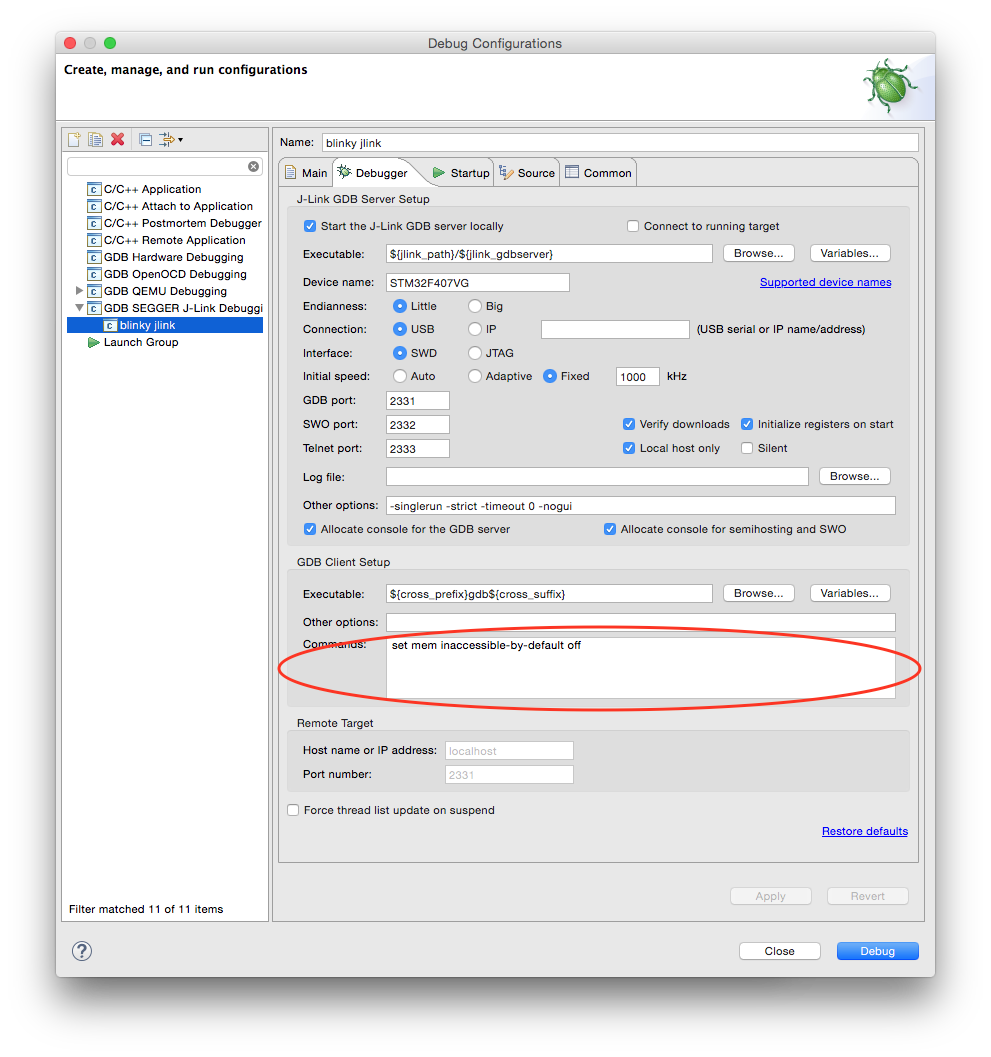
Here, you would insert something along the lines of:
source ${project_loc}/project.gdbinit
When you relaunch the debugger, you should be able to open the GDB window and use the custom commands.
If you save the Eclipse project and commit it to source control, all other team members can load this Debug Configuration and have the GDB scripts loaded automatically!
Other
I feel for you. You are likely using a vendor SDK + IDE, stucking without a debugger, or maybe happily using Segger Ozone, which has its own scripting interface.
In any case, there is a very good chance that GDB is used under the hood. You can get creative and figure out how best to pass startup commands to GDB, or maybe use sym-links to a directory on your local machine with a project setup script.
You can dig more into how GDB loads various gdbinit scripts on startup in the manual.
Conclusion
Firmware developers spend the majority of their time debugging. We need to invest in our debugging skills, improve our personal tool-chest of debugging tricks, and then share the knowledge and scripts with everyone we work with to enable them to become better developers. Most of us went to university for 4 years to learn programming but rarely feel like we can take a day or two to read up on the GDB manual or write a script.
Take a day to improve your team’s debugging story. If you need to, take the day and don’t tell the boss. They’ll thank you for it later. Mine did.
See anything you'd like to change? Submit a pull request or open an issue on our GitHub
 Tyler Hoffman has worked on the embedded software teams at Pebble and Fitbit. He is now a founder at Memfault.