How Memory Usage Patterns Can Derail Real-time Performance
In this article, we will learn how memory usage patterns can affect the real-time performance of an embedded application, drawing from a recent experience tracing an audio DSP application running on an embedded Linux platform. First, I will introduce the product in question and the real-time audio software I developed for it. Then, I’ll describe the issues I encountered with audio callbacks and the strategy I followed to determine the cause of the issues, ending with my solution and lessons learned.
Table of Contents
Background
As the founder of Percussa, I have led the software and hardware engineering of our pro-audio consumer electronics products for nearly 20 years. The first product I developed was the AudioCubes, a human-computer interface, consisting of multiple smart wireless objects capable of detecting each other’s location, orientation, and distance. The AudioCubes are a bare metal DSP platform and do not run an off-the-shelf operating system.
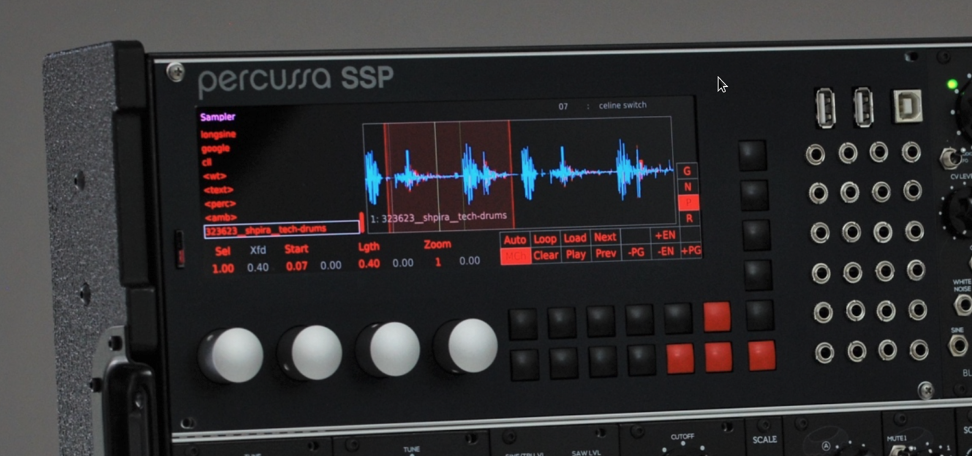
Subsequently, I developed the Percussa Super Signal Processor (SSP), a multichannel audio DSP platform, which was funded via Kickstarter for 314%. The SSP is used by professional studio musicians and sound designers worldwide and is a eurorack module (eurorack is a modular synthesizer standard). It is installed into end users’ synthesizer racks or in recording studios. It offers a library of DSP building blocks that can be chained together to create various signal-processing chains for synthesizing new sounds or processing existing sounds.
The SSP is a Linux-based platform based on a Rockchip SoC. In addition to developing the hardware and bringing up the platform, I also developed the real-time audio DSP software for the SSP. To deliver a great customer experience, it was important to get consistent audio DSP performance from the platform, avoiding the clicks and pops in the audio that can be caused by not consistently meeting audio processing deadlines (i.e. completing audio callbacks in time). Additionally, to fully benefit from the processing power of the platform, DSP processing needs to be parallelized over multiple CPU cores (the SoC in the SSP is a quad-core processor).
The audio DSP software I developed originally ran on Windows and Mac OSX platforms using a popular C++ application framework for audio applications. My strategy was to port the software to the new audio-embedded Linux platform (the SSP).
This went fairly well, with most of my time spent designing and implementing user interface code, menu systems, and code to parallelize DSP code across CPU cores. My goal on my embedded Linux platform was to use the mainline kernel tree to reduce maintenance costs.
Audio Issue Diagnosis
As I started testing and debugging my application, I kept running into issues where the audio output was regularly interrupted, resulting in an audible click. What could possibly be wrong with my code that might cause this? I started thinking about the reasons my audio callback could take too long to return, the locks in my code, and whether the audio callback could be pre-empted by the operating system, causing it to return too late and miss its real-time “deadline.”
Eventually, I decided to use a profiler to figure out what was going on and turned to the excellent Tracy Profiler, which is open source and free. Tracy is easy to integrate with your code, allowing you to define different zones for tracing and profiling. The Tracy profiling GUI application can connect over the network with your embedded platform and receive trace information in real time. This helps speed up development and debugging. Tracy also comes with a command-line capture tool you can use to capture the trace directly to disk instead of sending it over the network to your workstation.
I typically do not enable Tracy in release builds shipped to customers and only
use it when I’m trying to find a problem with the real-time behavior of my
software. I use compiler switches (-D) to enable Tracy, as described in the
Tracy manual (PDF warning),
which also describes how to control the amount of data collected. This is
important, as you do not want to generate so much tracing data that it starts to
get in the way of determining the real problem at hand.
With the help of Tracy, I discovered that my audio callback was occasionally taking too long to return. This happened often enough that it was a real problem.
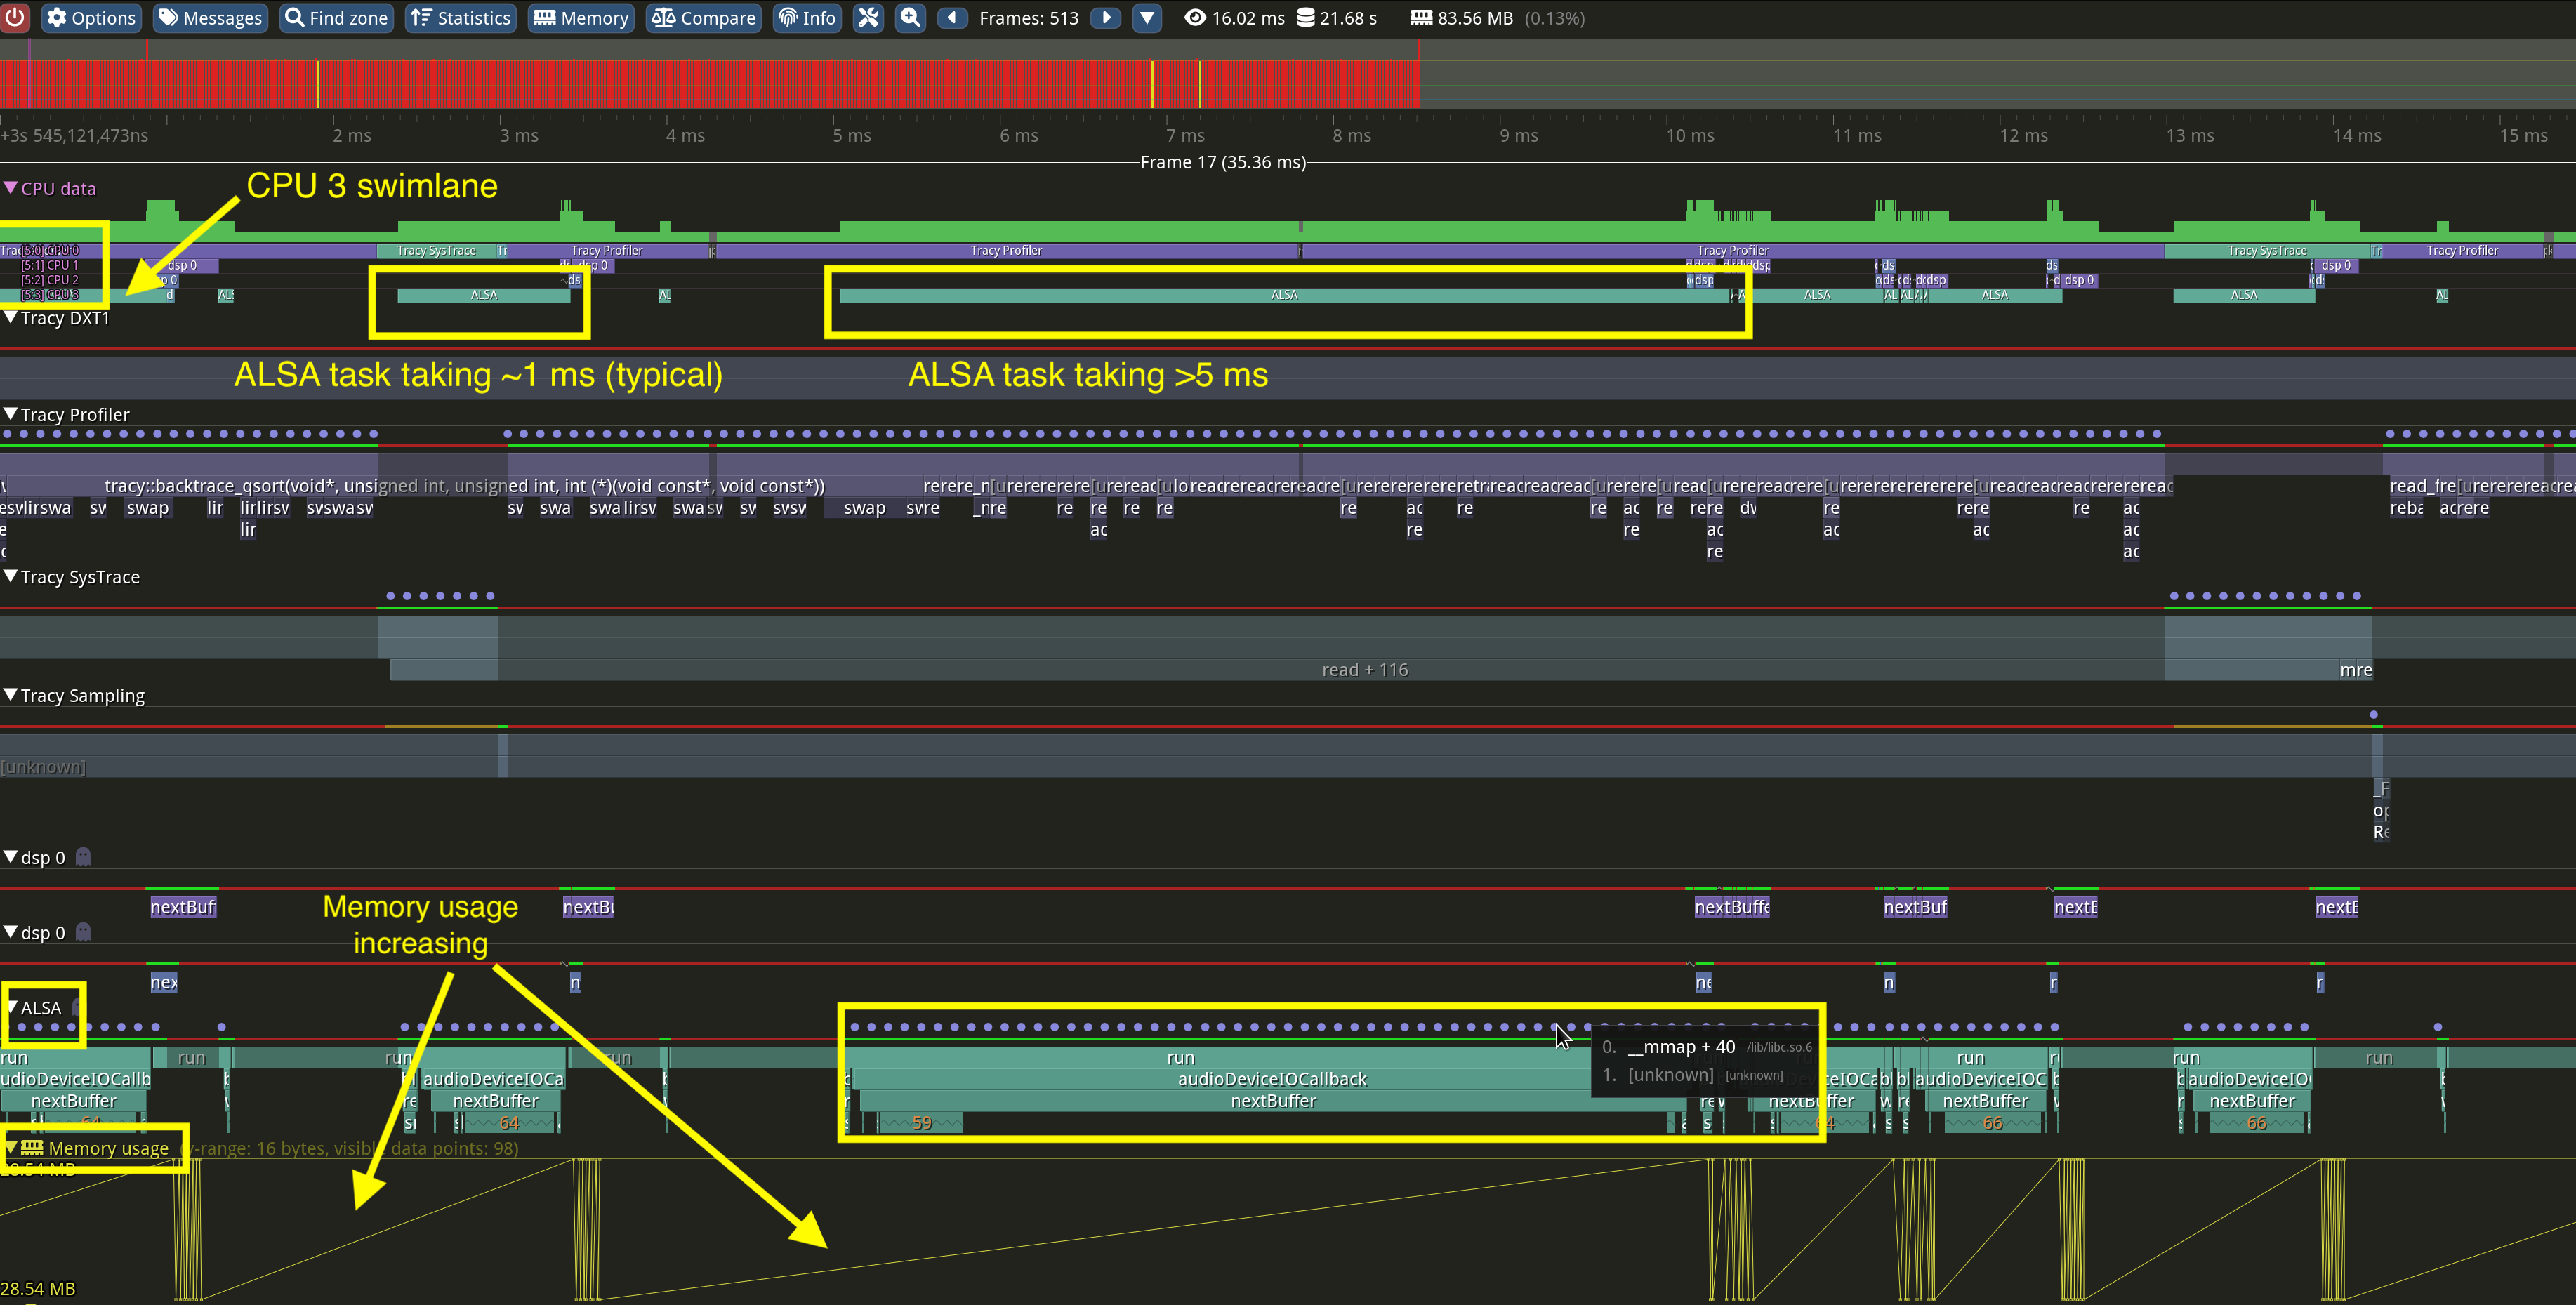
At the top of the screen in Tracy, you can see which CPU cores the threads are being scheduled on (note the four “lanes” in the above screenshot, since the software is running on a quad-core CPU). At the bottom of the screen, you can see the different nested zones that I defined in my source code, with Tracy measuring the time spent in each. The zones allow you to understand which areas of your code are the most problematic and need review.
You can see in the above screenshot an instance when the ALSA callback takes much longer than normal. What was interesting was that the issue always seemed to be connected to a memory-related function call. Right above the zones at the bottom, you can see a series of blue dots. When hovering over them, these dots showed the same memory-related function repeatedly, indicating that the CPU was spending an unusually long time in this function. Additionally, the yellow graph at the bottom shows memory usage constantly increasing or decreasing, resulting in the zig-zag pattern being plotted.
However, I had paid close attention to the code in my audio callback and DSP worker threads and I was fairly confident I was not doing any kind of dynamic memory allocation in my audio or DSP threads.
As I dug deeper, I noticed that my audio thread was being pre-empted by kernel threads.
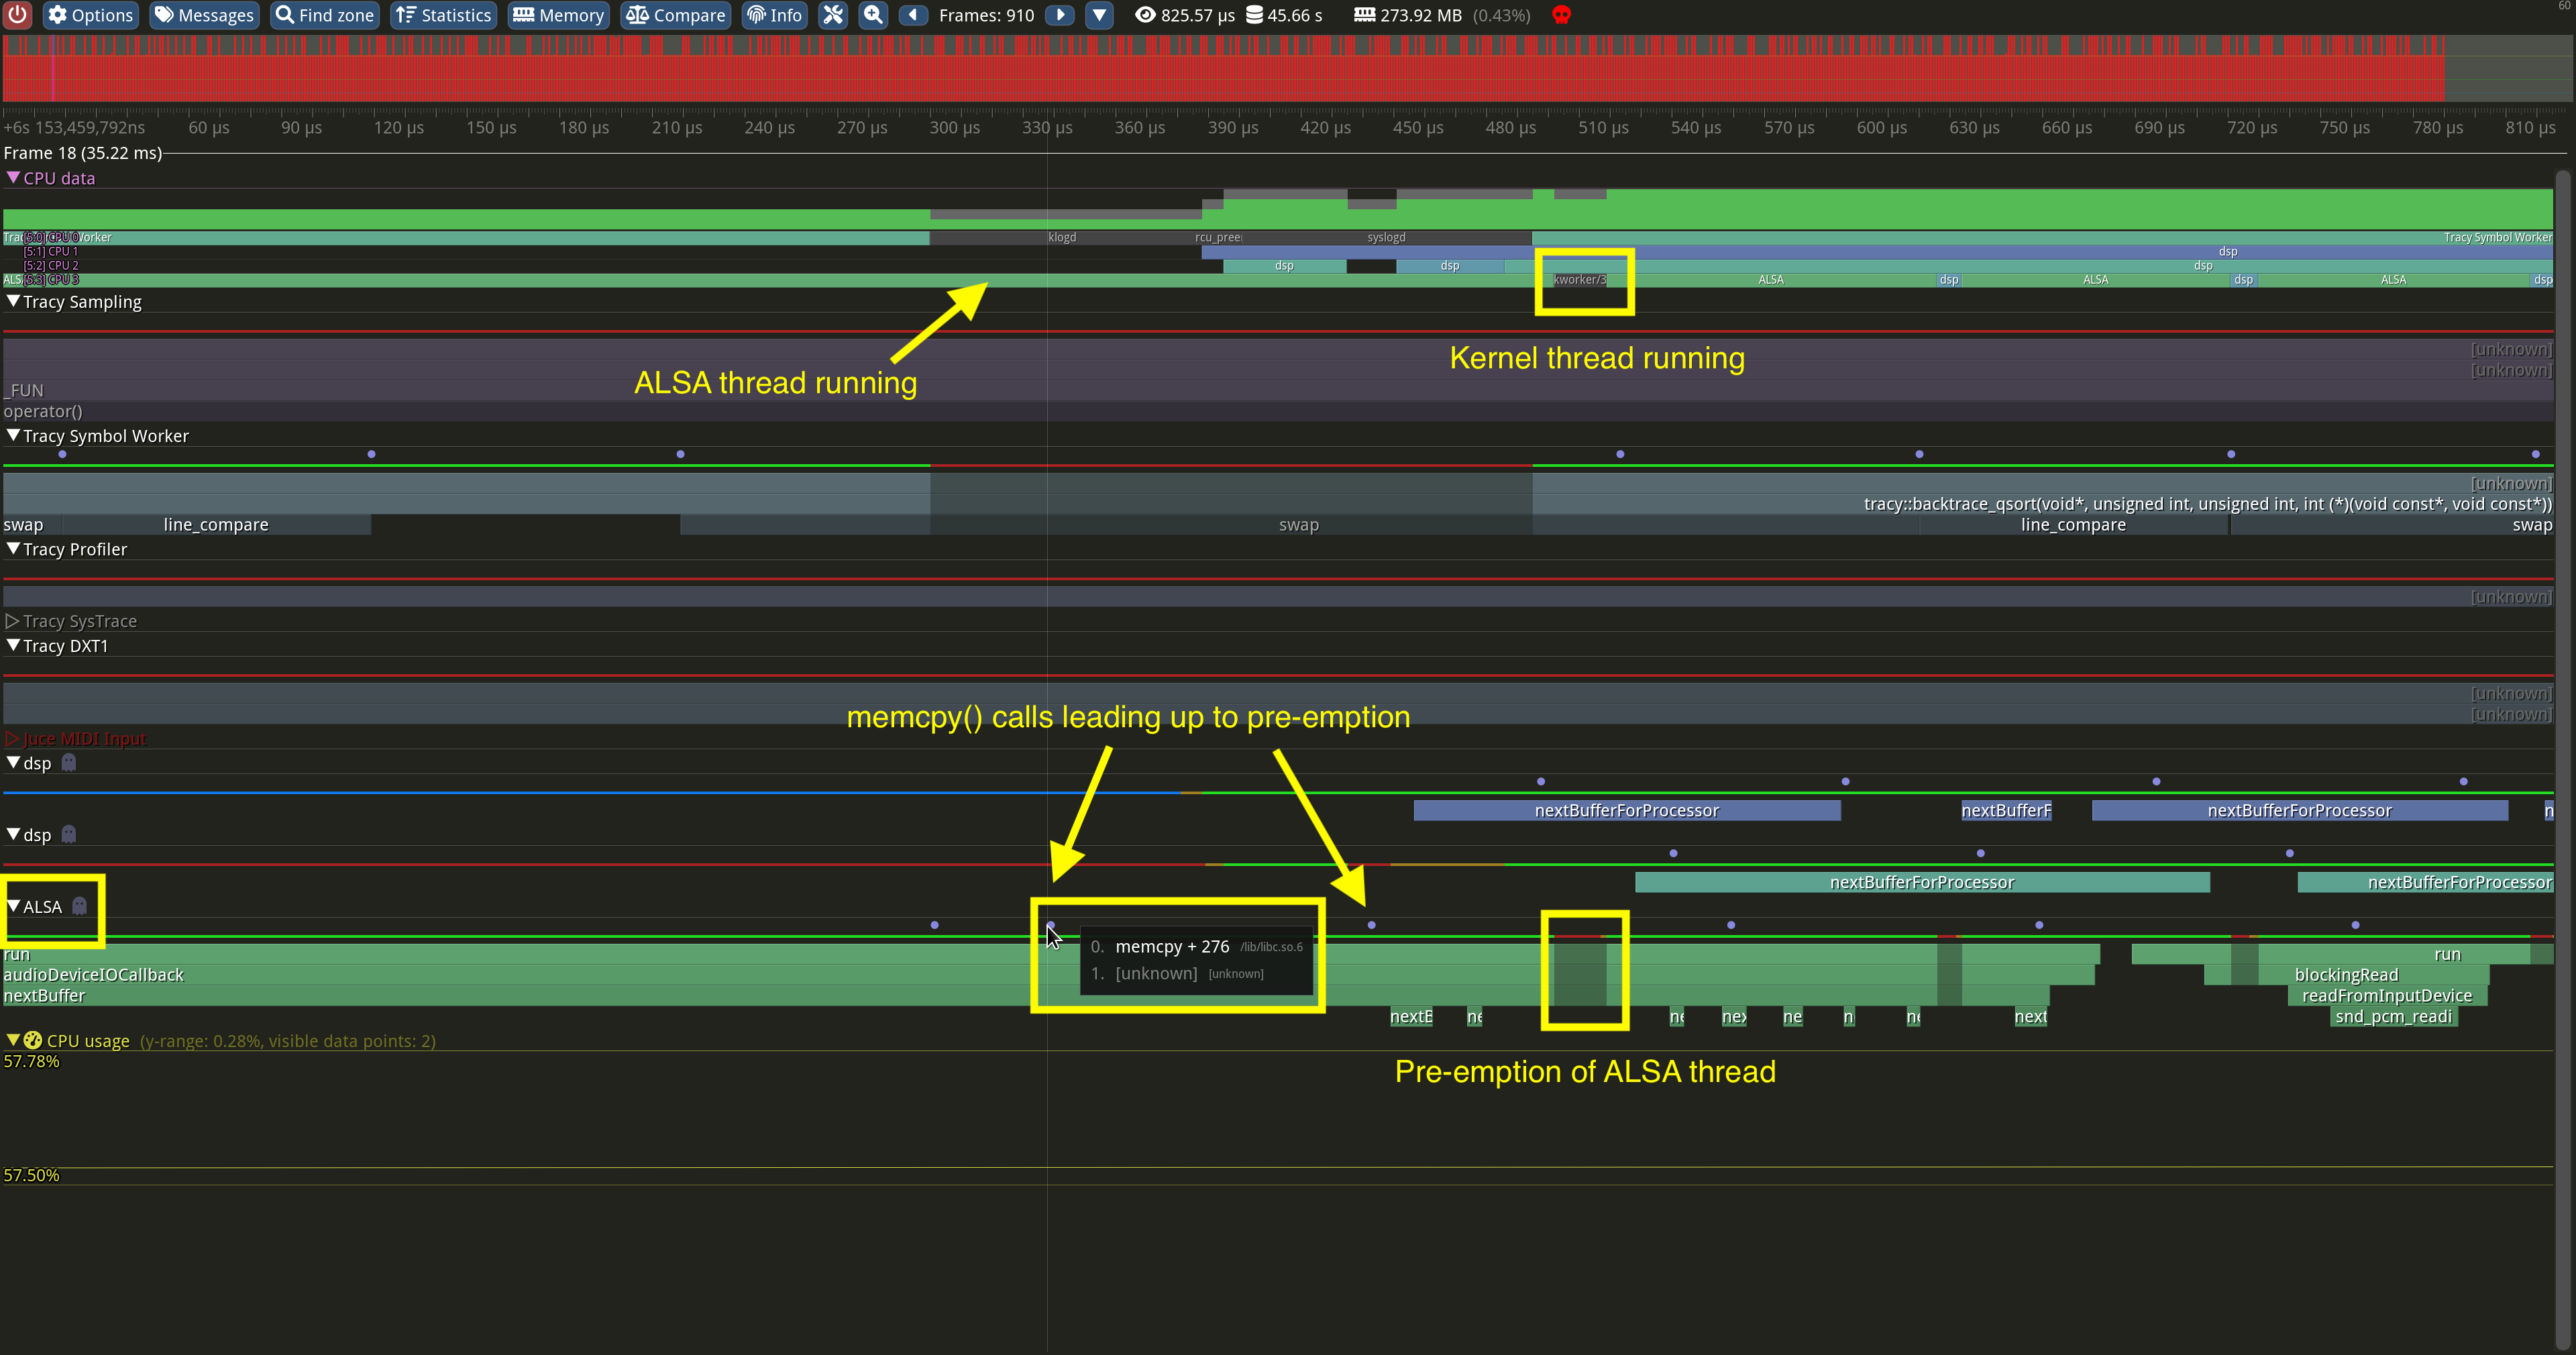
While I don’t have an exact copy of the pre-emption from this instance, I have an example screenshot above which is very similar. In this case, you can see that the ALSA thread is being pre-empted with a memory-related function call appearing at the bottom of the screen shortly before the scheduling of kernel threads.
Note: Tracy can sample Linux kernel call stacks in addition to your application call stacks to give an even deeper look at what the kernel is doing. Refer to the Tracy manual to understand the requirements for this.
Eventually, I started examining the memory usage behavior of my application and
discovered that the third-party application framework I was using had its own
memory management classes. Under the hood, malloc() was being called to
allocate blocks of very small sizes – some as small as 4 bytes! These classes
were used all over the code base in the framework – and thus in my application,
which was based on the framework. I had unwittingly invited dynamic memory
allocation in places due to the way the framework was architected.
Because of the frequency with which these calls happened, it resulted in memory fragmentation, which explained why some memory-related function calls took so long to return. Fragmentation can result in memory-related function calls taking much longer than normal and/or the Linux kernel pre-empting your thread(s) while it performs its cleanup.
By analyzing the call stacks, combined with callbacks taking unusually long to return, excessive time spent in memory-related functions, and the scheduling of kernel threads, you can get an idea of whether your application’s memory usage patterns might be causing issues.
In my particular case, my application’s memory usage patterns caused my callbacks and other code to take too long to return, resulting in missed real-time deadlines and audio clicks.
Solution
To solve this problem, I implemented my own memory allocator and re-implemented
malloc() and friends to use my allocator. At a high level, my allocator
pre-allocates one large block of memory using mmap() on startup and manages
free/used lists of smaller blocks. Calls to malloc() and friends then result
in allocations/deallocations using my allocator. This approach addresses the
above fragmentation issues and prevents memory-related function calls from
taking too long or varying unpredictably.
I considered using off-the-shelf allocators, but this experience made me a bit
paranoid. I decided that implementing one myself was a good exercise anyway so I
could be aware of its behavior under the hood. By implementing my own allocator
and overriding malloc() and friends to use my allocator, I was able to collect
and display allocation statistics and understand how my application uses memory
as I was debugging and testing it.
I also reviewed my code and re-architected parts of it to pre-allocate pools of objects on startup, which are then re-used as much as possible.
While continuing my efforts with profiling and tracing using Tracy, I also learned the importance of being aware of the memory allocation behavior of the tracing code (and third-party framework code!) that you integrate into your application. Tracy has its own allocator, which is great, but one needs to be mindful of the tracing features enabled and the volume of data being collected to avoid affecting the real-time behavior of the application being traced.
Conclusion
If you are working on a real-time application – whether it is an audio processing application, a low-latency proprietary trading application, or anything else that needs to have real-time or low-latency behavior, profile your application in various ways and be aware of the memory usage patterns of your application. And don’t forget to examine the behavior under the hood of ALL third-party libraries in your application (including tracing or profiling code or libraries). 🤓
See anything you'd like to change? Submit a pull request or open an issue on our GitHub
Links
 Bert Schiettecatte is the founder of Noisetron LLC, a software & hardware engineering and expert witness consulting practice, and the founder of Percussa, a pro-audio consumer electronics company.