MCU Peripheral Forwarding
PC applications that interact with MCUs are used by developers for a number of reasons, such as data visualization, monitoring during testing campaigns, and command and control via a GUI. In this article, we’ll explore mapping an MCU’s peripherals to your personal computer to simplify development of PC applications built for embedded systems.
Table of Contents
Embedded systems development often involves utilizing various microcontroller peripherals such as CAN buses, I2C buses, DACs, ADCs, and more. However, when integrating these functionalities into PC applications, developers are typically required to develop firmware and communication protocols, which can add complexity to the overall software stack. They can avoid this additional work if the chip peripheral registers are directly mapped into the address space of our PC programs. We’ll explore two options for instrumenting your PC application to perform this mapping.
Option 1: Dynamic Binary Instrumentation
Consider a scenario where we attempt to execute firmware code designed for the STM32F103 microcontroller directly on a PC. Take, for instance, the following simple program snippet:
#include <stdio.h>

// ==========================================
// from stm32f10x.h header file
typedef struct
{
  int CRL;
  int CRH;
  int IDR;
  int ODR;
  int BSRR;
  int BRR;
  int LCKR;
} GPIO_TypeDef;

//peripheral GPIO address
#define GPIOC ((GPIO_TypeDef*)0x40011000)
// ==========================================


int main() {
  // read the state of PC0 pin
  int pin_PC0_value = GPIOC->IDR & 0x1;
  // write the value to console
  printf("PC0 value: %d\n", pin_PC0_value);

  return 0;
}
While this code might build successfully on our PC, directly executing it fails. The PC application can’t directly access the memory address 0x40011000, as it’s specific to the STM32F103 microcontroller’s GPIOC peripheral.
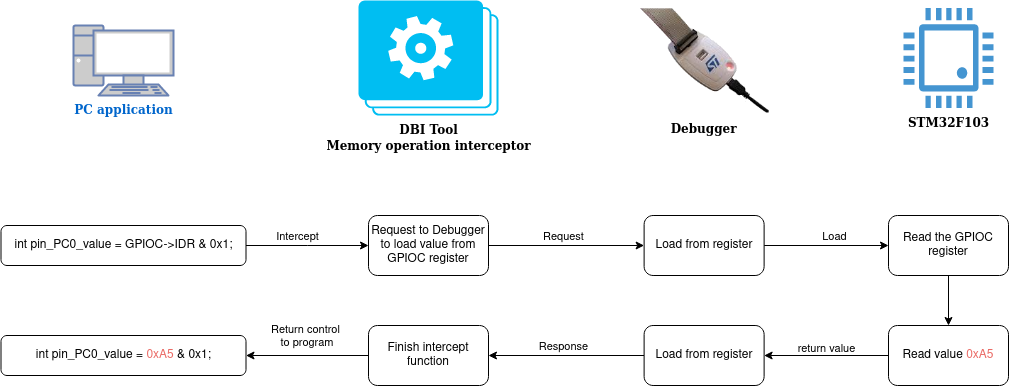
The challenge is to enable the program to remain valid and successfully retrieve the state from a real STM32F103 chip without altering the existing codebase. Fortunately, the PC platform offers powerful Dynamic Binary Instrumentation (DBI) tools, empowering developers to dynamically intercept and modify memory operations during runtime. In the context of peripheral operations, these DBI tools become instrumental. When a memory operation targeting the peripheral address occurs, these tools can intercept the operation.
int pin_PC0_value = GPIOC->IDR & 0x1;
During this interception, a DBI tool can load a value directly from the GPIOC peripheral register of the STM32F103 chip. With the aid of a debugger, for example, we can acquire the valid value from the physical hardware and seamlessly return it to the executing operation.
Pintool
It is important to note that not all DBI toolkits can interrupt memory operations. While there are various DBI toolkits available, only one option stands out for this particular task: Intel’s PinTool. Unlike other DBI tools, PinTool offers the capability to interrupt memory operations, making it a suitable choice for this approach.
In the pursuit of this approach, I have developed a proof of concept using PinTool. This example uses a custom plugin, designed for Intel PinTool.
The plugin is engineered to dynamically intercept all memory operations executed by the instrumented PC program. Given that the X86 processor predominantly utilizes the mov instruction for memory-related tasks, the plugin intercepts every mov instruction during runtime.
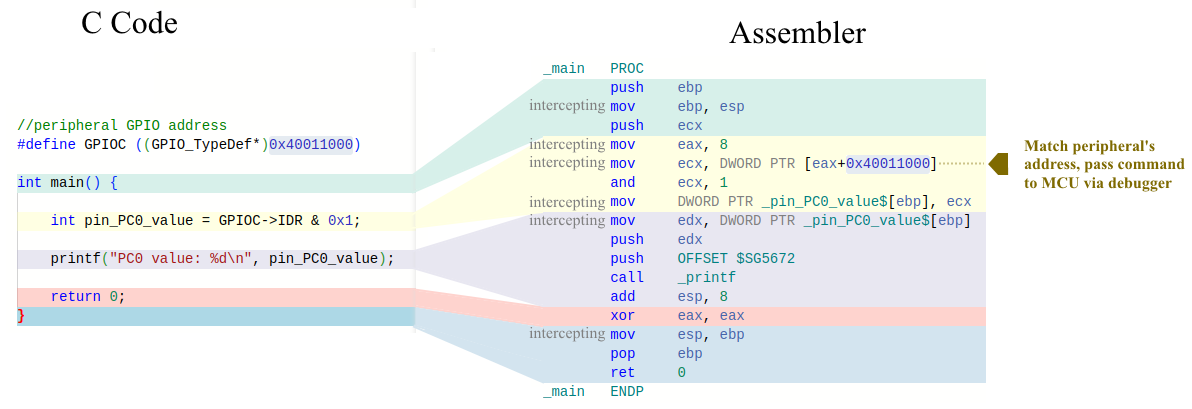
It then examines the runtime arguments of these instructions, specifically focusing on address arguments, and comparing them against the addresses of the microcontroller’s peripheral registers. Once identified, the plugin takes the necessary steps to initiate the execution of the peripheral operation on the MCU.
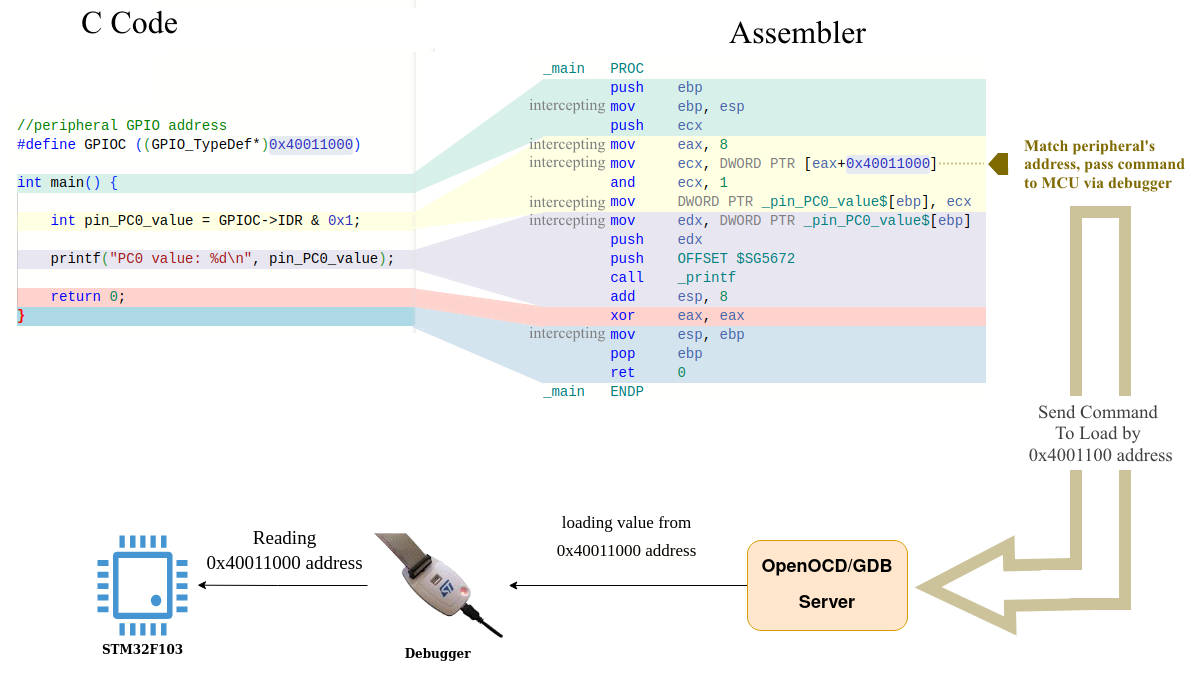
To achieve this seamless execution, the PinTool plugin establishes communication with the debugger using either the OpenOCD server or the GDB server. Both servers offer robust APIs that enable developers to execute memory operations on the target device.
15.4 Memory access commands of OpenOCD server
mdw, mdh, mdb — Display contents of address addr, as 32-bit words (mdw), 16-bit halfwords (mdh), or 8-bit bytes (mdb).
mww, mwh, mwb — Writes the specified word (32 bits), halfword (16 bits), or byte (8-bit) value, at the specified address addr.
Cons
While the PinTool plugin offers a viable solution for mapping peripheral registers to PC address space, excessive checks and overhead can impact performance, especially as the program complexity increases. Additionally, it’s worth noting that PinTool, although proprietary, is freely accessible to users. Furthermore, its compatibility is limited to Intel processors. When it comes to debugging programs that utilize dynamic binary instrumentation (DBI) tools like PinTool, additional complexities are involved. DBI-based debugging requires a thorough understanding of the underlying architecture, as well as the intricacies of the tool itself. Considering the limitations and factors mentioned, it becomes crucial to explore alternative approach that can address performance concerns, provide cross-platform compatibility, and offer greater flexibility.
Option 2: Compile-Time Instrumentation
To address the issue of excessive checks during runtime, an alternative approach involves selectively transforming the code that interacts with the peripherals at compile time. By focusing on the specific sections of code that handle peripheral operations, unnecessary checks and interruptions can be avoided, leading to improved performance and efficiency.
#define GPIOC ((GPIO_TypeDef*)0x08000000)
...
int a = 0;                 // no need instrumentation, local variable
int b = a + 1;             // no need instrumentation, local variable
GPIOC->PIN1 = 0x1 << 4;    // need instrumentation, GPIOC is address of GPIOC peripheral, setup PIN1
b = GPIOC->PIN2 | 1 << 2;  // need instrumentation, GPIOC is address of GPIOC peripheral, read state of PIN2
This technique, known as Compile-Time Instrumentation, entails modifying the source code or utilizing specialized tools during the compilation process to introduce additional instructions or perform static analysis. The goal is to validate and optimize the code responsible for accessing peripheral registers, ultimately eliminating the need for excessive checks during runtime.
When working with microcontroller peripherals, developers typically rely on specialized software development kits (SDKs) provided by chip vendors or third-party providers. In the context of optimizing code for peripheral operations, it becomes advantageous to selectively instrument the code within the MCU’s SDK.
For instance, among the Open Source SDKs I’ve instrumented, we have notable examples like:
- STM32 Standard Peripheral Libraries
- Nordicsemi nRF5 SDK
- Infineon XMC Peripheral Library
- Silabs Gecko SDK
- Atmel ASF3 SDK
By focusing on the code segments responsible for interacting with peripherals, we can introduce optimizations and eliminate unnecessary checks to enhance performance and efficiency.
Research on LLVM Sanitizer
Compile-time instrumentation is commonly used in debugging and optimization, and tools like LLVM sanitizers provide powerful mechanisms to detect and address issues in code, including memory access errors, data races, and undefined behavior. The AddressSanitizer (ASan) is one such sanitizer that can be particularly useful in our context.
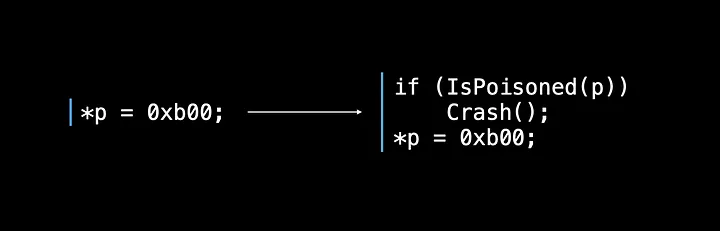
AddressSanitizer (ASan) instruments the code by adding checks before each memory access instruction. ASan accomplishes this by inserting calls to an ASan library routine, which performs the necessary checks at runtime.
With some modifications to AddressSanitizer (ASan), we can adapt it to serve as an interceptor for peripheral operations. We would need to modify the ASan code to:
-
Instead of inserting the calls before each memory operation, we would need to modify the ASan code to include calls to our custom library routine in place of memory operations. This routine will handle the interception and validation of peripheral accesses. For example:
 *p = 0xb00;
 int var = *p;
Modify to
our_store_function(p, 0xb00); int var = our_load_function(p); -
Identify specific memory addresses corresponding to peripheral registers: We will need to identify the specific memory addresses that correspond to the peripheral registers we want to intercept. It is a challenging task, especially when the information about which operations correspond to peripherals or local memory is not readily available. This is particularly true in cases where functions receive pointers as arguments, as it becomes more difficult to precisely identify operations related to peripheral accesses. For example:
 void foo(void *p){
   *(int*)p = 0;
 }
To address the challenge of distinguishing between local memory operations and peripheral operations, a possible solution is to perform runtime checks for all instrumentation operations, except in cases where we can definitively determine whether it is a local memory operation or a peripheral operation.
The LLVM framework provides APIs that allow us to check whether an operation involves local variables or global variables. By leveraging these APIs, we can determine whether an operation is likely a local memory operation.
int g = 0;

void foo(){
  int v;
  g = 0;
  v = 1;
}
Using the LLVM API, we can determine the code above does not require instrumentation. By analyzing the code, LLVM can identify memory operations corresponding to local PC pointers and exclude them from the instrumentation process.
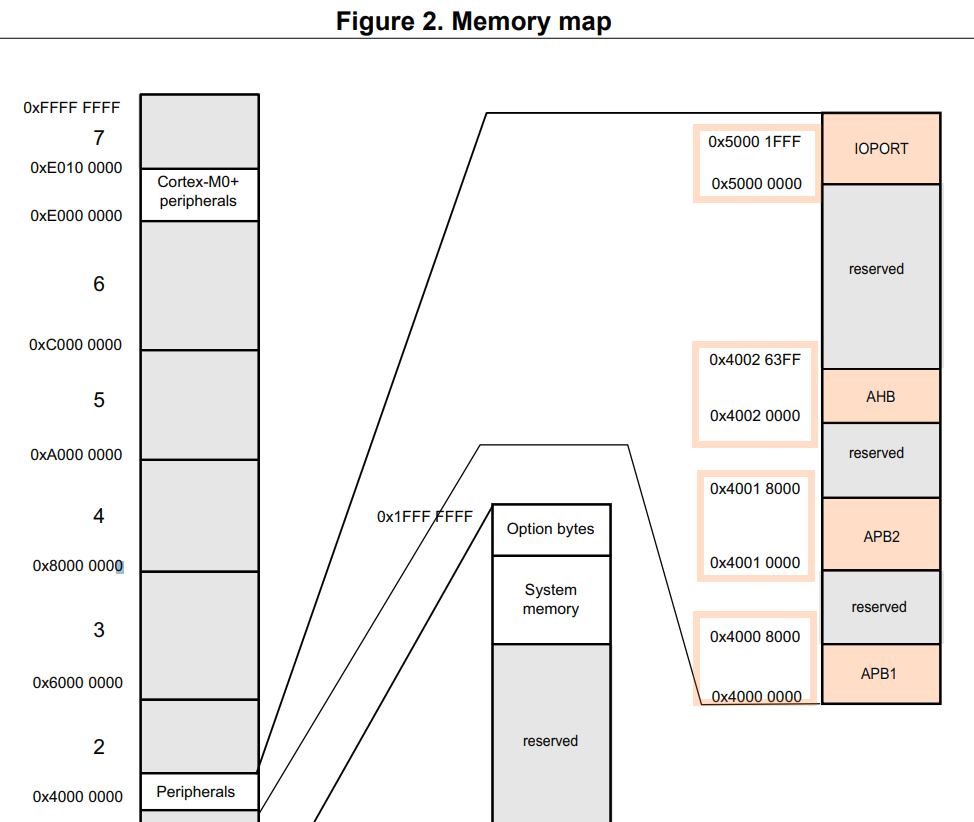
However, for cases where the distinction is unclear, you must check every memory address against a set of peripheral address intervals. For example, in the case of the STM32L0 chip, the peripheral registers are located within specific address intervals, such as 0x40000000 - 0x40008000, 0x40010000 - 0x40018000, 0x4002 0000 - 0x4002 63FF and 0x5000 0000 - 0x5000 1FFF. By comparing the accessed address with these intervals, you can determine if it corresponds to a peripheral address.
If the checking address falls within one of the defined peripheral address intervals, it can be considered a peripheral address. Conversely, if the checking address falls outside these intervals, it is likely a local host address.
AddressInterceptor LLVM Transform pass
I have developed an LLVM Transform pass (plugin) called AddressInterceptor (ADIN) to address the challenge of distinguishing between PC application addresses and peripheral addresses during instrumentation. ADIN checks all memory operations, assessing whether each operation involves global or local variables of the application. If an operation does not involve these types, ADIN proceeds to instrument the subsequent routines:
extern "C" void __adin_store_(llvm_pass_addr pointer, llvm_value_type value, llvm_pass_arg TypeSizeArg, llvm_pass_arg AlignmentArg)
extern "C" llvm_value_type __adin_load_(const llvm_pass_addr pointer, llvm_pass_arg TypeSizeArg, llvm_pass_arg AlignmentArg)
extern "C" void __adin_memcpy_(llvm_pass_addr dest, const llvm_pass_addr src, const llvm_pass_arg size)
extern "C" void __adin_memset_(llvm_pass_addr dest, const llvm_pass_arg val, const llvm_pass_arg size)
The plugin works with LLVM IR code. It analyzes and modifies the LLVM IR representation of the source code to perform the necessary checks and instrumentation. For example, we have a simple C code file named example.c.
int var = 0;

void f(){
  *(int*)0x100 = 1;
  var = *(int*)0x100;
}
To compile it into LLVM IR code using Clang, execute the following command:
clang -S -emit-llvm example.c -o example.ll
This command will generate the LLVM IR code file example.ll based on our C code above.
; Function Attrs: noinline nounwind optnone uwtable
define dso_local void @f() #0 {
  store i32 1, i32* inttoptr (i64 256 to i32*), align 4
  %1 = load i32, i32* inttoptr (i64 256 to i32*), align 4
  store i32 %1, i32* @b, align 4
  ret void
}
To utilize the AddressInterceptor (ADIN) plugin with the opt utility of LLVM, you would typically invoke opt with the -adin flag. This flag indicates that you want to apply the ADIN plugin during the optimization process
opt -adin -S example.ll-o adin_modified_example.ll
The modified LLVM IR code will be written to the modified.ll file.
define dso_local void @f() #0 {
  call void @__adin_store_(i8* inttoptr (i64 256 to i8*), i64 1, i32 32, i32 4)
  %load_i32_ = call i64 @__adin_load_(i8* inttoptr (i64 256 to i8*), i32 32, i32 4)
  %truncated_i32_ = trunc i64 %load_i32_ to i32
  store i32 %truncated_i32_, i32* @b, align 4
  ret void
}
To obtain detailed instructions on building and using the AddressInterceptor (ADIN) plugin, refer to the documentation provided in the ADIN LLVM fork repository.
Once you have modified the LLVM IR code using the ADIN plugin and obtained the transformed IR code from the MCU’s SDK, you can proceed to compile the IR code into object files.
clang -c modified.ll -o modified.o
However, to successfully link these object files and create an executable file or library, we may need to implement certain functions that the plugin instrumented before it.
extern "C" void __adin_store_(llvm_pass_addr pointer, llvm_value_type value, llvm_pass_arg TypeSizeArg, llvm_pass_arg AlignmentArg)
extern "C" llvm_value_type __adin_load_(const llvm_pass_addr pointer, llvm_pass_arg TypeSizeArg, llvm_pass_arg AlignmentArg)
extern "C" void __adin_memcpy_(llvm_pass_addr dest, const llvm_pass_addr src, const llvm_pass_arg size)
extern "C" void __adin_memset_(llvm_pass_addr dest, const llvm_pass_arg val, const llvm_pass_arg size)
In the functions inserted by the ADIN plugin, you must perform address checks to verify if the accessed address falls within the defined peripheral address intervals. If a match is found, you can execute the corresponding operation on the MCU chip.
REMCU Project
I have implemented the necessary functions for address checking and executing operations on the MCU within a separate repository called REMCU. REMCU provides the functionality to handle peripheral register operations using an OpenOCD and GDB client. This client enables communication with the debugger to execute peripheral register operations on the MCU chip. The OpenOCD and GDB client implementation allows you to interact with the MCU using the debugger, providing a convenient way to send commands and data to the peripheral registers.
Furthermore, REMCU is extensible and adaptable to
different communication protocols. You can implement your own client
using protocols such as UART, CAN bus, or any other suitable
communication method. Simply create a new class that derives from the ClientBase class in REMCU and implement the necessary communication functionality specific to your chosen protocol.
struct ClientBase {
    bool connect(const std::string, const uint16_t port, int timeout_sec) const ;
    virtual bool store2RemoteAddr(const llvm_ocd_addr addr, const llvm_value_type value, const llvm_pass_arg sizeVal) const ;
    virtual bool loadFromRemoteAddr(const llvm_ocd_addr addr, llvm_value_type & value, const llvm_pass_arg sizeVal) const ;
    virtual bool arrayWrite2RemoteMem(const uintptr_t addr, const uint8_t*  sink, const size_t size) const ;
    virtual bool arrayLoadFromRemoteMem(const uintptr_t addr, const size_t size, uint8_t*  dist) const ;
    virtual bool resetRemoteUnit(const ResetType) const ;
    virtual bool ping() const ;
    bool close() const ;
};
Establishing a connection with the MCU through the debugger protocol provides a robust and dependable solution. This connection is unaffected by issues such as the chip clock signal or chip reset, ensuring consistent communication between the PC and the MCU.
The REMCU also offers helpful build scripts that automate the process of building the MCU’s SDK into a separate shared library(*.so, *.dll, *.dylib) for various platforms, including embedded Linux (such as Raspberry Pi).
These build scripts simplify the setup and configuration process and streamline the integration of the MCU’s SDK with the necessary instrumentation, making it easier to incorporate the modified SDK into your project. By running these build scripts, you can automatically generate a shared library that contains the instrumented code and the implementation of the handler functions using an NRF SDK example as a reference.
Preparing the SDK for your specific MCU and the corresponding build process will be covered in detail in the article. The article will provide step-by-step instructions and guidelines on preparing the SDK and building the necessary shared library with the instrumentation and REMCU handler functions.
How to use
Getting started with REMCU is relatively straightforward and involves a few simple steps to set up the necessary components. The key steps to prepare for working with REMCU are as follows:
-
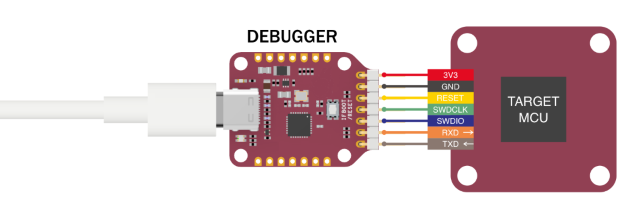
Connect a target MCU to your PC host:
-
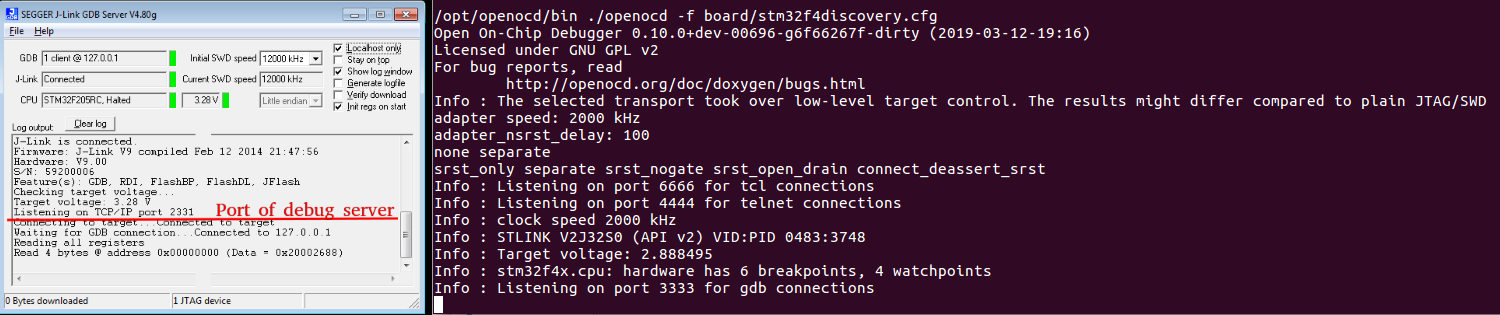
Run OpenOCD or GDB server:
-
Set up OpenOCD or a GDB client: Depending on your preference and specific requirements, you can choose either OpenOCD or a GDB client. By running the corresponding functions below, you can establish the connection between the PC and the MCU.
/** * @brief remcu_connect2OpenOCD * The function is used to create a connection to the OpenOCD server destination * @param host - ip address of OpenOCD server "XXX.XXX.XXX.XXX". If the server runs on the host machine, the argument should be "localhost" or "127.0.0.1" value. * @param port - port of OpenOCD server. Default is 6666 * @param timeout_sec - This parameter specifies the length of time, in seconds, to wait for a response when establishing communications. It can not be negative! * @return If no error occurs, function returns true */ REMCULIB_DLL_API bool remcu_connect2OpenOCD(const char* host, const uint16_t port, const int timeout_sec); /** * @brief remcu_connect2GDB * The function is used to create a connection to the GDB server destination * @param host - ip address of GDB server "XXX.XXX.XXX.XXX". If the server runs on the host machine, the argument should be "localhost" or "127.0.0.1" value. * @param port - port of GDB server. Default of OpenOCD is 3333 * @param timeout_sec - This parameter specifies the length of time, in seconds, to wait for a response when establishing communications. It can not be negative! * @return If no error occurs, function returns true */ REMCULIB_DLL_API bool remcu_connect2GDB(const char* host, const uint16_t port, const int timeout_sec); -
Reset the chip: Once the connection is established, you can utilize the remcu_resetRemoteUnit function to reset the MCU. This step ensures a clean starting point and prepares the chip for further operations.
remcu_resetRemoteUnit(__HALT);
Now, You can execute any SDK peripheral driver functions!
Conclusion
In conclusion, we’ve explored the fundamentals of Chip Peripheral Forwarding technology, laying down the basis for its understanding and implementation. This approach emerges as a versatile technology, simplifying the expansion of peripherals for both PC and embedded systems, such as the Raspberry Pi. Moreover, it significantly bolsters hardware equipment testing, harnessing the capabilities of PC program tools such as high-level languages like Python and interactive shells like Jupyter Notebook, and it eliminates the need for firmware and communication protocol development.
To witness this technology in action, look no further than the REMCU examples repository. Here, a diverse array of practical examples is offered, specifically crafted for various MCUs.
In the GIF demonstration below, we offer a vivid glimpse into the capabilities of the QT example application. This software charts gyroscope data along three distinct axes, providing visual insight into the device’s orientation and motion. The gyroscope sensor, mounted on the STM32F3 Discovery board, communicates via the I2C protocol. In this application, the I2C port of the STM32F3 microcontroller serves as a direct conduit to the PC environment. This connection is established effortlessly by using the STM32 Standard Peripheral Library, instrumented with REMCU.
More detail in Plotter of Gyroscope example

These examples, combined with accompanying video tutorials, offer hands-on insights into effectively integrating REMCU into your own projects.
In this guide, we will lead you through the procedure of preparing drivers for the nRF51422 MCU. The prime objective of this guide is to empower you to fabricate your very own REMCU shared/dynamic library, meticulously tailored to your distinct MCU and its SDK.
See anything you'd like to change? Submit a pull request or open an issue on our GitHub
References
- Preparing nRF51 Drivers SDK for MCU’s Peripheral Forwarding
- General Commands of OpenOCD. OpenOCD docs
- Performance benefits of Sanitizers. Red Hat
- Address Sanitizer
- Introduction what is LLVM pass
- Reference manual Ultra-low-power STM32L0x1 advanced Arm®-based 32-bit MCUs
- High-level programming of MCU periphery from a host PC without using firmware and processor. Introduction and example
- REMCU Video Tutorial
- REMCU project site
Useful Repo Links
 Evgeny Chormonov is a hardware and software engineer