Linux Coredumps (Part 3) - On Device Unwinding
In our previous posts (Part 1 & Part 2), we covered how Linux coredumps are structured, how they’re collected, and how we could reduce the size of them to fit on systems with less memory.
In this post, we’ll go over a method of coredump collection that does the stack unwinding on-device. This approach allows devices that may be sensitive to leaking PII (Personally Identifiable Information) that may be stored in memory on the stack or heap to safely collect coredumps in addition to greatly reducing the size needed to store them.
By unwinding the stack locally on the device, we don’t need to push any sections
of memory out to another device/server and can just push the PC of each frame
to be symbolicated separately. In this post, we’ll cover the mechanism by which
programs compiled with GCC/LLVM handle stack unwinding, and how we can leverage
that to do local stack unwinding.
🎥 Listen to a recording of Blake’s talk from Open Source Summit North America 2025, “Efficient On-Device Core Dump Processing for IoT: A Rusty Implementation,” for an even deeper diver into the techniques explored in this series.
Table of Contents
What are we trying to build?
Before we dive into the fun technical details, let’s lay out what we’re trying to accomplish here. Our end goal is to take our coredump and strip away all captured memory. This achieves two goals:
- No risk of sensitive customer data leaving the device. If we’re not capturing memory, it can’t leave the device.
- A significant reduction in size. Most of a coredump is comprised of large swaths of captured raw memory.
So, what information do we need to capture? If we’re not saving locals or any
heap memory, at a minimum, all we need is the PC(program counter) at each
frame. This is just a raw address, though. If we want this to actually be useful
we’ll need to capture information that will allow us to symbolicate each PC
into the actual function name/location.
First, we need to know which file contains the symbols we’re using. Recall that a single Linux program can execute not only the code in main binary but any dynamically linked code that might be used as well. To do this, debuggers typically use a combination of GNU build ID and path, so we’ll need to capture both. Check out our previous article on GNU build IDs for more info!
An interesting wrinkle here is that the address range present in the compiled
binary and the address range used when the program is executing is different and
random. This is a security feature of Linux called ASLR (Address Space Load
Randomization)1. At a high level, it randomizes the base address where the
program is loaded into memory so that attackers cannot observe a program and
attempt to intercept program execution by changing values on the stack.
Therefore, to decode addresses properly, we will need the PC range in addition
to the compile time and run time offset.
So we now have a minimal set of information we need to capture to get a complete backtrace:
-
PCfor each frame on every thread - For the main binary and all dynamic libs
-
PCrange - GNU build ID
- Compile time and runtime offset
- Path
-
An unwound stack can now be represented with the following JSON structure:
{
  "symbols": [
    {
      "pc_range": {
        "start": "0x555dbc0000",
        "end": "0x555dc4c000"
      },
      "build_id": "4929ac8cb3c174c113cafc7250efe12eee45cd25",
      "compiled_offset": "0x0",
      "runtime_offset": "0x555dbc0000",
      "path": "/usr/bin/memfaultd"
    },
    {
      "pc_range": {
        "start": "0x7f957b0000",
        "end": "0x7f957c4000"
      },
      "build_id": "6068e30747634b6fe61b667bba7f5964da192a3e",
      "compiled_offset": "0x0",
      "runtime_offset": "0x7f957b0000",
      "path": "/lib/libgcc_s.so.1"
    }
  ],
  "threads": [
    {
      "pcs": [
        "0x7f95862508"
        "0x7f95894b80"
      ]
    },
    {
      "pcs": [
        "0x7f95894b80"
        "0x7f9585cf3c"
      ]
    }
  ]
}
Using the above, we can create our stacktrace by doing the following for each
PC in a thread:
- Find the associated symbols by checking each
PCrange - Fetch the symbol file by either build ID or path
- Shift the
PCby subtracting the runtime offset and adding the compiled offset to account forASLR - Run the shifted address and associated symbol file through
addr2line2
After running through the above steps, we should have a fully symbolicated stacktrace for each thread in our program at the time of crash. Now that we know our end goal, how do we get all of this from a Linux core handler?
Understanding GNU Unwind Info
To answer the above question, we need to look at how programs like GDB and
perf traverse the stack. The first thing to note is that there are actually
two parts to backtrace creation. Obviously, we need to convert raw addresses to
function names and local variable names, but we also need to know how each frame
is constructed.
When unwinding a stack, there is information about the previous frame that a debugger, profiler, or any other program needs to know:
- The locations of saved registers on the stack
- The locations of local variables on the stack
Our first instinct is probably to reach to the frame pointer register. This, in
theory, tells us where the previous frame starts, but there are a few problems
here. For one, not every platform has a frame pointer, x86-64 being the
obvious example. Additionally, some recent compilers have taken the step of
turning the frame pointer register into a general purpose register as a
performance improvement3. Even if we could depend on the frame pointer,
how do we know where the registers are relative to it?
Luckily, modern compilers have a built-in mechanism to solve all these problems!
The .eh_frame4 section and its sibling the
.eh_frame_hdr5 section together gives us the ability to get the
previous frame’s structure when providing the current PC value. We’ll dive
deeper into the structure of these sections in a moment, but they satisfy both
of the requirements we previously laid out. When handling a crash, we can take
the first PC and derive the structure of the previous frame, then repeat that
process until we hit the bottom of the stack!
.eh_frame Contents
As mentioned above, the .eh_frame4 is an ELF section included in
most programs compiled with a modern compiler. It contains a list of rules that
allow us to rebuild the frame info that is implicitly encoded into the generated
assembly of our program. These rules are called Call Frame Information (CFI)
records, and there is at least one per .eh_frame.
Let’s use the trusty readelf utility to take a peek at the contents
.eh_frame[^.eh_frame] section:
$ readelf --debug-dump=frames memfaultd

Contents of the .eh_frame section:


00000000 0000000000000014 00000000 CIE
  Version:               1
  Augmentation:          "zR"
  Code alignment factor: 1
  Data alignment factor: -8
  Return address column: 16
  Augmentation data:     1b
  DW_CFA_def_cfa: r7 (rsp) ofs 8
  DW_CFA_offset: r16 (rip) at cfa-8
  DW_CFA_nop
  DW_CFA_nop

00000018 0000000000000014 0000001c FDE cie=00000000 pc=00000000001c1180..00000000001c11a6
  DW_CFA_advance_loc: 4 to 00000000001c1184
  DW_CFA_undefined: r16 (rip)
  DW_CFA_nop
  DW_CFA_nop
  DW_CFA_nop
  DW_CFA_nop

00000030 0000000000000024 00000034 FDE cie=00000000 pc=00000000001bd020..00000000001bd130
  DW_CFA_def_cfa_offset: 16
  DW_CFA_advance_loc: 6 to 00000000001bd026
  DW_CFA_def_cfa_offset: 24
  DW_CFA_advance_loc: 10 to 00000000001bd030
  DW_CFA_def_cfa_expression (DW_OP_breg7 (rsp): 8; DW_OP_breg16 (rip): 0; DW_OP_lit15; DW_OP_and; DW_OP_lit11; DW_OP_ge; DW_OP_lit3; DW_OP_shl; DW_OP_plus)
  DW_CFA_nop
  DW_CFA_nop
  DW_CFA_nop
  DW_CFA_nop

...
FDE, CFI, CIE, CFA, oh my! Are these the names of obscure government
agencies? Let’s peel this back layer by layer and try to understand it.
Let’s look at the first three terms here: CFI, CIE, and FDE. All of these
relate to the structure of each frame. The first term, CFI, expands to Common
Frame Information. The CFI represents a grouping of multiple bits of frame
information and is at the highest level of the information hierarchy. Every
CFI will contain one or more CIE and FDE.
Peeling back one more layer, we can start to look at the CIE and FDE. CIE
is an acronym for Common Information Entry and represents a shared set of
instructions that can be used by any FDE in a given CFI. Let’s take a gander
at the CIE in our above example.
Common Information (CIE) Record
00000000 0000000000000014 00000000 CIE
  Version:               1
  Augmentation:          "zR"
  Code alignment factor: 1
  Data alignment factor: -8
  Return address column: 16
  Augmentation data:     1b
  DW_CFA_def_cfa: r7 (rsp) ofs 8
  DW_CFA_offset: r16 (rip) at cfa-8
  DW_CFA_nop
  DW_CFA_nop
We’re not going to cover everything here, but there are a few interesting bits
to note. First, this is CIE entry 0, noted by the preceding 0s before the
CIE marker. This will be interesting later as we look at how FDE’s relate to
CIE. Next, we see some version and alignment information. For our purposes,
let’s skip over those few lines and get to the meat of this ELF. We see a few
lines starting with DW_*. These lines tell us information about how we can
find our registers, as well as our CFA. We’re finally starting to see how we
can fulfill one of our earlier requirements: finding the register locations on
each stack.
We’re about three acronyms deep now, only 20-30 left to get through! Next up is
the FDE we’ve mentioned 4-5 times now. FDE stands for Frame Description
Entry. It is similar to the CIE but more specific in that it represents all
instructions needed to recreate a frame’s structure. Let’s comb through an FDE
to get a better understanding.
Frame Description Entry (FDE) Record
00000018 0000000000000014 0000001c FDE cie=00000000 pc=00000000001c1180..00000000001c11a6
  DW_CFA_advance_loc: 4 to 00000000001c1184
  DW_CFA_undefined: r16 (rip)
  DW_CFA_nop
  DW_CFA_nop
  DW_CFA_nop
  DW_CFA_nop
Stepping through this bit by bit, we can see that we’re using CIE 0 that we
just took a look at. The next bit of interesting information is the PC range.
Each PC range here represents the range of possible PCs for a whole
function. This is important, as the function that you’re in dictates how
registers are pushed onto the stack. If you don’t touch any of them in the
current function, the previous would not need to be saved! After that, we have
the same instructions we previously saw in our CIE. Note that our total set of
instructions are the ones present in the CIE in addition to those defined in
the FDE.
Canonical Frame Address (CFA)
Alright, we’re almost done defining acronyms, I promise! You may have noticed
CFA mentioned in all of our unwind rules defined in both the CIE and FDE.
CFA stands for Canonical Frame Address and is probably the most important part
of our unwind rules. It represents the base address of the frame we’re trying to
reconstruct. Looking out our CIE again, you may recall this line:
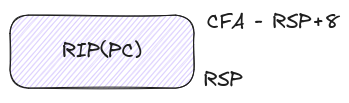
DW_CFA_def_cfa: r7 (rsp) ofs 8
This tells us that our CFA is equal to the rsp(x86-64 stack pointer) + 8.
Neat! A picture may be starting to form in your mind; we’re hand-crafting a
stack frame! Artisanal! Compiler to table! Let’s decode the next line in our
CIE to understand how we can get individual registers.
DW_CFA_offset: r16 (rip) at cfa-8
Here we can see that rip (x86-64 program counter) can be computed by
subtracting 8 from our previously calculated CFA. A visual representation of
this can be seen below:
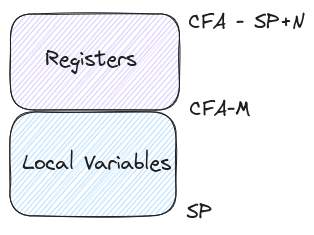
This acts as a kind of base case that we’ll build rules on top of for our future FDEs. Here’s what those unwind rules look like in a more general sense.
Since I’ve already been trying my hardest to make you stop reading, I won’t do
anymore of these individual register unwinds, but you can see the pattern we
have to follow and how we can reconstruct the frame from the information
provided. If you want to read more about the different types of frame rules,
check out the DWARF spec6.
We now know how to build our frame. Let’s see how we hook this up to the Linux core handler to unwind our stack on-device.
Grabbing the Current Thread Info
After diving through the above, we know how we will unwind the stack, but we
need to grab a few other things as well. If you recall from earlier, there are
two other inputs we need for our stacktrace. We need the current state of our
general purpose registers, as well information to help our debugger/addr2line.
Let’s take a look first at how we’ll get the state of the general purpose
registers for each thread.
In our previous
article we touched a
bit on the prstatus7 ELF note This note contains the current status
of the process, and there is one for each of our threads. Recall the layout of
the prstatus7 note from our previous article:
struct elf_prstatus_common
{
 struct elf_siginfo pr_info; /* Info associated with signal */
 short pr_cursig;  /* Current signal */
 unsigned long pr_sigpend; /* Set of pending signals */
 unsigned long pr_sighold; /* Set of held signals */
 pid_t pr_pid;
 pid_t pr_ppid;
 pid_t pr_pgrp;
 pid_t pr_sid;
 struct __kernel_old_timeval pr_utime; /* User time */
 struct __kernel_old_timeval pr_stime; /* System time */
 struct __kernel_old_timeval pr_cutime; /* Cumulative user time */
 struct __kernel_old_timeval pr_cstime; /* Cumulative system time */
};

struct elf_prstatus
{
 struct elf_prstatus_common common;
 elf_gregset_t pr_reg; /* GP registers */
 int pr_fpvalid;  /* True if math co-processor being used.  */
};
Note the pr_reg member of the struct. This will allow us to get the state of
general purpose registers at the time of crash for each thread!
After extracting the state of the GP registers from the note defined above, we can now use that as the starting point for the unwind logic mentioned above. One question remains open, though. How do we get a mapping of main binary and dynamic libs to grab both our unwind info, as well as all the rendezvous information our debugger needs?
Mapping Our Way to Stacks
We now need to grab the following info: what binaries and dynamic libs are
loaded by the program that is crashing, and what are their build IDs and paths.
In our previous articles, we talked about taking advantage of the fact that
procfs is still mounted for a PID that is currently dumping into a pipe core
handler. We’ll do that again here by looking at
/proc/<pid>/maps8!
$ cat /proc/261/maps
00430000-00873000 r-xp 00000000 b3:02 3172       /usr/bin/memfaultd
00882000-008bd000 r--p 00442000 b3:02 3172       /usr/bin/memfaultd
008bd000-008be000 rw-p 0047d000 b3:02 3172       /usr/bin/memfaultd
...
b6c70000-b6c76000 r-xp 00000000 b3:02 544        /lib/libcap.so.2.66
b6c76000-b6c86000 ---p 00006000 b3:02 544        /lib/libcap.so.2.66
b6c86000-b6c87000 r--p 00006000 b3:02 544        /lib/libcap.so.2.66
b6c87000-b6c88000 rw-p 00007000 b3:02 544        /lib/libcap.so.2.66
b6c90000-b6cff000 r-xp 00000000 b3:02 3494       /usr/lib/libzstd.so.1.5.2
b6cff000-b6d0e000 ---p 0006f000 b3:02 3494       /usr/lib/libzstd.so.1.5.2
b6d0e000-b6d0f000 r--p 0006e000 b3:02 3494       /usr/lib/libzstd.so.1.5.2
b6d0f000-b6d10000 rw-p 0006f000 b3:02 3494       /usr/lib/libzstd.so.1.5.2
There is a ton of good information here! First looking at the address range,
this gives us the runtime address we need to calculate our ASLR shift!
To the right of the address range, we see the permission flags for each mapped
segment. These are useful because we want to find the range in which our
executable is mounted to know when we should look at the .eh_frame info for
that particular binary. Since we’re looking for the executable, we need to grab
the range and path for a memory map with the x permission.
Now that we have the binary path, we can grab our unwind information from the
.eh_frame/.eh_frame_hdr sections, as well as our GNU build ID from the
.note.gnu.build-id.
Tying It All Together
We’re almost there, let’s run through what we have:
- ☑️ GP registers from
prstatusnote - ☑️ binary/dynamic lib address range
- ☑️ runtime offset
- ☑️ binary path
- ☑️
.eh_frame/.eh_frame_hdrsections from each binary - ☑️ Build ID from
.note.gnu.build-id
Let’s look at a full example generated from a crash caused by
memfaultctl trigger-coredump9:
{
  "version": "1",
  "signal": "SIGSEGV",
  "cmdline": "memfaultctl\u0000trigger-coredump\u0000",
  "symbols": [
    {
      "pc_range": {
        "start": "0x55ea82cc4000",
        "end": "0x55ea839d3000"
      },
      "build_id": "4dfbaf904988c2cf8277f93d7adbf183884f8ed0",
      "compiled_offset": "0x1bd000",
      "runtime_offset": "0x55ea82cc4000",
      "path": "/home/blake/memfaultd/target/debug/memfaultd"
    },
    {
      "pc_range": {
        "start": "0x789a8e828000",
        "end": "0x789a8e9bd000"
      },
      "build_id": "d5197096f709801829b118af1b7cf6631efa2dcd",
      "compiled_offset": "0x28000",
      "runtime_offset": "0x789a8e828000",
      "path": "/usr/lib/x86_64-linux-gnu/libc.so.6"
    }
  ],
  "threads": [
    {
      "active": true,
      "pcs": [
        "0x55ea82cff77c",
        "0x55ea82cff4a7",
        "0x55ea82cff46f",
        "0x55ea82e2e73f"
        ...
      ]
    }
  ]
}
Starting at the top of our stack, we see this address: 0x55ea82cff77c. If we
look at the address range for memfaultd, we see the following:
"pc_range": {
  "start": "0x55ea82cc4000",
  "end": "0x55ea839d3000"
},
Our address of 0x55ea82cff77c fits in this range, so we know it’s in that
binary. To be able to feed this into addr2line2, we need to first
account for our ASLR1 shift. Note these members of our stacktrace:
"compiled_offset": "0x1bd000",
"runtime_offset": "0x55ea82cc4000",
addr2line2 expects the address fed into it in the address space of
the compiled binary. This means we need to perform the following bit of math:
address - runtime_offset + compiled_offset. After applying that equation, we
get 1f877c.
$ addr2line -Cf -e /home/blake/memfaultd/files/target/debug/memfaultd 1f877c
core::ptr::write
/rustc/d5c2e9c342b358556da91d61ed4133f6f50fc0c3/library/core/src/ptr/mod.rs:1377
From the above you can see we’re in the suspect line that caused our crash! Just
as expected, it’s a NULL pointer write! To get the full stacktrace, the above
process will be repeated for each function in the call stack!
Conclusion
We made it! We got through the densest wall of acryonyms ever created, and arrived at a method of capturing crashes on-device that preserves the privacy of end users while also shrinking size requirements considerably.
Let’s recap what we’ve learned in this series of articles.
In Part 1 we covered the basics of how Linux coredumps work. This set the stage for the rest of our articles as we learned about the general structure of an ELF core file.
In Part 2, we tackled one of the biggest problems we see with coredumps in Linux, the size. Using information from the coredump itself, we captured only the stacks while discarding all heap values.
Finally, in this article, we addressed another problem, privacy. Coredumps can potentially contain customer data; after all, they are just snapshots of memory. Our final implementation gets rid of all stack and heap memory. The downside here is that we no longer get to inspect local variables. For most crashes this is an acceptable tradeoff. If you’d like to dive deeper into the full implementation of the on-device unwinding, you can find it here.
See anything you'd like to change? Submit a pull request or open an issue on our GitHub
References
 Blake Hildebrand is an embedded software engineer at Memfault. Blake previously worked on embedded software teams at Garmin and Amazon Robotics.