GNU Binutils: the ELF Swiss Army Knife
There’s a lot that takes place between the C code you write and the binary that winds up executing on a device. Understanding how to look at and inspect what is emitted by the compiler saves time and can improve your efficiency in many areas of the development lifecycle – such as debugging system problems, identifying issues with compilers or debug info emitted, reducing the size of binaries, and optimizing an application for performance and latency.
In this article, we will explore some of my favorite binary introspection tools, such as GNU Binutils. The material is geared toward the embedded software crowd that typically writes C and C++, but many of the ideas, tools, and lessons learned can be applied to a variety of low-level software. We will walk through practical examples of how the tools can be leveraged to aid in the development process irrespective of the compiler you are using (e.g. GCC, Clang, IAR, ARMCC, etc).
Table of Contents
Terminology
Executable and Linkable Format (ELF)
Introduced in the late 1980s as part of the Unix operating system, ELF has become the ubiquitous output format used by compilers for embedded development. A full discussion of the ELF file format is outside the scope of this article, but at a high level, it’s a binary data format which holds program data as well as debug information in different “sections”. Since the format is well specified, many tools have been developed to parse it.
It is easy to check if a file is an ELF format by
inspecting the first four bytes of the file where you should see 0x7f followed by “ELF”:
$ xxd -l4 <YOUR ELF FILE>
00000000: 7f45 4c46                                .ELF
Compilers and IDEs will sometimes use different extensions for ELF artifacts. The most common ones
you will see are .elf, .out, or .axf.
DWARF
DWARF is a standardized format1 for representing debug information (i.e symbol names, struct layouts, how to recover backtraces, etc). The format was developed in the late 1980s as part of Unix System V Release 4 (SVR4):
Fun Fact: “The name DWARF is something of a pun, since it was developed along with the ELF object file format. The name is an acronym for “Debugging With Arbitrary Record Formats””.2
When a program is compiled with debug information enabled (e.g. with the -g CFLAG), this
information will be written into special .debug_ ELF sections that look like:
$ readelf -S <ELF>
  ...
  [ 8] .debug_info       PROGBITS        00000000 0200f4 00980b 00      0   0  1
  [ 9] .debug_abbrev     PROGBITS        00000000 0298ff 001adf 00      0   0  1
  [10] .debug_loc        PROGBITS        00000000 02b3de 003bf7 00      0   0  1
  [11] .debug_aranges    PROGBITS        00000000 02efd5 0004f0 00      0   0  1
  [12] .debug_ranges     PROGBITS        00000000 02f4c5 0007d8 00      0   0  1
  [13] .debug_macro      PROGBITS        00000000 02fc9d 0031dd 00      0   0  1
  [14] .debug_line       PROGBITS        00000000 032e7a 005447 00      0   0  1
  [15] .debug_str        PROGBITS        00000000 0382c1 00dedd 01  MS  0   0  1
stabs, COFF, XCOFF
While rather infrequent, if you are working with custom compilers (such as those shipped with some DSPs), you may see binary or debug information emitted in alternative formats such as stabs, COFF, or XCOFF. These are all legacy formats that have largely been superseded by ELF and DWARF. I view it as a red-flag in the evaluation process if a vendor’s compiler emits information in these formats. At this point, a lot of binary inspection tools have deprecated support for these formats, which makes it harder to debug and workaround issues on chips using them.
GNU Binutils
GNU Binutils is a collection of tools that can be used alongside GNU GCC to inspect and edit binaries. Most of these tools operate on ELFs, and for Linux as well as most embedded software, both the individual object files (.o) and the final linked output (the ELF) are in this format.
Installing Binutils with a Package Manager
Binutils can easily be installed with a package manager on OSX or Linux:
- OSX:
brew install binutils - Linux:
apt-get install binutils
Installing Binutils From Source
Sometimes it can be fun (or useful) to compile the latest GNU Binutil to get a preview of unreleased features or customize the supported architecture targets in the build. If you want to try compiling from source, you can run the following:
$ git clone git://sourceware.org/git/binutils-gdb.git
$ git log --oneline -1
3349112e38 elf: Remove zero-sized relocation section from section group
$ ./configure --prefix=/usr/local/binutils_latest/arm-none-eabi --target=arm-none-eabi
--with-python --disable-ld
$ make
$ # Wait 10-20 minutes ...
$ ./binutils/size --version
GNU size (GNU Binutils) 2.34.50.20200404
Copyright (C) 2020 Free Software Foundation, Inc.
This program is free software; you may redistribute it under the terms of
the GNU General Public License version 3 or (at your option) any later version.
This program has absolutely no warranty.
Compiling Binutils For Multiple Targets
A typical GNU Binutil release will only include select targets. For example, the official GNU ARM toolchain3 includes:
$ arm-none-eabi-addr2line --help | grep "supported targets"

arm-none-eabi-addr2line: supported targets: elf32-littlearm
elf32-littlearm-fdpic elf32-bigarm elf32-bigarm-fdpic elf32-little
elf32-big srec symbolsrec verilog tekhex binary ihex plugin
However, Binutils can be compiled to support multiple architectures / targets from the same binary!
If you are switching between architectures frequently, you can compile a
single Binutil’s image by utilizing the --enable-targets configure option. You can either provide a comma separated list
of targets to enable a select subset or use --enable-targets=all to enable all supported targets
(which is over 250 targets!).
GNU Binutil Command Examples
In the sections that follow, we will walk through examples of using various commands to examine ELFs. If you would like to run any of the commands locally, the source code along with build instructions for the example code can be found in the Interrupt Github Repo.
readelf
readelf lets us get overall summaries of the different sections of an ELF.
Dumping Sections in an ELF
With the -S option, we can see the sections that will be included in the final binary as well as sections with special
information such as the .debug_* or NOTE sections.
$ arm-none-eabi-readelf -S nrf52_example/build/nrf52.elf
There are 22 section headers, starting at offset 0x48e7c:

Section Headers:
  [Nr] Name              Type            Addr     Off    Size   ES Flg Lk Inf Al
  [ 0]                   NULL            00000000 000000 000000 00      0   0  0
  [ 1] .interrupts       PROGBITS        00000000 010000 000048 00   A  0   0  4
  [ 2] .gnu_build_id     NOTE            00000048 010048 000024 00   A  0   0  4
  [ 3] .text             PROGBITS        00000070 010070 001858 00  AX  0   0 16
  [ 4] .data             PROGBITS        20000000 020000 0000f4 00  WA  0   0  4
  [ 5] .bss              NOBITS          200000f4 0200f4 0029a4 00  WA  0   0  4
  [ 6] .heap             PROGBITS        20002a98 0200f4 000000 00   W  0   0  1
  [ 7] .stack            NOBITS          20002a98 0200f4 000400 00  WA  0   0  1
  [ 8] .debug_info       PROGBITS        00000000 0200f4 00980b 00      0   0  1
  [ 9] .debug_abbrev     PROGBITS        00000000 0298ff 001adf 00      0   0  1
  [10] .debug_loc        PROGBITS        00000000 02b3de 003bf7 00      0   0  1
  [11] .debug_aranges    PROGBITS        00000000 02efd5 0004f0 00      0   0  1
  [12] .debug_ranges     PROGBITS        00000000 02f4c5 0007d8 00      0   0  1
  [13] .debug_macro      PROGBITS        00000000 02fc9d 0031dd 00      0   0  1
  [14] .debug_line       PROGBITS        00000000 032e7a 005447 00      0   0  1
  [15] .debug_str        PROGBITS        00000000 0382c1 00dedd 01  MS  0   0  1
  [16] .comment          PROGBITS        00000000 04619e 000079 01  MS  0   0  1
  [17] .ARM.attributes   ARM_ATTRIBUTES  00000000 046217 000032 00      0   0  1
  [18] .debug_frame      PROGBITS        00000000 04624c 000d8c 00      0   0  4
  [19] .symtab           SYMTAB          00000000 046fd8 0014c0 10     20 265  4
  [20] .strtab           STRTAB          00000000 048498 000905 00      0   0  1
  [21] .shstrtab         STRTAB          00000000 048d9d 0000df 00      0   0  1
Key to Flags:
  W (write), A (alloc), X (execute), M (merge), S (strings), I (info),
  L (link order), O (extra OS processing required), G (group), T (TLS),
  C (compressed), x (unknown), o (OS specific), E (exclude),
  y (purecode), p (processor specific)
Dumping Compiler ABI Info
Every MCU architecture has an Application Binary Interface (ABI). An ABI details things such as
which registers to use for passing arguments and which ones must be preserved across function
calls. Sometimes, a given architecture may have several ABI configuration options which can be
selected via compiler flags. For example, on ARMv7-m, there are two different ABIs which can be used
for passing floating point arguments as parameters. One which passes arguments in “VFP” registers
and one which uses general purpose registers4. We can discover which options are used along with
some other information by using readelf’s -A argument:
$ arm-none-eabi-readelf -A nrf52_example/build/nrf52.elf
Attribute Section: aeabi
File Attributes
  Tag_CPU_name: "7E-M"
  Tag_CPU_arch: v7E-M
  Tag_CPU_arch_profile: Microcontroller
  Tag_THUMB_ISA_use: Thumb-2
  Tag_FP_arch: VFPv4-D16
  Tag_ABI_PCS_wchar_t: 4
  Tag_ABI_FP_denormal: Needed
  Tag_ABI_FP_exceptions: Needed
  Tag_ABI_FP_number_model: IEEE 754
  Tag_ABI_align_needed: 8-byte
  Tag_ABI_enum_size: small
  Tag_ABI_HardFP_use: SP only
  Tag_ABI_VFP_args: VFP registers
  Tag_ABI_optimization_goals: Aggressive Size
  Tag_CPU_unaligned_access: v6
Dumping DWARF Information
A DWARF section is comprised of a sequence of “Debugging Information Entries” referred to as
DIEs. You can use readelf to dump a human readable representation of all the debug information in
the ELF:
$ arm-none-eabi-readelf --debug-dump nrf52_example/build/nrf52.elf
  Compilation Unit @ offset 0x0:
   Length:        0x4f9 (32-bit)
   Version:       4
   Abbrev Offset: 0x0
   Pointer Size:  4
 <0><b>: Abbrev Number: 1 (DW_TAG_compile_unit)
    <c>   DW_AT_producer    : (indirect string, offset: 0x2cc5): GNU C17 9.2.1 20191025 (release) [ARM/arm-9-branch revision 277599] -mcpu=cortex-m4 -mfloat-abi=hard -mfpu=fpv4-sp-d16 -mthumb -march=armv7e-m+fp -g3 -Os -ffunction-sections -fdata-sections
    <10>   DW_AT_language    : 12       (ANSI C99)
    <11>   DW_AT_name        : (indirect string, offset: 0x4576): main.c
    <15>   DW_AT_comp_dir    : (indirect string, offset: 0x3692): example/best-of-binutils
    <19>   DW_AT_ranges      : 0x18
    <1d>   DW_AT_low_pc      : 0x0
    <21>   DW_AT_stmt_list   : 0x0
    <25>   DW_AT_GNU_macros  : 0x0
[...]
Auditing Compiler Flag Settings
There are certain DIEs that are often interesting to look at in isolation. For example, you can
look at DW_AT_producer DIE on GCC and Clang to see the compiler flags which were used.
$ arm-none-eabi-readelf --debug-dump nrf52_example/build/nrf52.elf |
   grep DW_AT_producer.*:

    <c>   DW_AT_producer    :
    (indirect string, offset: 0x2cc5): GNU C17 9.2.1 20191025 (release)
    [ARM/arm-9-branch revision 277599]
    -mcpu=cortex-m4 -mfloat-abi=hard -mfpu=fpv4-sp-d16 -mthumb
    -march=armv7e-m+fp -g3 -Os -ffunction-sections -fdata-sections
NOTE: For more details about good compiler flag settings for embedded devices in general, check out our post on the topic here.
Read the GNU Build ID
When using a GNU Build ID, the -n option can be used to quickly
print note sections and see the value.
$ arm-none-eabi-readelf -n nrf52_example/build/nrf52.elf

Displaying notes found in: .gnu_build_id
  Owner                Data size    Description
  GNU                  0x00000014	NT_GNU_BUILD_ID (unique build ID bitstring)
  Build ID: c61acc0ab0602a9f53bcc36b91d017834129fea1
NOTE: To learn more about GNU Build IDs and how to easily add one to your project, check out this article.
strings
As the name implies, strings will display all the strings in a binary. I typically use the tool
in the following ways:
- To check for security holes in a binary (i.e encryption keys, hard coded passwords, etc)
- As a mechanism for quickly saving code space. More often than not there are a couple unexpectedly long file names or command line strings in a binary that can be trimmed.
There’s two particularly helpful arguments:
-
-d- Causes only data sections (code in the actual binary) to be scanned rather than parts of the ELF that are not in the binary. -
-n <number>- Can be used to control the minimum string length scanned for.
Leveraging strings to Save Code Space
Let’s take a look at the longest strings in the Zephyr samples/net/wifi application:
$ cd <zephyr_project>/samples/net/wifi
$ west build -b disco_l475_iot1

$ arm-none-eabi-strings -n5 -d build/zephyr/zephyr.elf |
   awk '{ print length, $0 }' | sort -n
// ...
94 Ctrl+a, Ctrl+b, Ctrl+c, Ctrl+d, Ctrl+e, Ctrl+f, Ctrl+k, Ctrl+l, Ctrl+n, Ctrl+p, Ctrl+u, Ctrl+w
96 'net dns <hostname> [A or AAAA]' queries IPv4 address (default) or IPv6 address for a host name.
99 'net ping [-c count] [-i interval ms] <host>' Send ICMPv4 or ICMPv6 Echo-Request to a network host.
104 'log disable <module_0> .. <module_n>' disables logs in specified modules (all if no modules specified).
130 'log enable <level> <module_0> ...  <module_n>' enables logs up to given level in specified modules (all if no modules specified).
148 Some terminals are not sending separate escape code for backspace and delete button. This command forces shell to interpret delete key as backspace.
159 Console gets terminal screen size or assumes 80 in case the readout fails. It must be executed after each terminal width change to ensure correct text display.
Neat! We’ve found a few long strings printed by the console that we could consider removing if we were desperate to save some code space!
nm
nm lets you inspect the locations and sizes of symbols within a binary. It can be a quick way to
find the address of particular symbols or identify which symbols are taking up the most space in a
binary.
The default output looks like this:
arm-none-eabi-nm  build/zephyr/zephyr.elf
# symbol address | section type | symbol name |
080107cc T z_unpend_thread_no_timeout
080009e0 T z_vprintk
0800c2b2 T z_work_q_main
Decoding nm Section Type
The section type is a one character shorthand where:
| Shorthand | Type |
t or T
|
text symbol |
r or R
|
read only data symbol |
d or D
|
read/write data symbol |
b or B
|
BSS / Zero initialized symbol |
Letters are capitalized if the symbol is global and lower case if the symbols are private to the compilation unit (i.e a static in a C file).
Useful arguments
-
-S- print the size of the symbol -
-l- print the line number -
--size-sort- sort the symbols by size and display the sizes. -
-t- change the radix. For example numbers can be displayed in decimal instead of hex by using-t dec
Finding Largest Symbols
We can use nm to quickly identify what the largest objects in the binary are. When doing this, I
like to change the radix to decimal and use the --size-sort argument. Let’s try it out:
$ arm-none-eabi-nm --size-sort -t dec -l  build/zephyr/zephyr.elf
[...]
00002048 B rx_stack	subsys/net/ip/net_tc.c:28
00002048 b shell_uart_stack	subsys/shell/shell_uart.c:24
00002048 B tx_stack	subsys/net/ip/net_tc.c:22
00002560 b net_buf_data_rx_bufs	subsys/net/ip/net_pkt.c:117
00002560 b net_buf_data_tx_bufs	subsys/net/ip/net_pkt.c:119
00002564 b eswifi0	drivers/wifi/eswifi/eswifi_core.c:37
Finding Largest Functions
We can also pipe the result into grep to get largest sizes by section type. For example, to limit our search to text sections:
$ arm-none-eabi-nm --size-sort -t dec -l  build/zephyr/zephyr.elf  |
   grep " t " -i
[...]
00000702 T __udivmoddi4
00000796 t eswifi_request_work	zephyr/drivers/wifi/eswifi/eswifi_core.c:322
00000806 T z_vprintk	zephyr/lib/os/printk.c:104
00001898 T shell_process	zephyr/subsys/shell/shell.c:1292
00001978 T z_prf	zephyr/lib/libc/minimal/source/stdout/prf.c:446
Computing Code Size of a Single C File
We can further pipe our results into a CLI command like awk to sum totals and compute the codesize
of a single object file. For example, let’s look at lib/os/printk.c:
$ arm-none-eabi-nm  -l --size-sort -t dec build/zephyr/zephyr.elf |
  grep " t .*printk\.c" -i | cut -d ' ' -f 1 |
  awk '{total += $0} END{print "sum="total}'
sum=1180
ar
ar can be used for building and inspecting static libraries. Large projects will often build
subcomponents into static libraries or wind up including a .a provided by a vendor.
The most typical invocation of ar you will see in a project is something like:
arm-none-eabi-ar rcs mylib.a file1.o file2.o file3.o
where:
-
r- tellsarto add the .o files to the archive -
c- turns off warnings if a new archive had to be created -
s- adds an index section to the archive for faster linking
Common Confusion Point
Let’s build a simple static library from the following code:
// library.h
#pragma once
void my_library_function(void);
// main.c
#include "library.h"

int main (int argc, char *argv[]) {
  my_library_function();
}
// lib_v1.c
#include <stdio.h>

#include "library.h"

void my_library_function(void) {
  printf("%s  %s:%d: Version 1\n", __func__, __FILE__, __LINE__);
}
To create the static library, mylib.a, we run the following:
$ gcc -c -o lib_v1.o lib_v1.c
$ ar rcs mylib.a lib_v1.o
$ gcc main.c mylib.a
Running the application, we see:
$ ./a.out
my_library_function  lib_v1.c:6: Version 1
Now lets “refactor” the code and move our my_library_function() to a new file, lib_v2.c,
archive it into mylib.a and rebuild our final application:
$ cp lib_v1.c lib_v2.c
$ gcc -c -o lib_v2.o lib_v2.c
$ ar rcs mylib.a lib_v2.o
$ gcc main.c mylib.a
Pop Quiz: What do you expect to see print?
- A:
my_library_function lib_v1.c:6: Version 1 - B:
my_library_function lib_v2.c:6: Version 1
Let’s try it out and find out:
$ ./a.out
my_library_function  lib_v1.c:6: Version 1
Interesting, we are seeing the print message from our original implementation which was in
lib_v1.c but not the new one from lib_v2.c.
We can use the t option of ar to display the contents of the archive:
ar t mylib.a
lib_v1.o
lib_v2.o
Aha, lib_v1.o is still in the archive. We can delete it using the d option and recompile:
$ ar d  mylib.a lib_v1.o
$ gcc main.c mylib.a
Now when we run ./a.out, we see the print message from lib_v2.c as we would expect.
$ ./a.out
my_library_function  lib_v2.c:6: Version 1
Recreate static libraries to avoid using out-of-date objects
The behavior we observed above is because ar, unlike other Binutil commands, appends to a
pre-existing file if it exists. With embedded software, since creating a new archive is very fast,
I recommend just deleting any pre-existing archive when a new one gets generated. For example, we
achieve this in the Make rule below by adding rm -f $@ before the ar invocation:
$(MYLIB_TARGET): $(MYLIB_OBJ_FILES)
    @echo "Generating $@"
    rm -f $@
    arm-none-eabi-ar rcs $@ $(MYLIB_OBJ_FILES)
This way you are guaranteed to not have stale object files in your archive even if you don’t do a full rebuild.
objdump
objdump is a general purpose utility that is most helpful when trying to examine the assembly in
a binary. It’s also my personal favorite! You can run objdump on the final ELF output or
individual .o object files. While there are a number of options, most of the time the following
are most useful:
-d to display the assembly code for all executable sections.
--disassemble=<symbol> to display the assembly for just one function
Let’s walk through a few examples of the types of questions we can answer with objdump.
Inspecting Stack Usage
Above we saw one of the biggest functions in the Zephyr ELF we were looking at was
z_printk. Let’s check out the amount of stack it uses.
$ arm-none-eabi-objdump   -d build/zephyr/zephyr.elf
  --disassemble=eswifi_request_work | less
08003964 <eswifi_request_work>:
=> 8003964:       e92d 4ff0       stmdb   sp!, {r4, r5, r6, r7, r8, r9, sl, fp, lr}
   8003968:       f890 4071       ldrb.w  r4, [r0, #113]  ; 0x71
   800396c:       2c01            cmp     r4, #1
=> 800396e:       b08f            sub     sp, #60 ; 0x3c
   8003970:       4605            mov     r5, r0
   8003972:       f1a0 0698       sub.w   r6, r0, #152    ; 0x98
We can see a push of 9 registers and a subtraction of 60 bytes from $sp which tells us the stack
consumption for the function is around 96 bytes.
If you are trying to do an in-depth stack usage analysis you can also use the GCC compiler flag,
-fstack-usage. This will emit.sufiles alongside the.ofiles which contain information of stack utilization for all the functions in the object file. Some tools, such as puncover, can also analyze.sufiles to determine worst-case stack depth for call chains.
Examining Optimizations
When looking at backtraces in a debugger, sometimes functions that should be in the backtrace are not displayed. While the compiler tries its best to emit debug information that allows for the backtraces to be recovered, certain optimizations (such as inlining) make this really difficult. If a backtrace looks suspicious, I like to look at the assembly to see if inlining or other types of optimizations may have taken place. Lets look at a simple example:
static int prv_compute_power_sum(int count) {
  int result = 0;

  for (int i = 0; i < count; i++) {
    result += i * i;
  }

  return result;
}


int compute_power_sum(int count) {
  if (count < 0) {
    return -1;
  }

  return prv_compute_power_sum(count);
}
$ arm-none-eabi-objdump -d nrf52_example/build/nrf52.elf
   --disassemble=compute_power_sum

00000134 <compute_power_sum>:
     134:	1e02        subs	r2, r0, #0
     136:	db08        blt.n	14a <compute_power_sum+0x16>
     138:	2300        movs	r3, #0
     13a:	4618        mov	r0, r3
     13c:	429a        cmp	r2, r3
     13e:	d100        bne.n	142 <compute_power_sum+0xe>
     140:	4770        bx	lr
     142:	fb03 0003   mla	r0, r3, r3, r0
     146:	3301        adds	r3, #1
     148:	e7f8        b.n	13c <compute_power_sum+0x8>
     14a:	f04f 30ff   mov.w	r0, #4294967295	; 0xffffffff
     14e:	4770        bx	lr
Interesting, no calls to prv_compute_power_sum(). This tells us the call was inlined! We can also
use the -S option to display the source code the assembly was generated from.
DISCLAIMER: While this can be helpful at times, the assembly to source code mapping isn’t always correct.
00000134 <compute_power_sum>:

  return result;
}

int compute_power_sum(int count) {
  if (count < 0) {
     134:	1e02        subs	r2, r0, #0
     136:	db08        blt.n	14a <compute_power_sum+0x16>
  for (int i = 0; i < count; i++) {
     138:	2300        movs	r3, #0
  int result = 0;
     13a:	4618        mov	r0, r3
  for (int i = 0; i < count; i++) {
     13c:	429a        cmp	r2, r3
     13e:	d100        bne.n	142 <compute_power_sum+0xe>
     140:	4770        bx	lr
    result += i * i;
     142:	fb03 0003   mla	r0, r3, r3, r0
  for (int i = 0; i < count; i++) {
     146:	3301        adds	r3, #1
     148:	e7f8        b.n	13c <compute_power_sum+0x8>
    return -1;
     14a:	f04f 30ff   mov.w	r0, #4294967295	; 0xffffffff
  }

  return prv_compute_power_sum(count);
}
14e:	4770        bx	lr
Comparing Code Size
If you are crunched for space, it can be useful to understand what coding patterns are more
favorably optimized. This type of analysis can easily be run with objdump.
Pop Quiz: Which of the Following will Yield Smaller Code?
const char *test_enum_to_str_v1(eTestEnum e) {
  switch (e) {
    case kTestEnum_Val1:
      return "Val1";
    case kTestEnum_Val2:
      return "Val2";
    case kTestEnum_Val3:
      return "Val3";
    case kTestEnum_Val4:
    default:
      return "Val4";
  }
}
const char *test_enum_to_str_v2(eTestEnum e) {
  if (e == kTestEnum_Val1) {
    return "Val1";
  } else if (e == kTestEnum_Val2) {
    return "Val2";
  } else if (e == kTestEnum_Val3) {
    return "Val3";
  } else if (e == kTestEnum_Val4) {
    return "Val4";
  }
  return "Val4";
}
NOTE: We’ve compiled both snippets with
-Osto force a size based optimization
test_enum_to_str_v1 Assembly
$ arm-none-eabi-objdump -d nrf52_example/build/nrf52.elf \
   --disassemble=test_enum_to_str_v1
0000015c <test_enum_to_str_v1>:
 15c:	2802        cmp	r0, #2
 15e:	bf9a        itte	ls
 160:	4b02        ldrls	r3, [pc, #8]	; (16c <test_enum_to_str_v1+0x10>)
 162:	f853 0020   ldrls.w	r0, [r3, r0, lsl #2]
 166:	4802        ldrhi	r0, [pc, #8]	; (170 <test_enum_to_str_v1+0x14>)
 168:	4770        bx	lr
 16a:	bf00        nop
 16c:	20000020    .word	0x20000020
 170:	2000000a    .word	0x2000000a
test_enum_to_str_v2 Assembly
$ arm-none-eabi-objdump -d nrf52_example/build/nrf52.elf  \
   --disassemble=test_enum_to_str_v1
00000174 <test_enum_to_str_v2>:
 174:	b140        cbz	r0, 188 <test_enum_to_str_v2+0x14>
 176:	2801        cmp	r0, #1
 178:	d008        beq.n	18c <test_enum_to_str_v2+0x18>
 17a:	4b05        ldr	r3, [pc, #20]	; (190 <test_enum_to_str_v2+0x1c>)
 17c:	4a05        ldr	r2, [pc, #20]	; (194 <test_enum_to_str_v2+0x20>)
 17e:	2802        cmp	r0, #2
 180:	bf0c        ite	eq
 182:	4618        moveq	r0, r3
 184:	4610        movne	r0, r2
 186:	4770        bx	lr
 188:	4803        ldr	r0, [pc, #12]	; (198 <test_enum_to_str_v2+0x24>)
 18a:	4770        bx	lr
 18c:	4803        ldr	r0, [pc, #12]	; (19c <test_enum_to_str_v2+0x28>)
 18e:	4770        bx	lr
 190:	20000019    .word	0x20000019
 194:	2000000a    .word	0x2000000a
 198:	2000000f    .word	0x2000000f
 19c:	20000014    .word	0x20000014
Interesting, while both functions have the same behavior, the switch case based approach winds up being 50% smaller! It looks like the compiler has optimized that approach better by using a lookup table instead of branching.
Note: This behavior is subject to change from compiler version to compiler version.
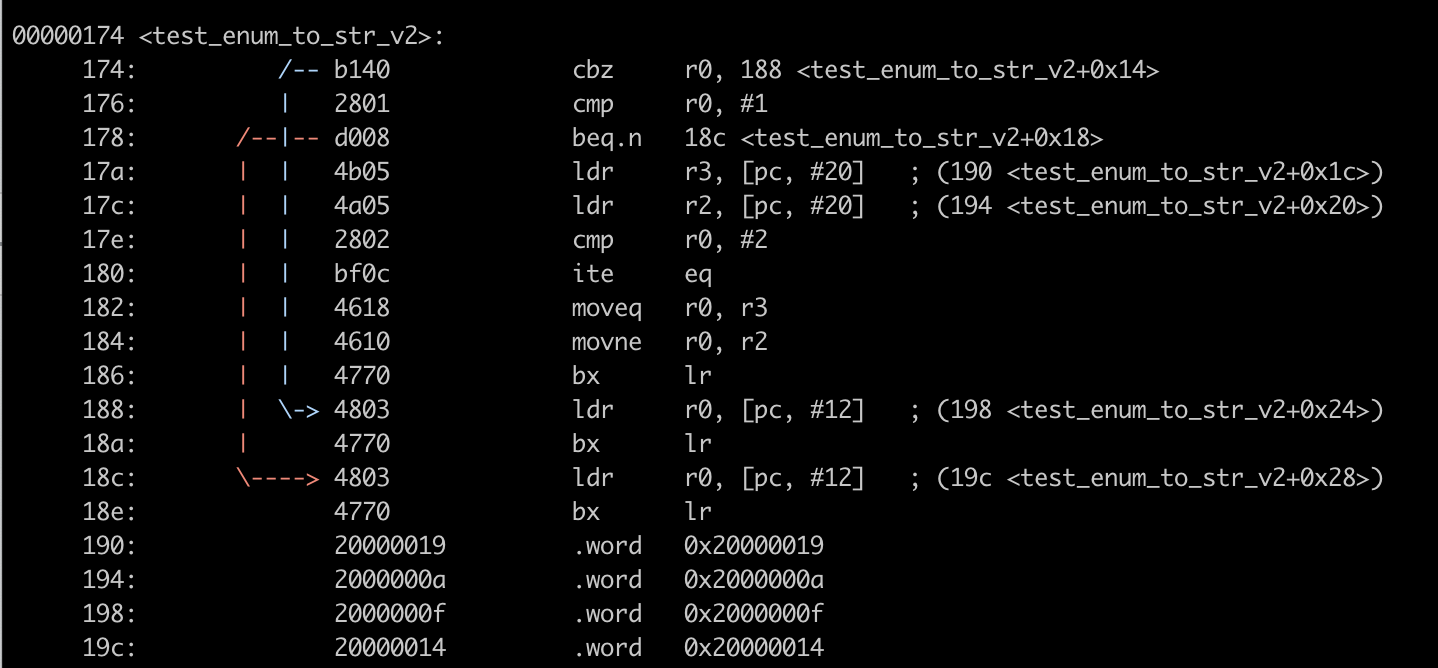
New Feature: Visualize Jumps
Binutils is constantly adding new features. While writing this post, I discovered a new option in
objdump, --visualize-jumps, that was just released in binutils 2.34. This option generates
ASCII art showing the branching flow within individual functions which will be very
helpful for following control flow when stepping through assembly:
$ binutils/objdump  --visualize-jumps=color
   --disassemble=test_enum_to_str_v2 nrf52_example/build/nrf52.elf
strip
As the name implies, strip removes sections from an ELF. Most commonly you will see it used for
stripping things like debug info from an ELF. If you are distributing your ELF files, stripping
debug information can make it harder to reverse engineeryour code. Here is an example:
# Confirm ELF originally has debug info
$ arm-none-eabi-readelf -S nrf52_example/build/nrf52.elf | grep debug
  [ 8] .debug_info       PROGBITS        00000000 0200f4 00980b 00      0   0  1
  [ 9] .debug_abbrev     PROGBITS        00000000 0298ff 001adf 00      0   0  1
  [10] .debug_loc        PROGBITS        00000000 02b3de 003bf7 00      0   0  1
  [11] .debug_aranges    PROGBITS        00000000 02efd5 0004f0 00      0   0  1
  [12] .debug_ranges     PROGBITS        00000000 02f4c5 0007d8 00      0   0  1
  [13] .debug_macro      PROGBITS        00000000 02fc9d 0031dd 00      0   0  1
  [14] .debug_line       PROGBITS        00000000 032e7a 005447 00      0   0  1
  [15] .debug_str        PROGBITS        00000000 0382c1 00dedb 01  MS  0   0  1
  [18] .debug_frame      PROGBITS        00000000 046248 000d8c 00      0   0  4

# Remove debug info
$ arm-none-eabi-strip -g nrf52_example/build/nrf52.elf

# Confirm ELF no longer has debug info
$ arm-none-eabi-readelf -S nrf52_example/build/nrf52.elf | grep debug
objcopy
objcopy is most commonly used as the last stage of a build to generate the .bin or .hex file which
can be flashed onto a device. Unlike an operating system where there is a “dynamic loader” that
resolves addresses and loads libraries at runtime, on embedded devices all of the memory locations
are typically resolved at link time.
$ arm-none-eabi-objcopy firmware.elf firmware.bin -O binary
NOTE: For an example of using objcopy to build a bootloader for an embedded device, check out this post.
Converting Binaries into an Object (.o) File
For embedded development you may want to include binary artifacts into a firmware as a byte array. For example, sometimes a firmware will include binaries that need to be loaded onto peripherals, such as a GPS or accelerometer firmware image. One neat thing you can do with objcopy is convert any binary blob into an object file that can then be linked in your image.
For example, if you want to include my_binary.bin in an image, you could create a .o as
follows:
$ arm-none-eabi-objcopy -I binary -O elf32-littlearm
   --add-section my_binary_section=my_binary.bin my_binary.bin
  my_binary.o
objcopy will emit symbols in the object that then make it easy to reference the blob from your
C Code:
arm-none-eabi-nm -S -l my_binary.o
00000031 D _binary_my_binary_bin_end
00000031 A _binary_my_binary_bin_size
00000000 D _binary_my_binary_bin_start
addr2line
addr2line converts addresses back to function and line numbers.
Useful Arguments
-
-aTo show the address which was decoded. This can be useful when decoding multiple addresses at once or usingaddr2linein a batch processing mode. -
-fTo display the function name the address is in -
-e <ELF>To specify the executable to decode. (Otherwise,addr2linechecks fora.outin the working directory and uses that.)
Example Usage
You can run it on a single address:
$ arm-none-eabi-addr2line -a -f -e build/zephyr/zephyr.elf 0x08000946
  0x08000946
_printk_dec_ulong
zephyr/lib/os/printk.c:465
or pipe a bunch of addresses in from stdin and get them all decoded at once
$ echo -e "0x8000946\n0x8000336" |
   arm-none-eabi-addr2line -a -f -e build/zephyr/zephyr.elf
0x08000946
_printk_dec_ulong
zephyr/lib/os/printk.c:465
0x08000336
__udivmoddi4
size
size walks through the sections in the ELF and sums up the totals for all sections which are
allocated. This can be useful for getting a quick summary of what the binary footprint looks like:
$ arm-none-eabi-size build/zephyr/zephyr.elf
text data bss dec hex filename
84340 2416 32157 118913 1d081 build/zephyr/zephyr.elf
Additional Tools for Examining ELFs
There’s a number of additional tools aside from GNU Binutils which I’ve found tremendously useful over the years. While a full discussion of them is outside the scope of this article (and merits a blog post of their own), I’ve included some of my favorite highlights in the following sections.
Godbolt (aka Compiler Explorer)
No discussion of binary inspection is complete without a shout out to Compiler Explorer. This is an online tool that allows you to compile snippets of code against a ridiculous amount of different compilers. Even better you can create short urls and share links with friends.
For example, here is an interesting one I was looking at recently.
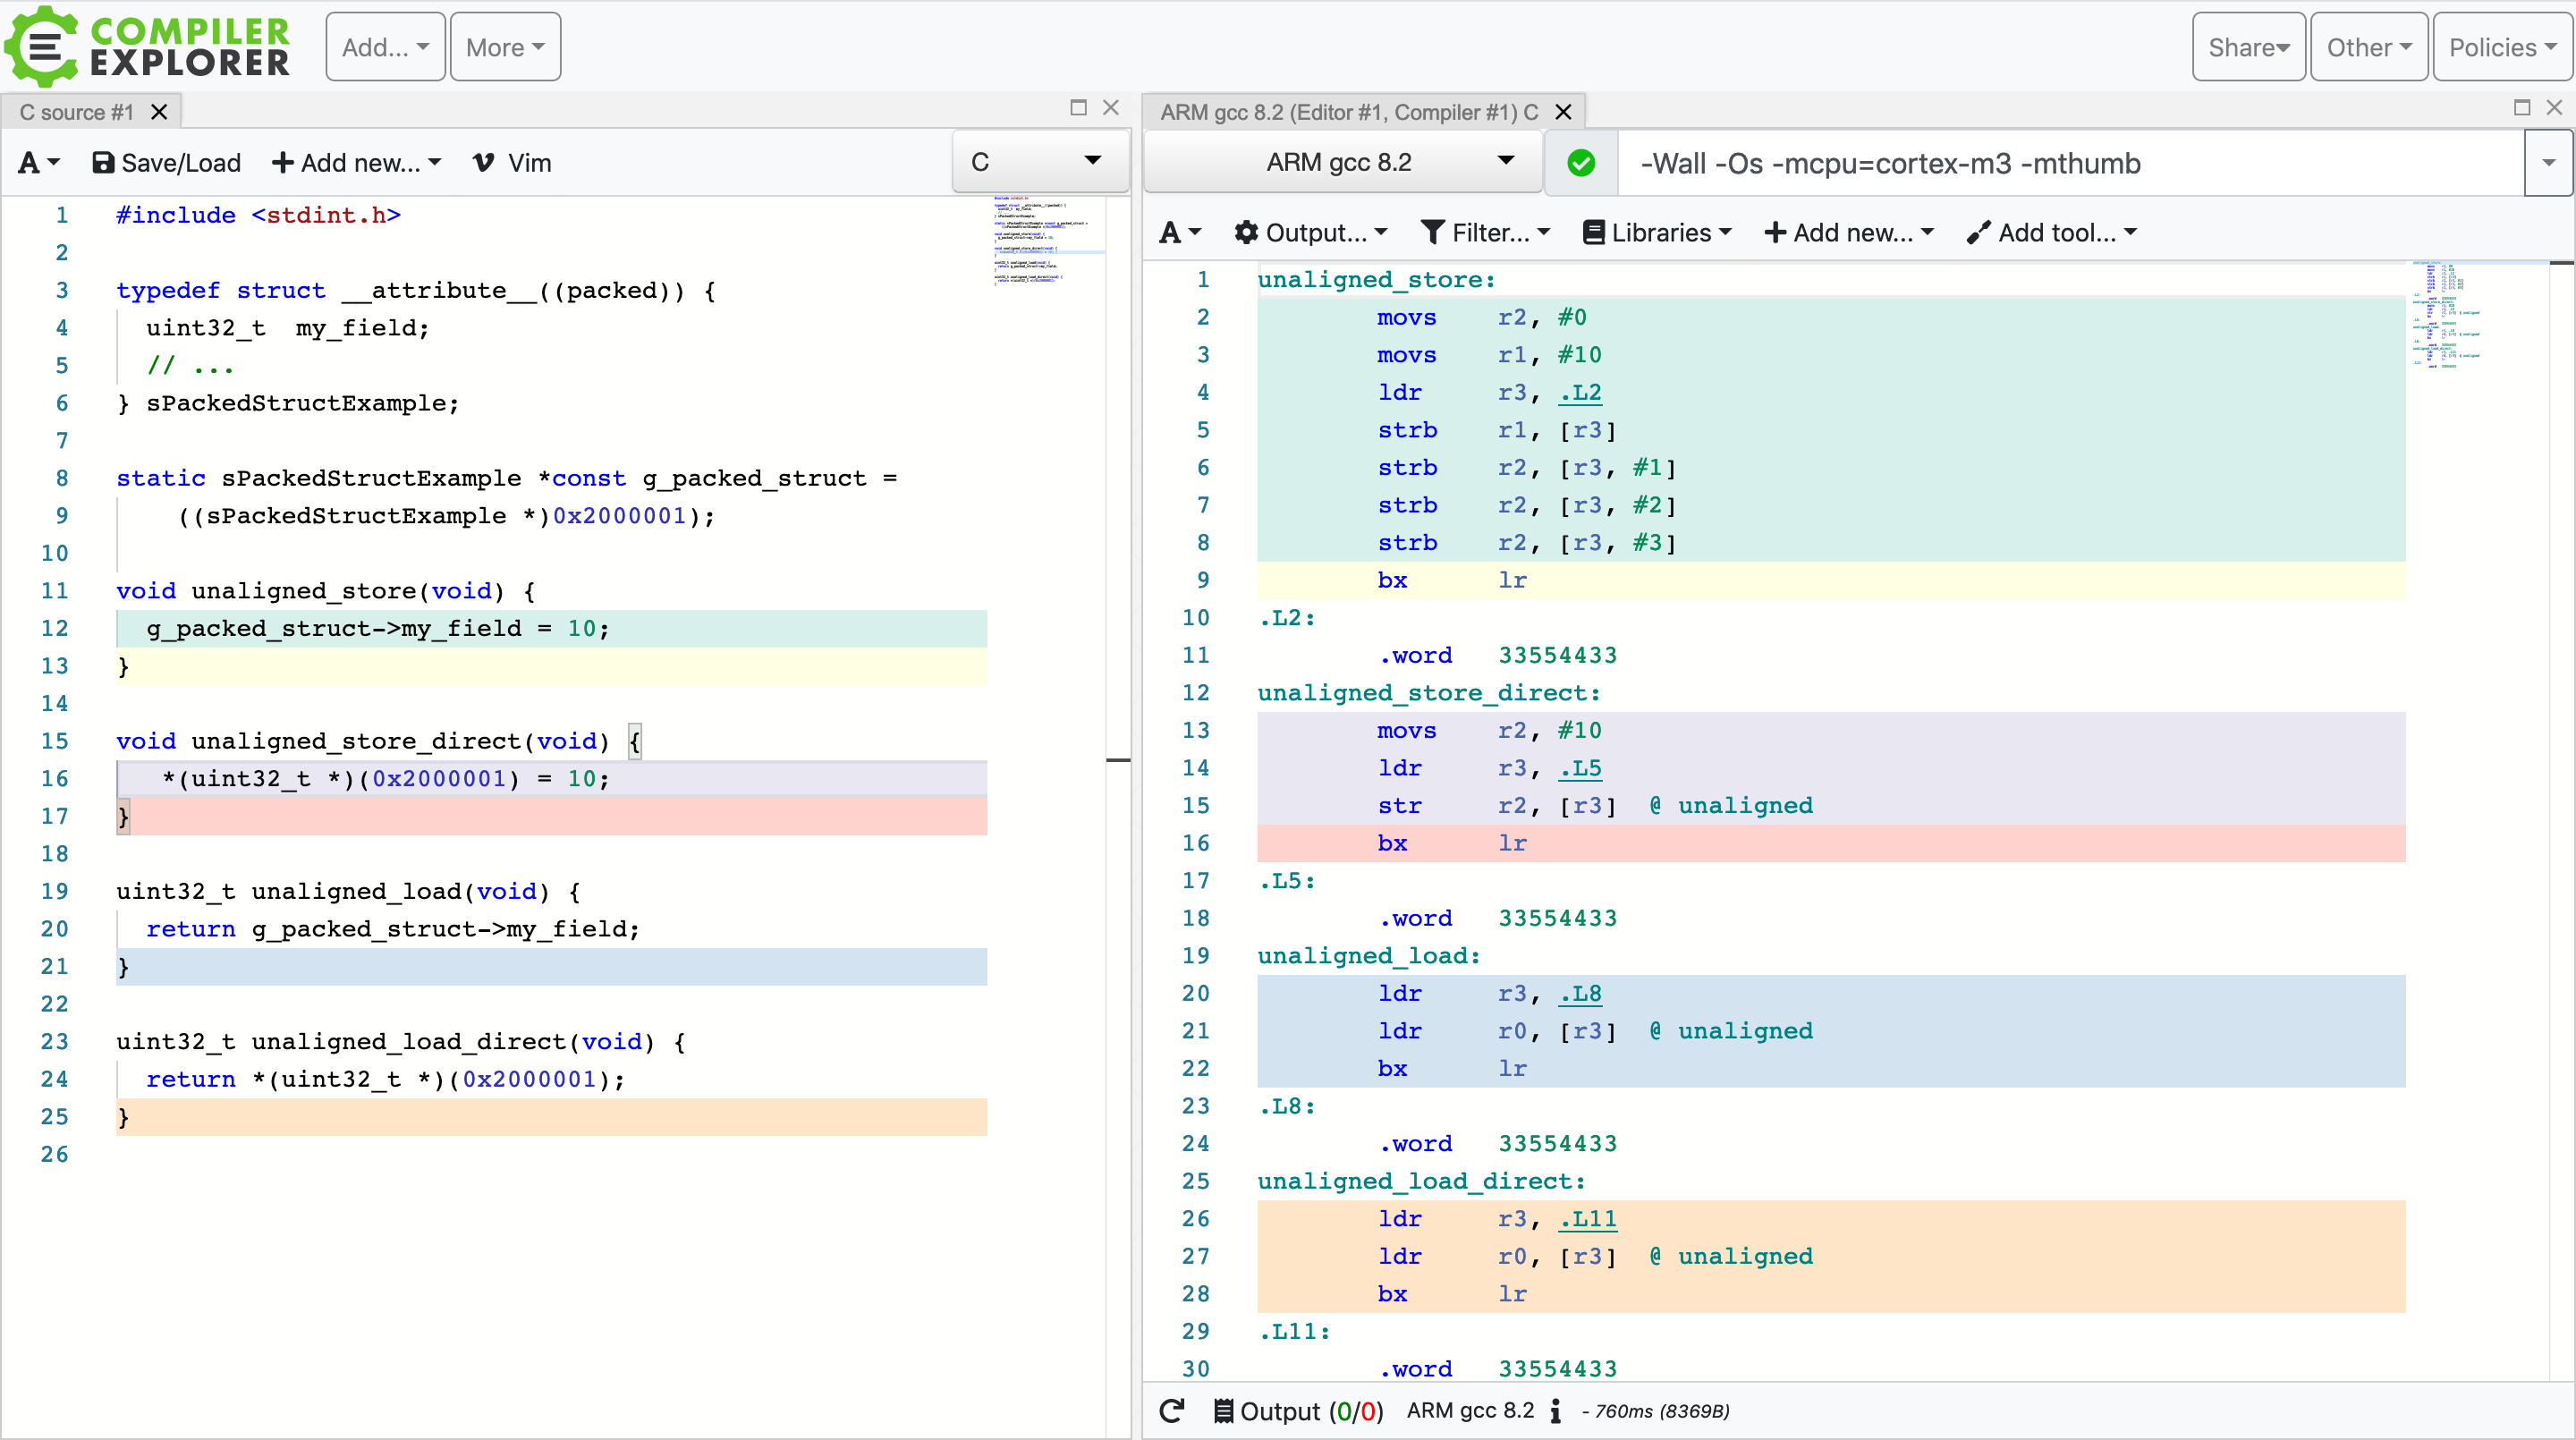
For ARMv7-M, 4 byte loads and store instructions (ldr and str, respectively) support unaligned
access. When compiling code for space optimizations (using -Os CFLAG), I would have expected unaligned
accesses to get optimized using this instruction. What I noticed is for some reason if the
unaligned store is through a packed structure, the optimization does not take place.
pyelftools
Pyelftools is a pure Python package capable of parsing ELF and DWARF information. If you are looking to perform your own analysis on ELF files, I highly recommend checking out the repo. There is an examples folder in the project that you can use as inspiration to get started.
Pure Python GNU Binutils size Command Equivalent
As a quick example, we can implement an equivalent of the size binutil command in about 30 lines
of Python!
# pyelftools_size.py
def _get_allocated_section_sizes(elffile):
    from elftools.elf.constants import SH_FLAGS

    text = data = bss = 0
    for section in elffile.iter_sections():
        sh_flags = section["sh_flags"]
        if sh_flags & SH_FLAGS.SHF_ALLOC == 0:
            continue  # Section is not in final binary

        section_size = section["sh_size"]

        if (sh_flags & SH_FLAGS.SHF_EXECINSTR != 0 or
            sh_flags & SH_FLAGS.SHF_WRITE == 0):
            text += section_size
        elif section["sh_type"] != "SHT_NOBITS":
            data += section_size
        else:
            bss += section_size

    return (text, data, bss)


def size_elf(fname):
    from elftools.elf.elffile import ELFFile

    with open(fname, "rb") as ef:
        text, data, bss = _get_allocated_section_sizes(ELFFile(ef))
    print(f"   text\t   data\t    bss\t    dec\t    hex\tfilename")
    tot = text + data + bss
    print(f"{text:7d}\t{data:7d}\t{bss:7d}\t{tot:7d}\t{tot:7x}\t{fname")


if __name__ == "__main__":
    import sys

    if len(sys.argv) < 2:
        print("Please specify a path to an ELF")
        exit(-1)
    size_elf(sys.argv[1])
We can compare the binutil size to the Python size to confirm it works!
$ python pyelftools_size.py nrf52_example/build/nrf52.elf
   text    data     bss     dec     hex	filename
   6340     244   11684   18268    475c	nrf52_example/build/nrf52.elf
$ arm-none-eabi-size nrf52_example/build/nrf52.elf
   text    data     bss     dec     hex	filename
   6340     244   11684   18268    475c	nrf52_example/build/nrf52.elf
abidiff
abidiff analyzes two ELFs and compares
them for compatibility. This can be an interesting tool to run on ELFs if you are linking libraries
compiled with multiple compilers or maintaining a third party binary SDK and want to catch
regressions. I assume you can ompile it yourself on OSX, but I typically just run it in an
ubuntu docker image and install via apt-get:
$ apt-get install libabigail
$ apt-get install abigail-tools
A Contrived Example
// test.c
void my_public_function_1(void) {
}

#if ADD_NEW_API
void my_public_function_2(void) {
}
#endif
$ gcc -c test.c -o test_v1.o
$ gcc -c test.c -DADD_NEW_API=1 -o test_v2.o
$ abidiff test_v1.o test_v2.o
Functions changes summary: 0 Removed, 0 Changed, 0 Added function
Variables changes summary: 0 Removed, 0 Changed, 0 Added variable
Function symbols changes summary: 0 Removed, 1 Added function symbol not referenced by debug info
Variable symbols changes summary: 0 Removed, 0 Added variable symbol not referenced by debug info

1 Added function symbol not referenced by debug info:

  my_public_function_2
LLVM
The LLVM project has clones of most of the binutil commands we discussed above as well as a bunch of tools of its own. There’s a healthy competition between the LLVM and GNU projects which means if a new feature makes it to one of them, there’s typically work already underway to bring the other to parity. If you haven’t looked at LLVM before, it’s definitely worth checking out!
Closing
I hope you learned something new about how to analyze binaries reading this article.
Are there are tools or commands you find useful that we did not mention? Let us know in the discussion area below!
See anything you'd like to change? Submit a pull request or open an issue on our GitHub
References
 Chris Coleman is a founder and CTO at Memfault. Prior to founding Memfault, Chris worked on the embedded software teams at Sun, Pebble, and Fitbit.