Debugging Firmware with GDB
If I had to choose one significant aspect that I was not aware of before starting my career as a firmware developer, it would be how much time is spent not actually developing, and instead debugging firmware!
Not convinced?
I’ll leave you with a few figures taken from the 2017 Embedded/EETimes Embedded Markets Study survey which showcase the significance of debugging in the professional life of a firmware developer.


Let’s face it..
Debugging is generally difficult, and it gets even more difficult for firmware applications and has more limitations compared with a mobile or web application.
This is due to a few factors, some of which are:
- Limited availability of resources for debugging. For example, some bugs are very difficult to diagnose using software breakpoints. In those scenarios, you would rely on hardware breakpoints and usually there is a limited number of hardware breakpoints for a specific architecture. This makes debugging complex bugs a challenging task.
- Time-dependency in real-time/time-critical applications. For example, setting breakpoints can interfere with the timing of operations. If a bug is timing-related, then the debugging process may even cause the bug to disappear!
- Challenges in setting up the debugging environment (cross-platform development environment). There is a variety of visual IDEs and integrated debuggers available, but for some scenarios you may need an automated debugging setup and this can prove to be a challenging task.
- High cost of some debugging hardware tools.
The GNU Debugger (GDB)
GDB was developed by Richard Stallman in 1986 as part of the GNU system. It is one of the most popular debuggers out there, and for many good reasons!
Some of the most important are:
- GDB supports a vast number of architectures including: ARM, x86, MIPS, and many more. Because of this, a firmware developer’s knowledge and expertise with GDB is potentially transferrable across many projects.
- GDB is command-line based which gives it high flexibility and usability in debugging tasks that require some level of automation. This became especially true with the release of the Python API for GDB in GDB’s release version 7.0 (in 2011).
- GDB supports remote debugging. This is crucial for embedded systems where the development environment resides on an architecture different from the target system (e.g. developing on a Windows machine for an ARM-based target).
Because of these reasons, we believe it is extremely helpful for a firmware developer to at least get some exposure to using GDB.
In this post, we’ll walk through setting up GDB for the following environment:
- A Nordic nRF52840 development kit
- A macOS machine as the development environment
- Running an example from the nRF5 SDK (version 15.3.0), specifically the UART example application.
- We’ll be running a non-BLE peripheral example (UART) that does not use Nordic’s SoftDevice. Debugging nRF applications with SoftDevice can get complicated, so we’ll leave that to a later post.
We’ll then go through demos of utilizing the most useful features of GDB to debug our example application.
Hardware required:
Here’s a list of the hardware components required for following the steps in this tutorial:
- An nRF52840 development kit (PCA10056).
- A macOS computer (though most of these steps are transferrable to Linux and Windows).
- A micro-USB cable for connecting the development kit to your computer.
Software required:
Here’s a list of the software packages required for following the steps in this tutorial:
- Nordic Semiconductor’s nRF5 SDK (we’ll be using SDK version 15.3.0).
- Nordic Semiconductor’s nRF5 Command Line Tools for macOS (we’ll be using version 9.8.1).
- SEGGER J-Link Software for macOS (we’ll be using version V6.44g).
- GNU Arm Embedded Toolchain (we’ll be using version 7-2017-q4-major which is recommended by Nordic per this article).
- CoolTerm serial terminal program (or any other serial terminal program).
- Xcode Command Line Tools – For installation steps, I found this tutorial quite helpful and easy to follow.
Setup
In order to use GDB with any embedded system, we need to set up:
- A GDB Server instance which interfaces directly with the target
- A GDB instance (Client) that connects to the GDB Server
Software Installation Steps
Let’s go through the different steps for downloading the necessary software packages.
For each of these downloads, you can place them anywhere on your machine. I recommend having them all in a single folder, to make it easier to locate later on.
1. nRF5 SDK
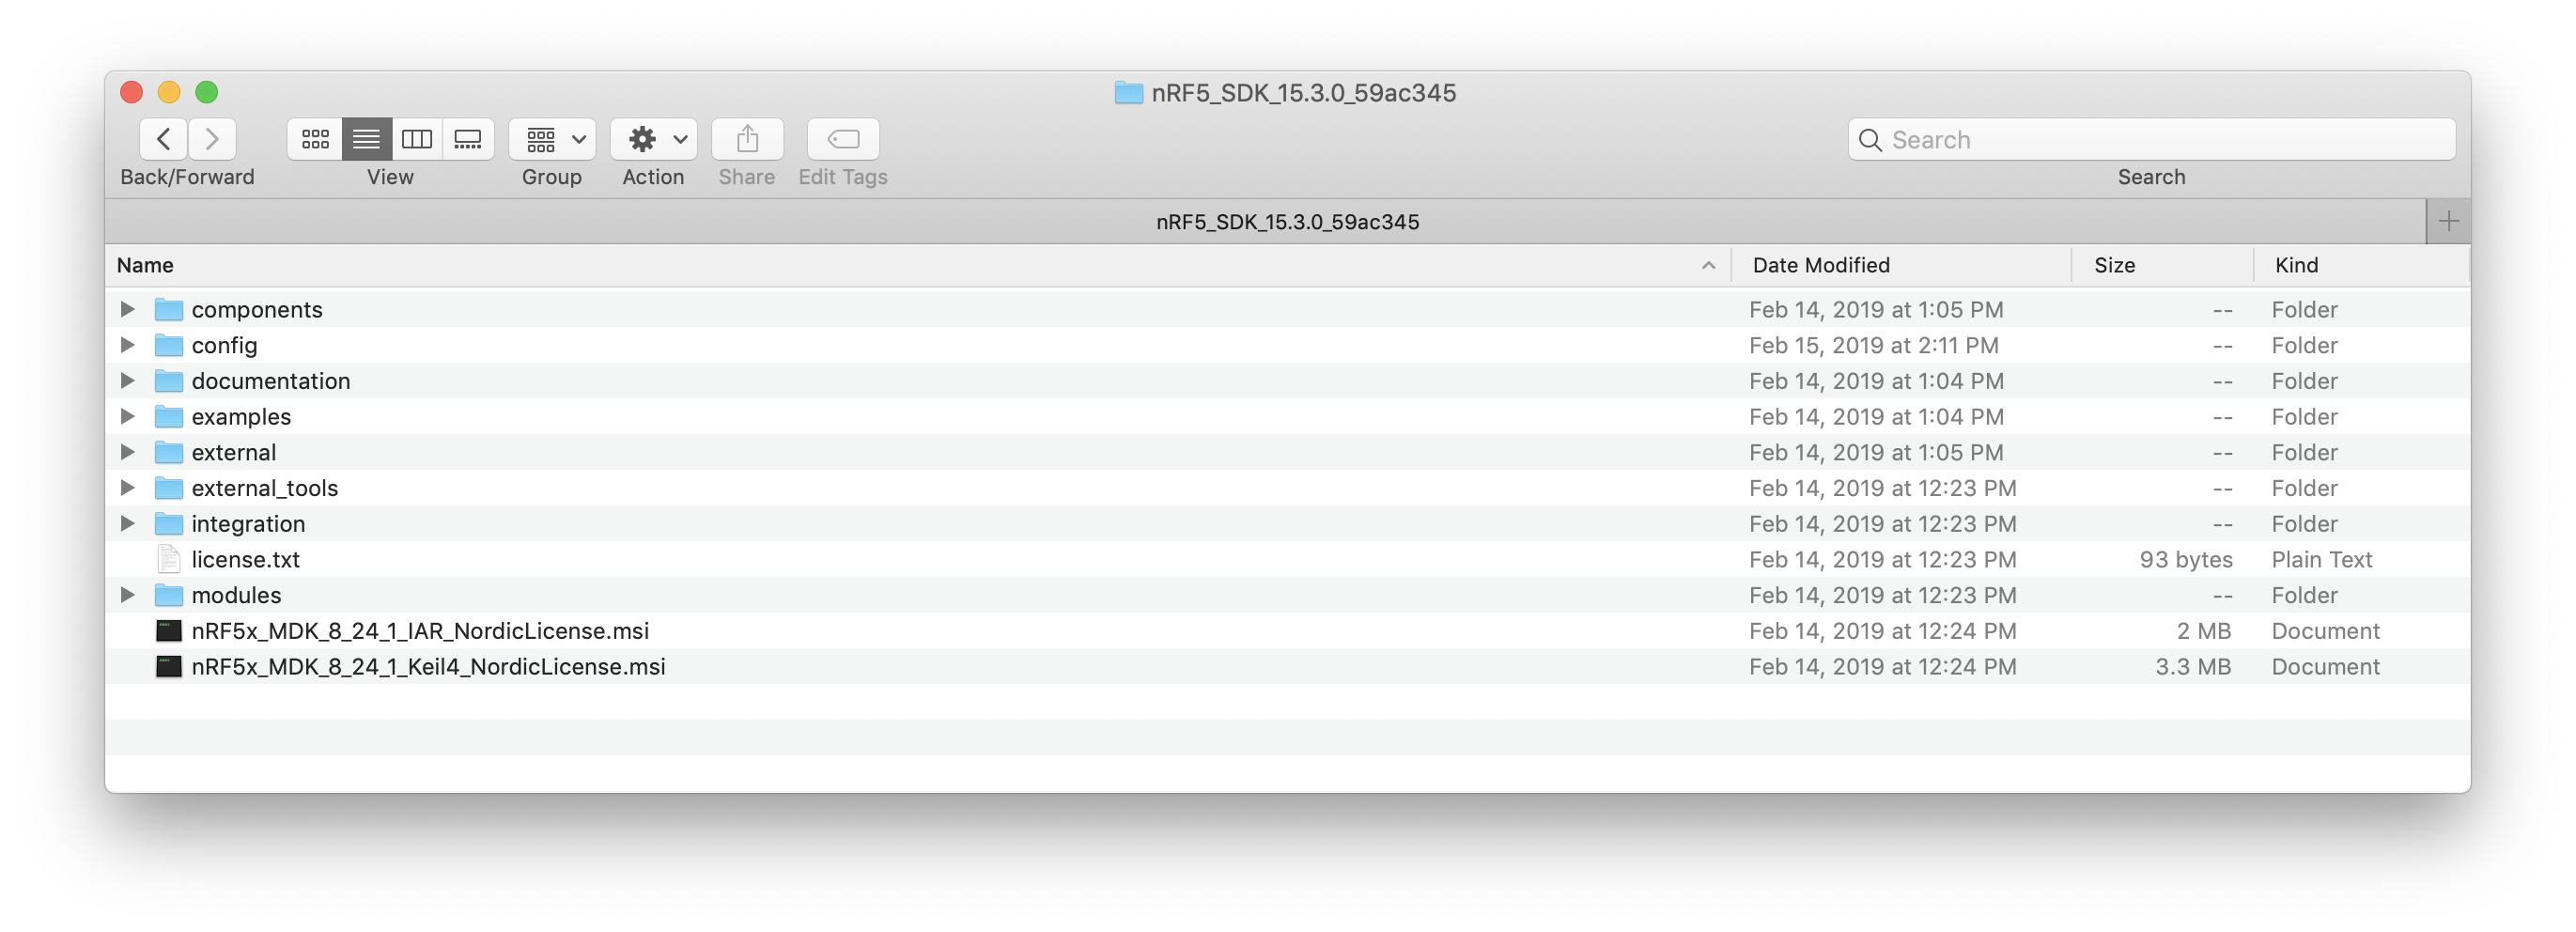
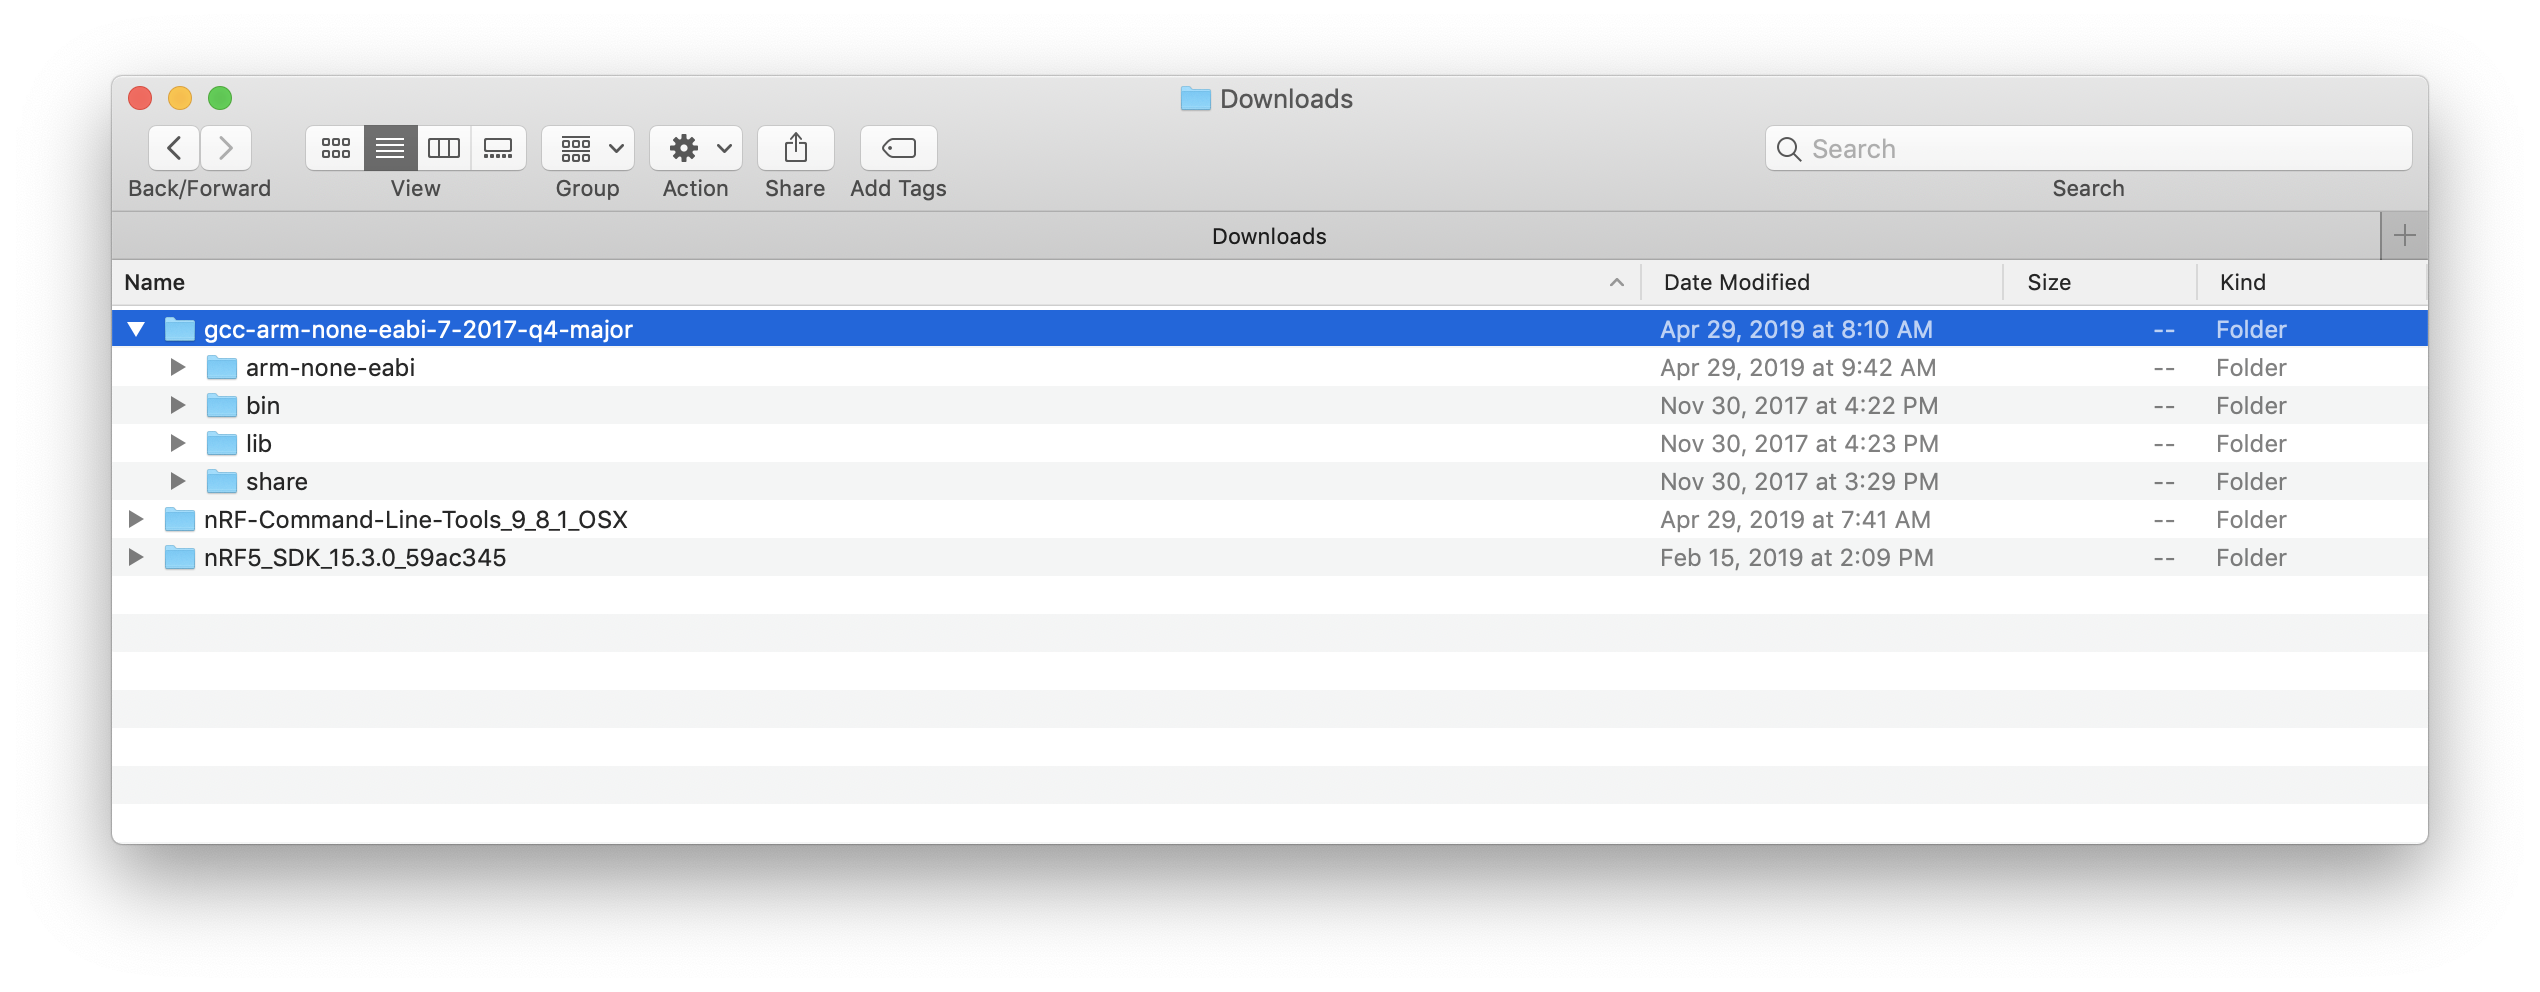
Installation of the nRF5 SDK is straightforward. All you need to do is download the SDK tarball from Nordic’s website and then extract it.
Once you extract it, you should see the following directory structure:
2. nRF5 Command Line Tools
Next, we need to install the nRF5 Command Line Tools. These include nrfjprog, which is a tool for programming your nRF52 development kit via the Segger J-Link debugger and needed in our case for working from the command line.
Link to download the nRF5 Command Line Tools
First, make sure you select the appropriate operating system (macOS in our case).
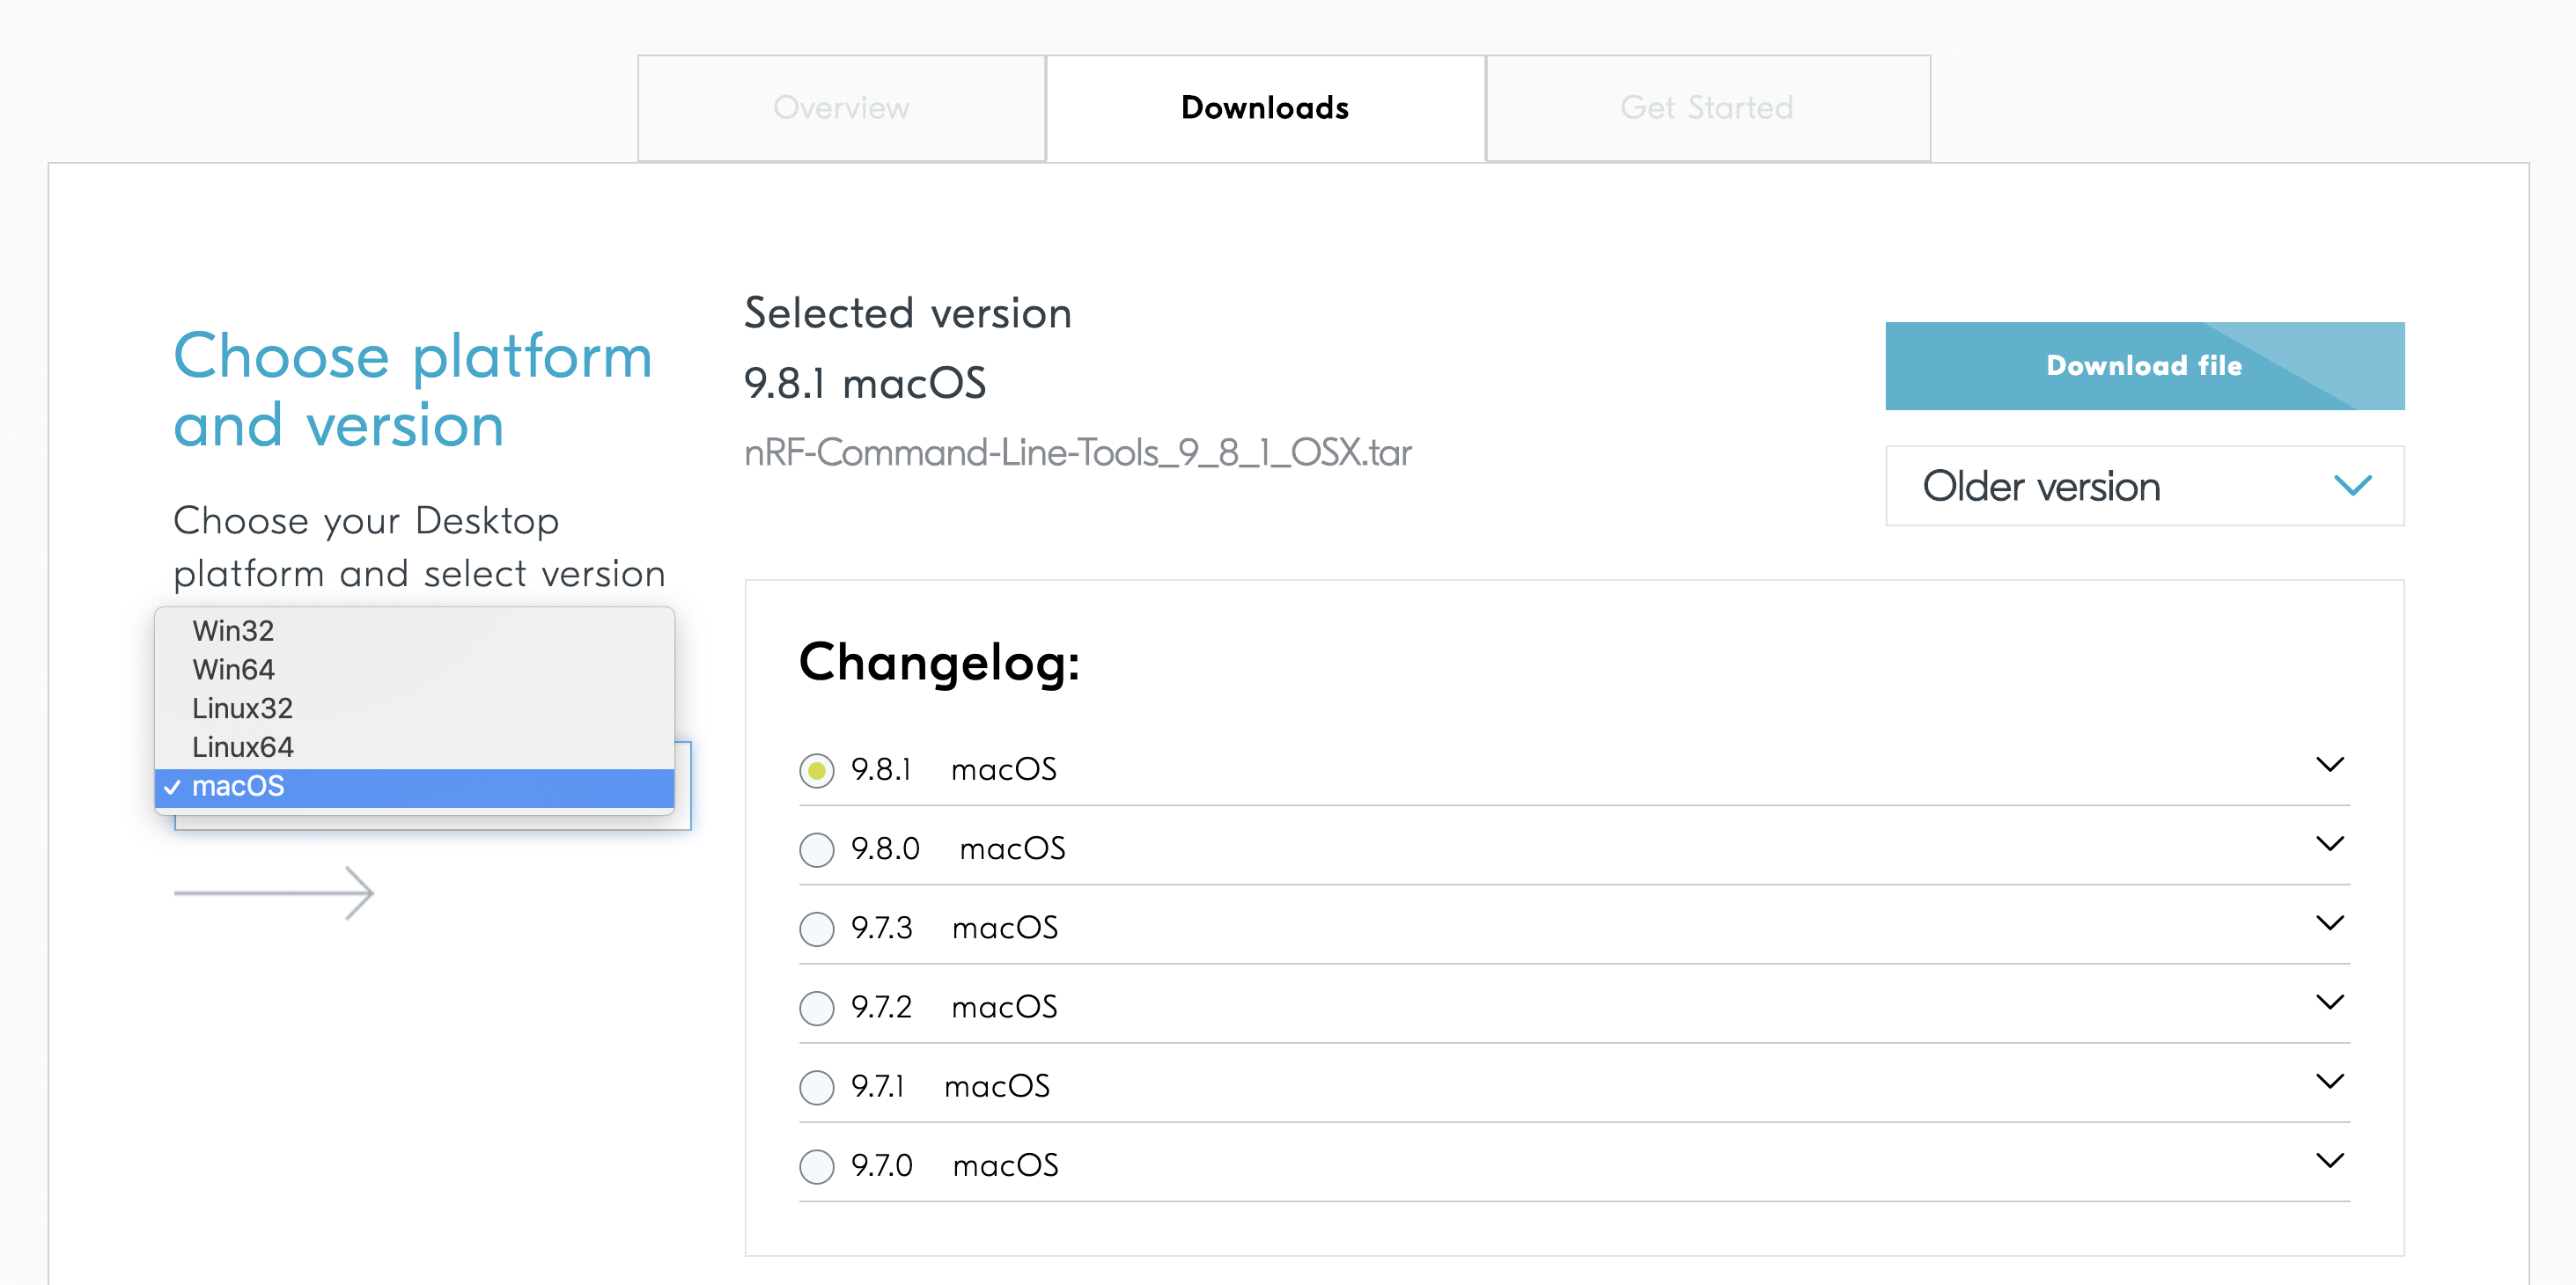
Select the latest version, and then click “Download File”.
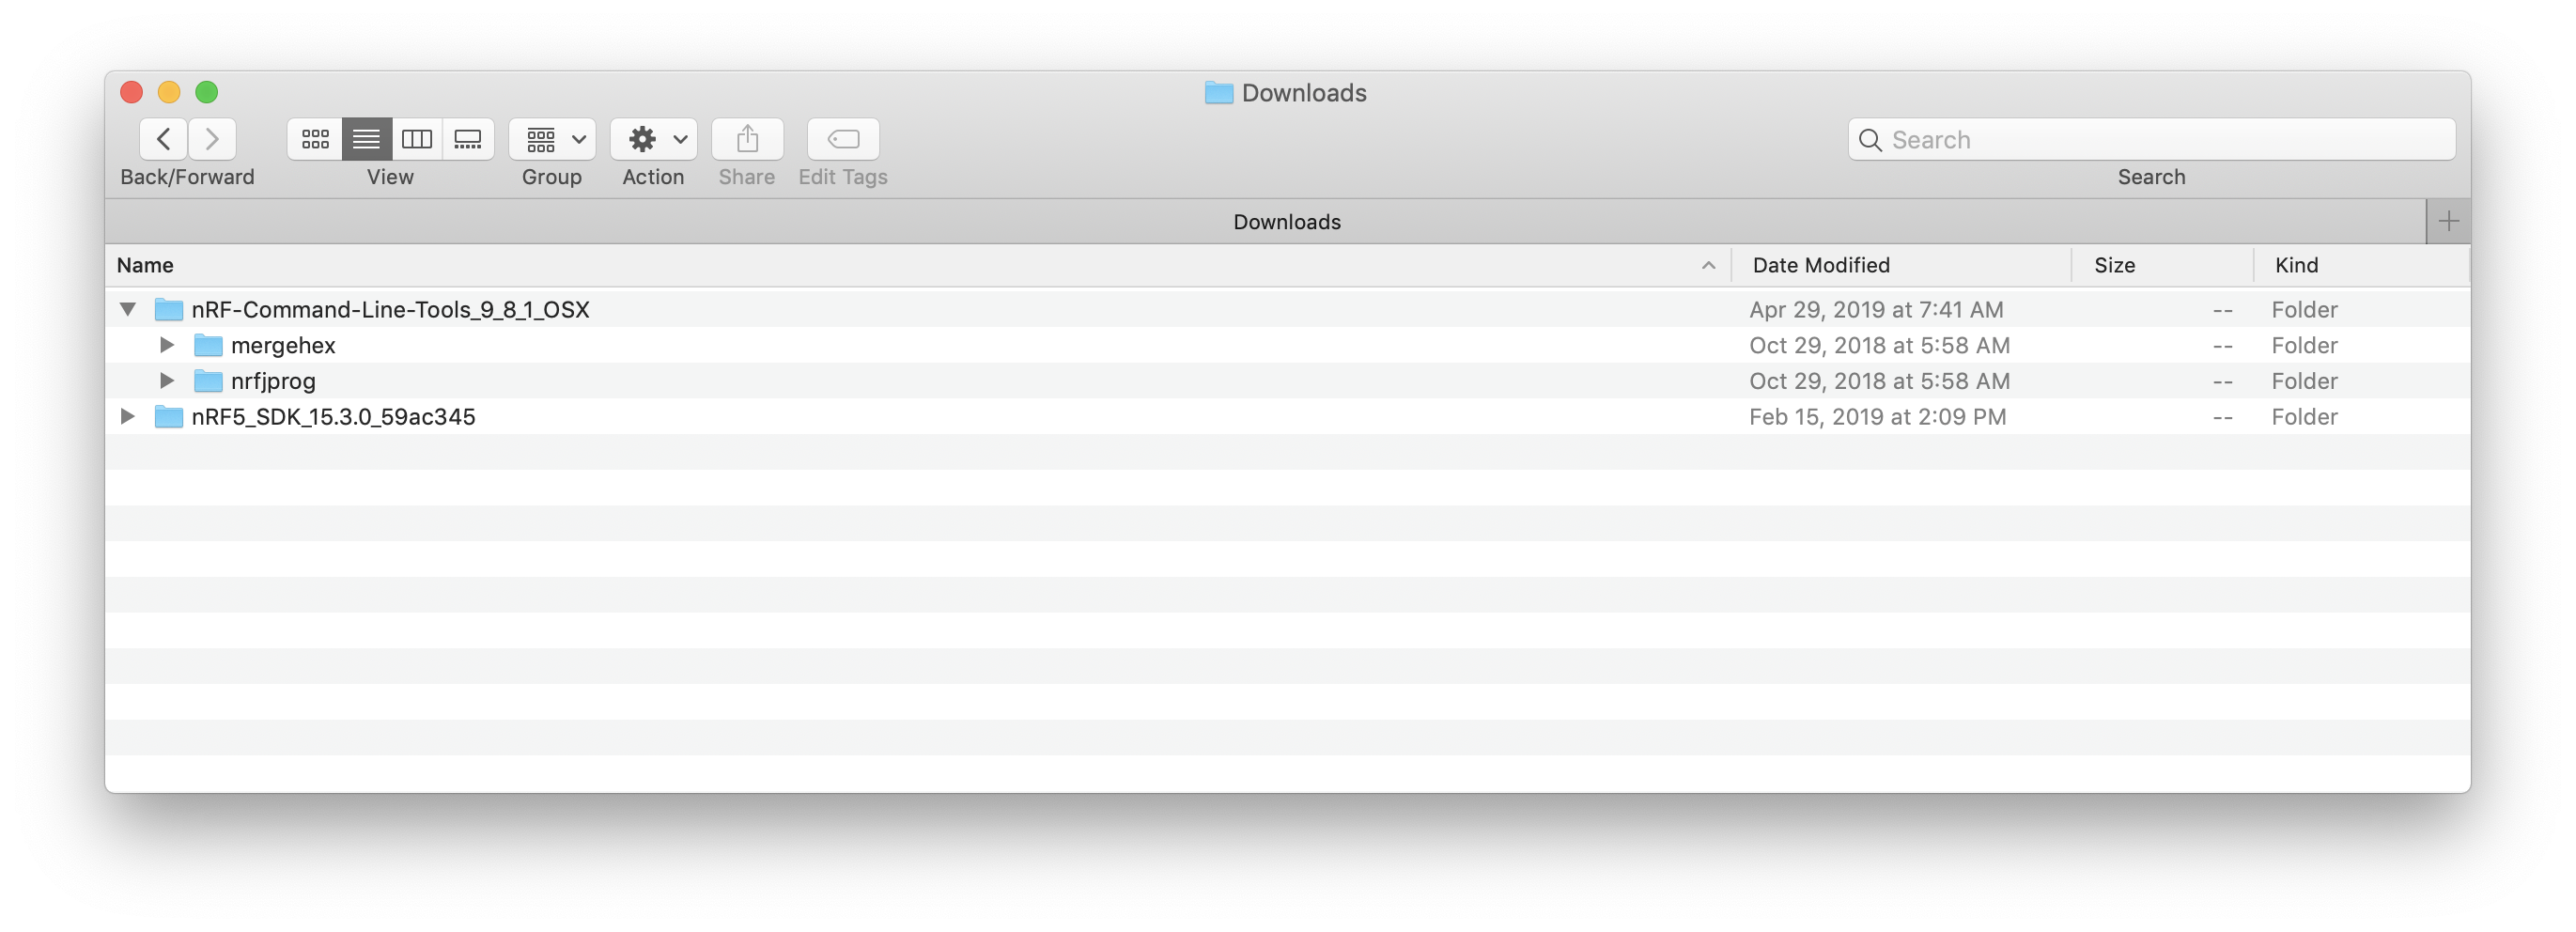
This is what the contents of the folder should look like:
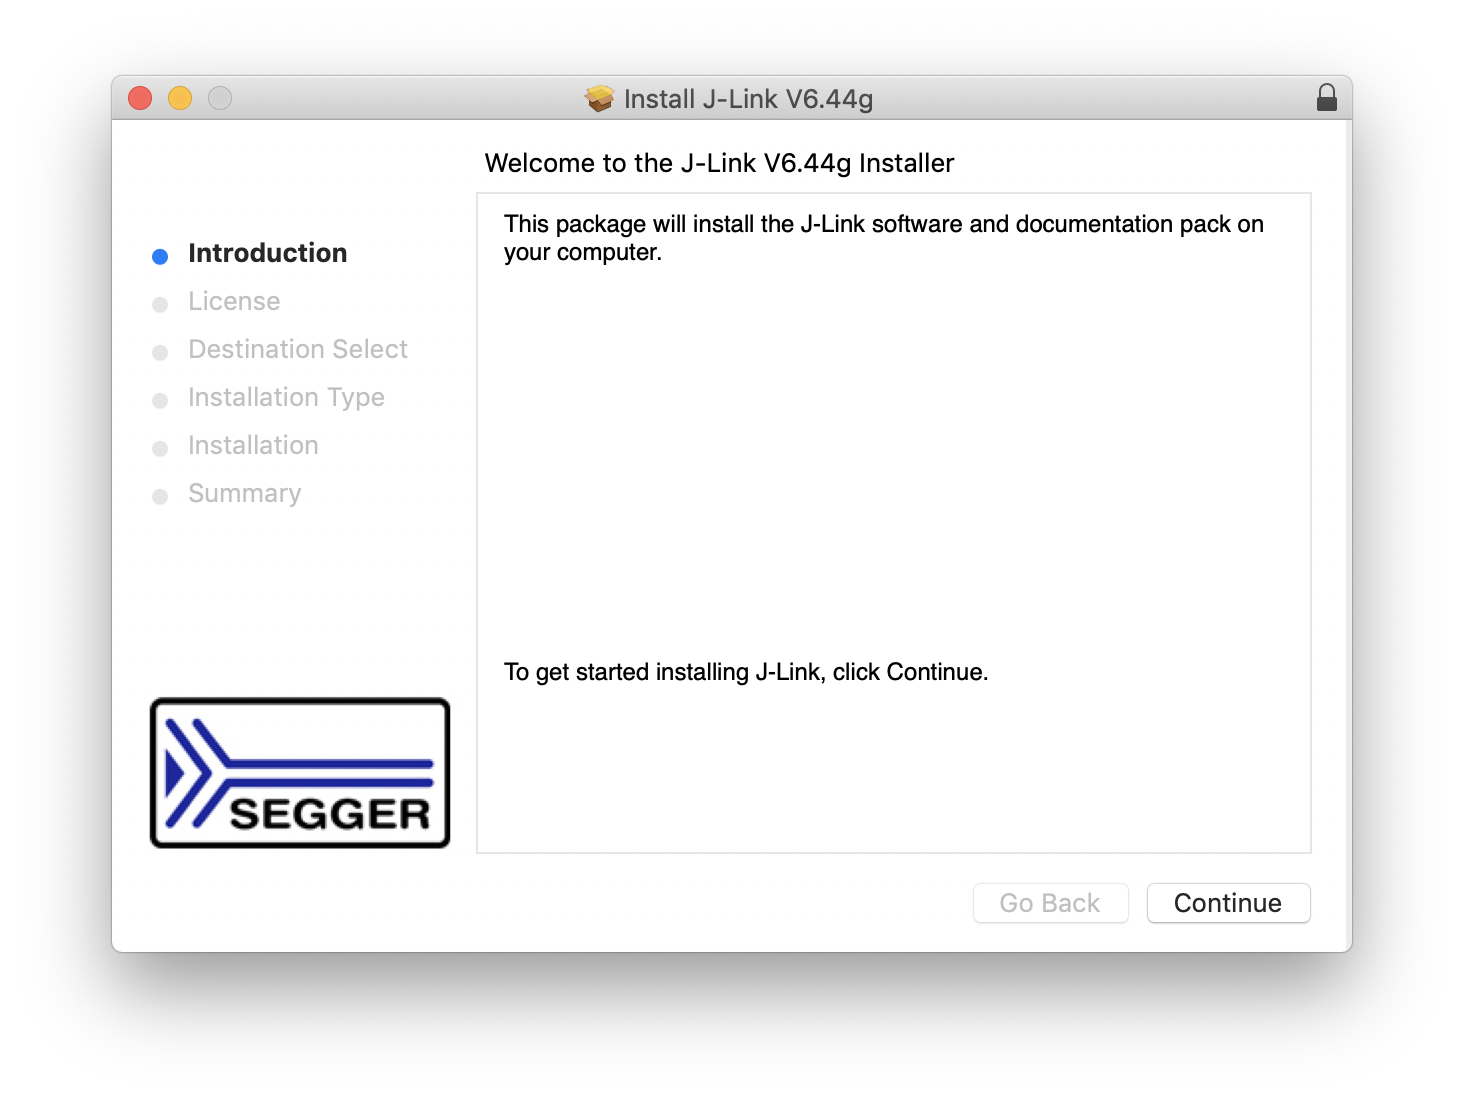
3. SEGGER J-Link
The SEGGER J-Link software is needed for the GDB Server interface to the nRF52 chipset on the development kit.
So let’s go ahead and download the software.
Link to download SEGGER J-Link Software
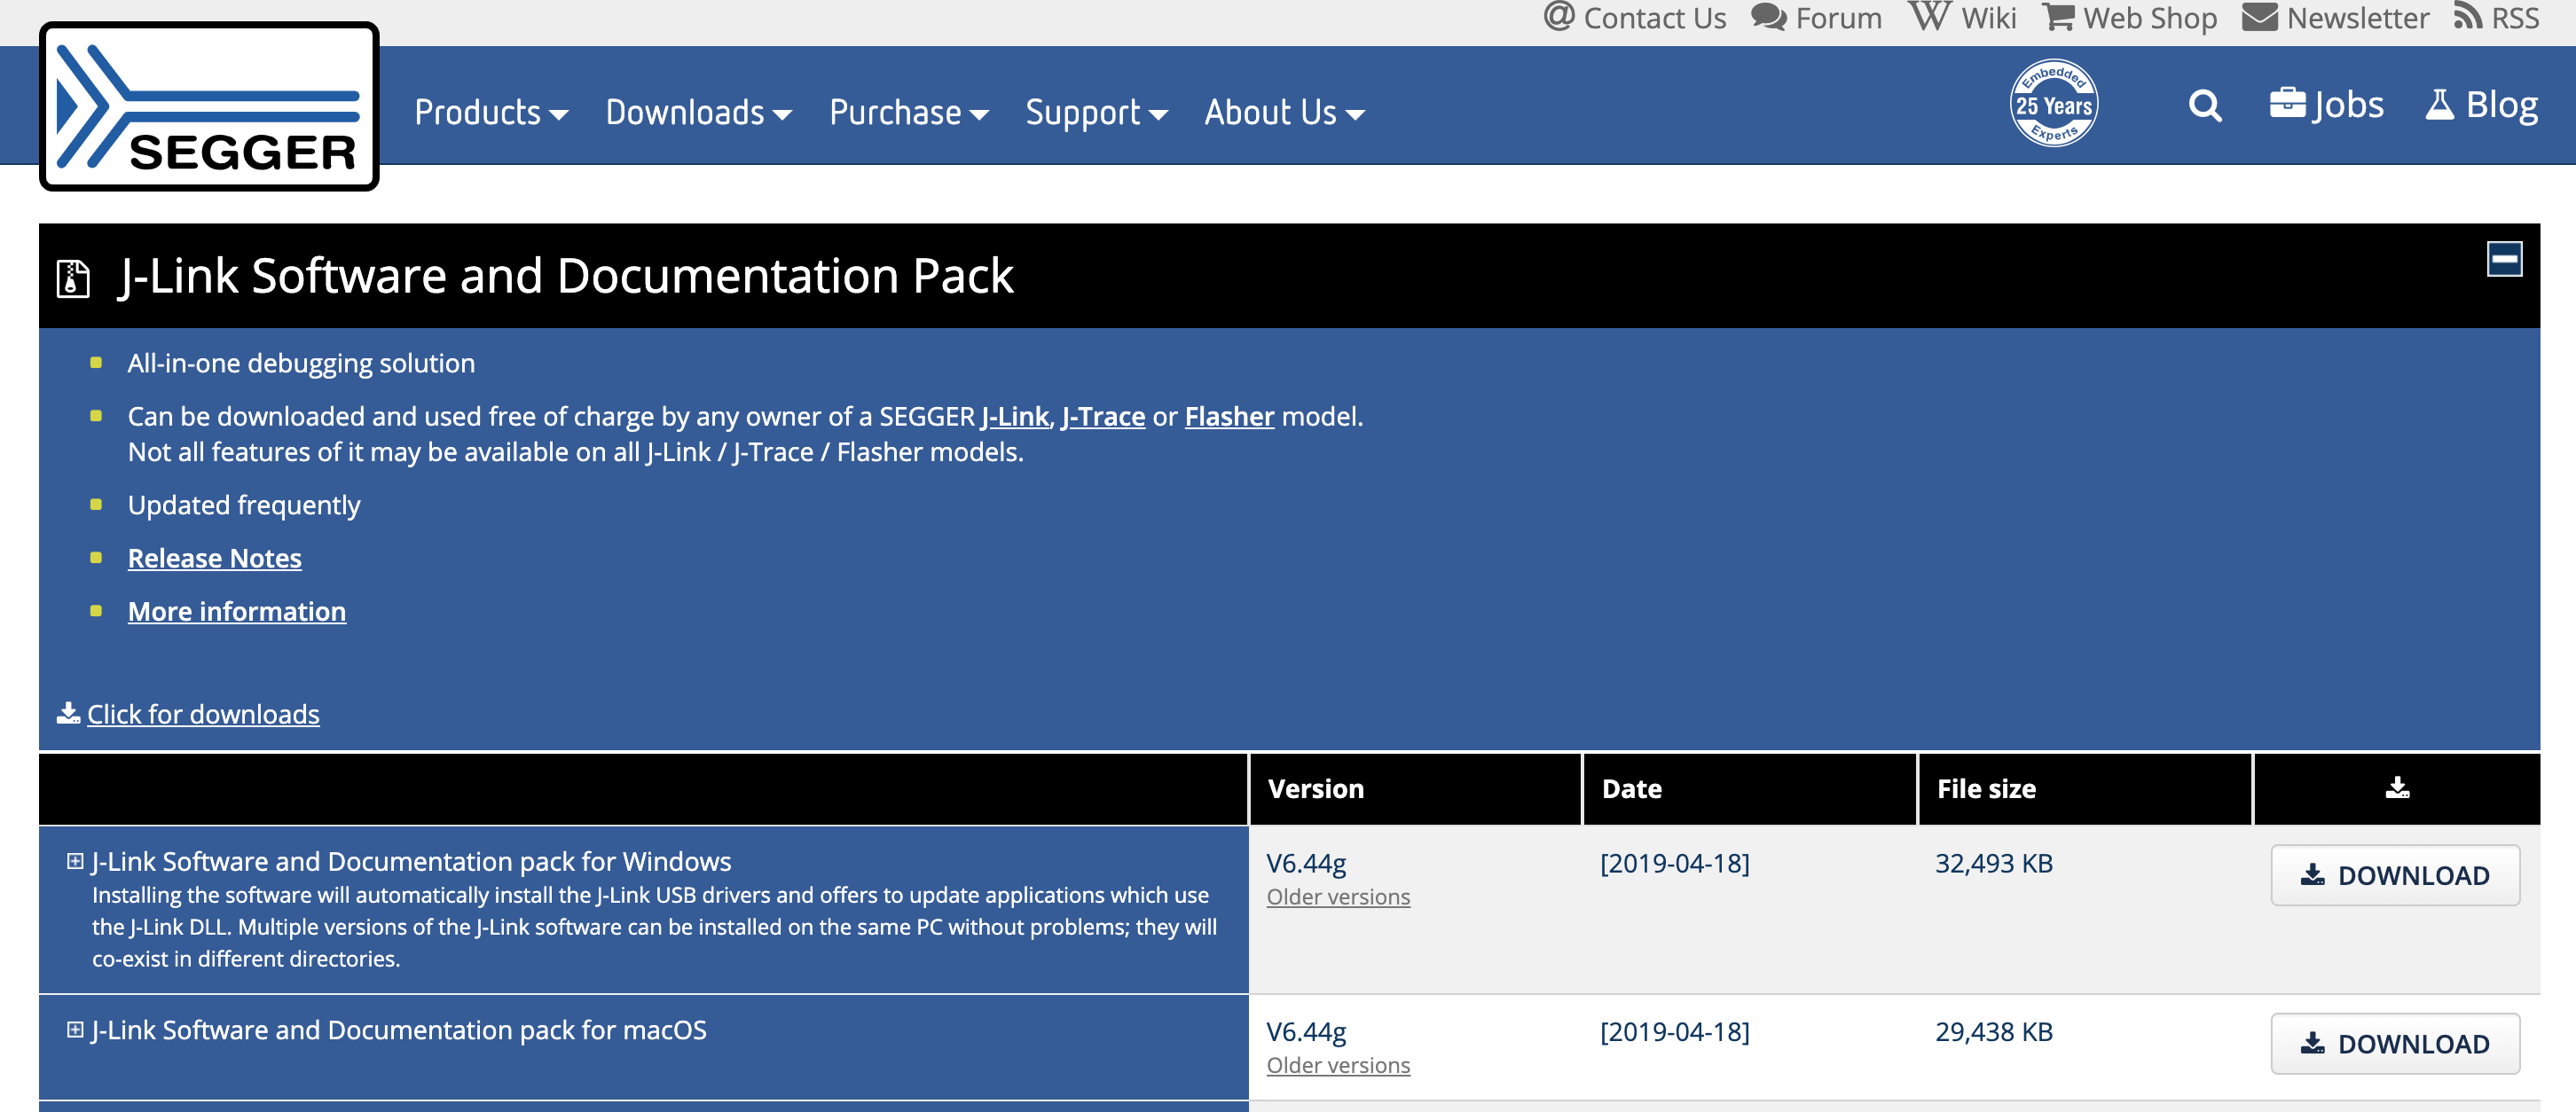
This download (for macOS) is a .pkg installer file. Once you download it, simply double-click it and go through the installation process.
4. GNU Arm Embedded Toolchain
The next software package that we need to install is the GNU Arm Embedded Toolchain which includes the compiler (gcc) and debugger (gdb) for the Arm architecture (which the nRF52840 chipset is based on).
Direct link to download the GNU Arm Embedded Toolchain (version 7-2017-q4-major)
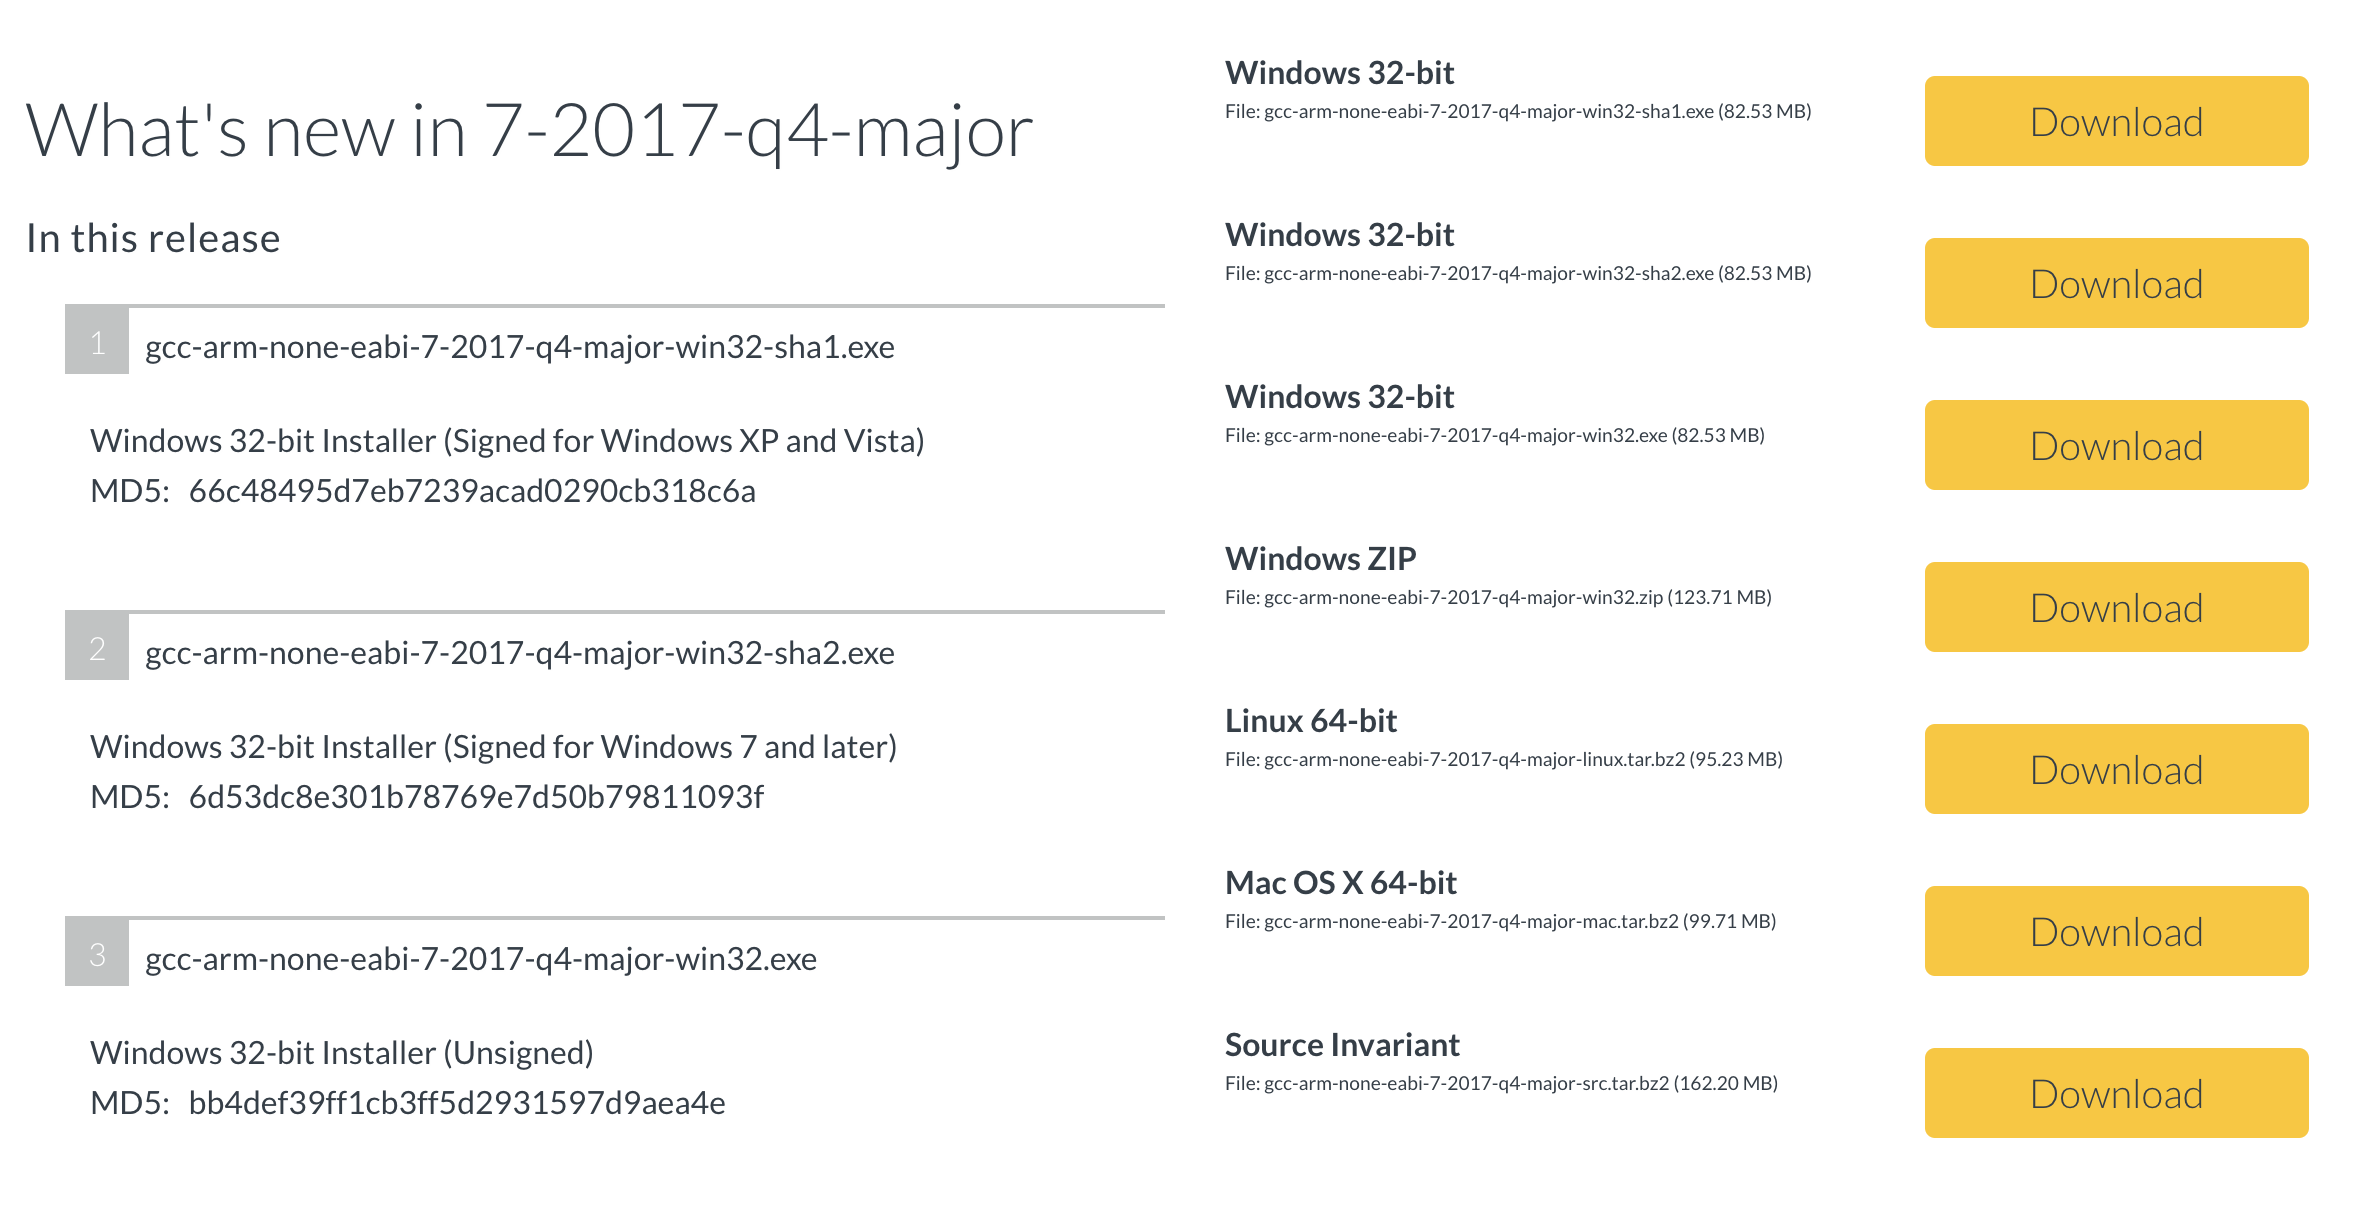
After you download the package, simply extract it to your folder of choice.
5. Serial Terminal Program
My choice for a terminal program that I use across projects is a program called CoolTerm. What I like about this program is its simplicity and that it supports all the major platforms (Windows, macOS, and Linux).
For now, all you need to do is download it, open the package and copy the application file to your Mac Applications folder so you could launch it in the later steps.
6. Adding Necessary Folders to $PATH
In order to access the necessary commands that we’ll be calling from anywhere in your system, you need to add their paths to the system $PATH environment variable.
To do that, open up a Terminal session and type the following:
$ vi ~/.bash_profile
Once you’ve done that, go ahead and add the following lines to the bottom of the file:
export PATH = "<Your Folder>/nRF-Command-Line-Tools_9_8_1_OSX/nrfjprog":$PATH
export PATH = "<Your Folder>/gcc-arm-none-eabi-7-2017-q4-major/bin":$PATH
Make sure to replace <Your Folder> with the appropriate folder name where you placed those packages on your system.
We don’t need to add any paths for the SEGGER J-Link software because it ran as an installer and would have already added the necessary binaries to our system.
After you’re done editing and saving the paths file, close the Terminal and then start a new session to make sure the updated paths file gets loaded. Alternatively, you could just execute the following command to reload .bash_profile:
$ source ~/.bash_profile
To verify, you can type the following command:
$ echo $PATH
/usr/local/bin:/usr/bin:/bin:/usr/sbin:/sbin:/Users/mafaneh/Memfault/nRF-Command-Line-Tools_9_8_1_OSX/nrfjprog:/Users/mafaneh/Memfault/gcc-arm-none-eabi-7-2017-q4-major/bin
That’s it for the setup part, now on to the fun part!
Running the Example
Before we can actually debug the application and use GDB, we need to build the example and flash it to the development kit.
Following are the steps we need to take:
1. nRF52 Example Compilation
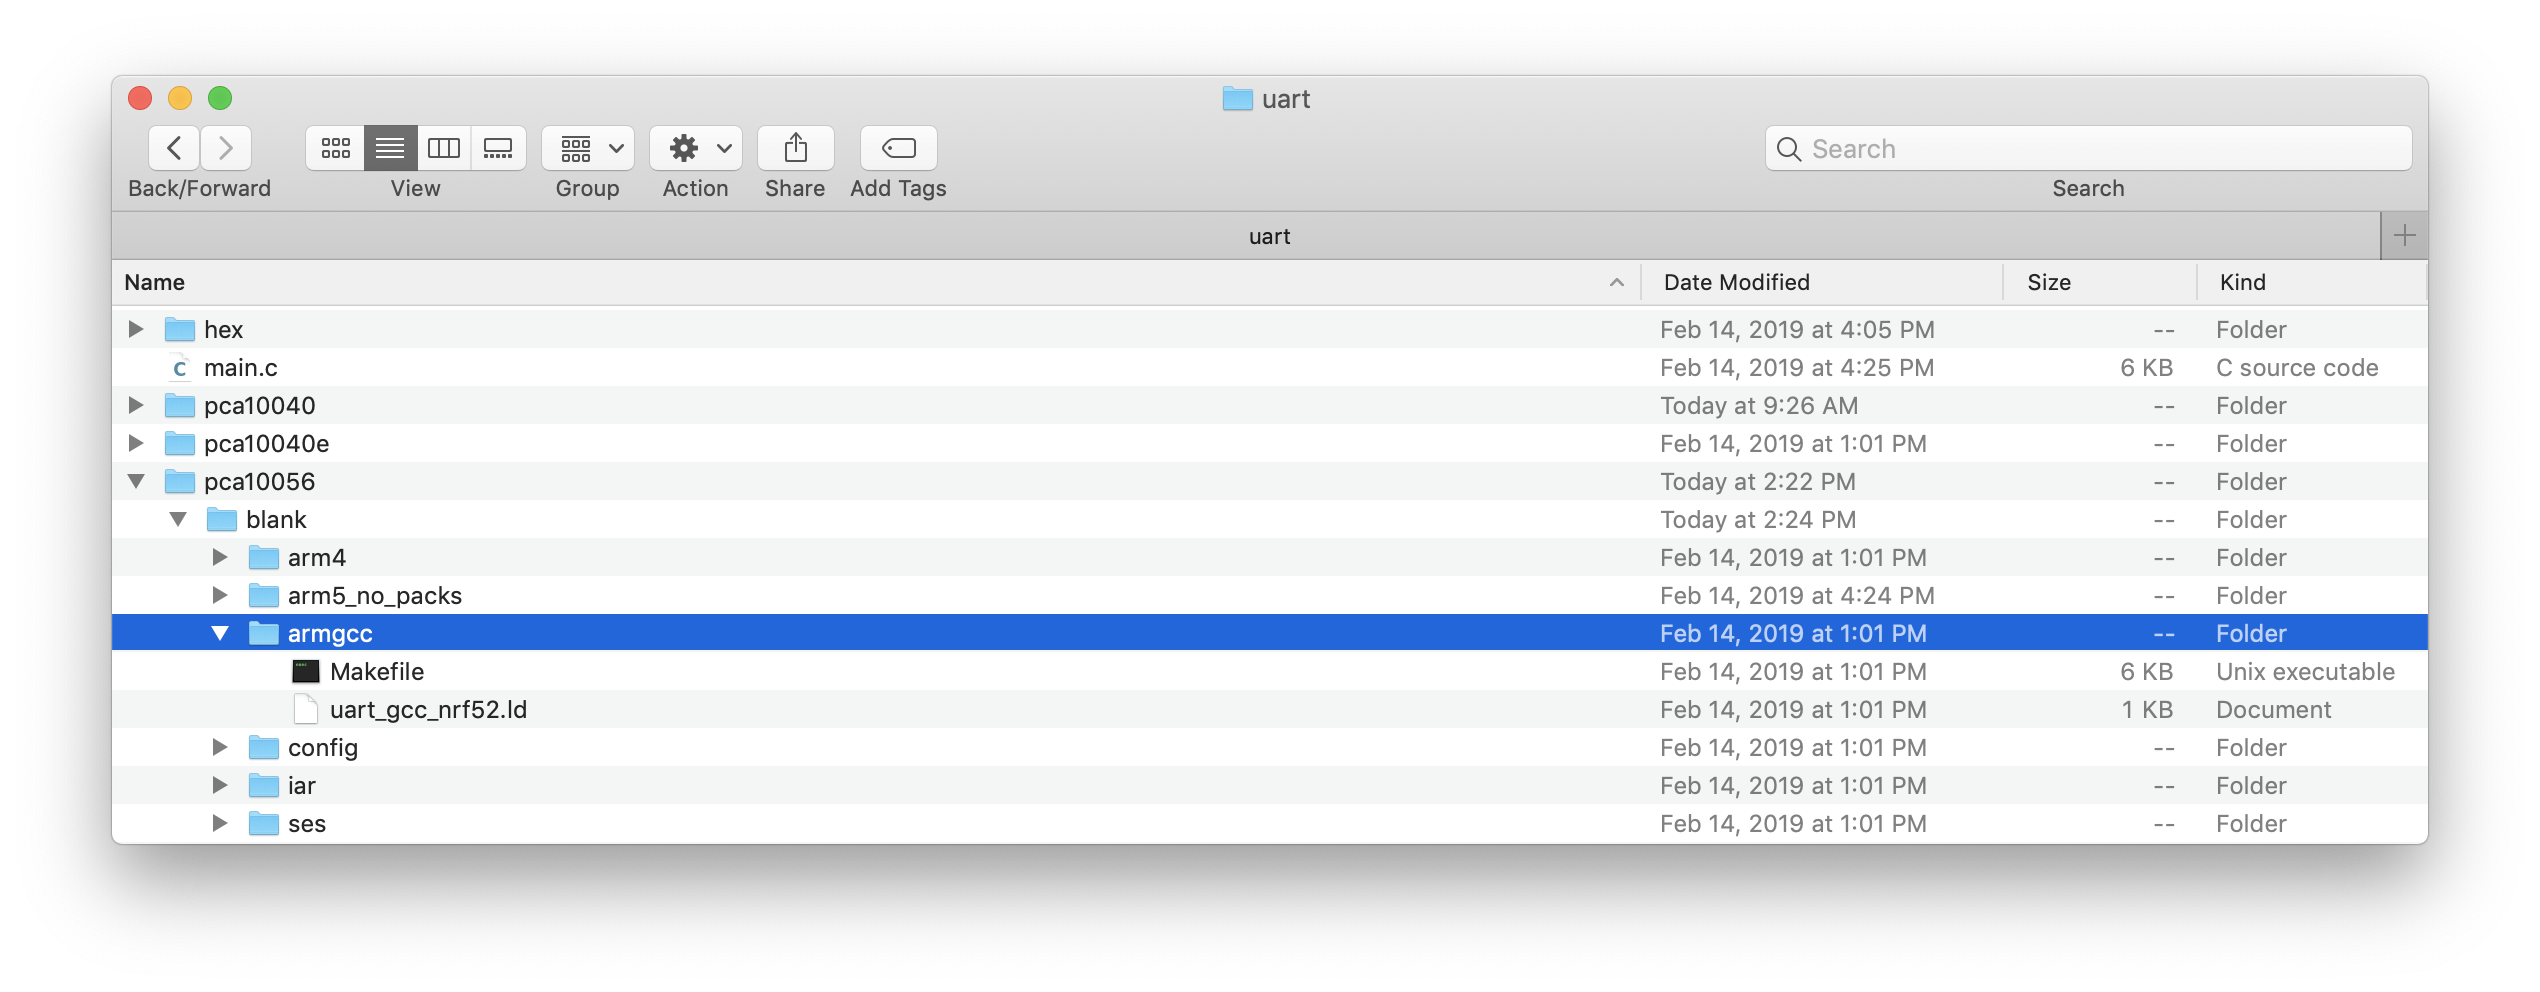
In our tutorial, we’ll be using the UART example included as part of the nRF5 SDK (version 15.3.0). This example is located at:
<nRF5_SDK_Folder>/examples/peripheral/uart/
You’ll notice there are many subfolders in that folder. We are mostly interested in the following highlighted folder in the screenshot:
Before we build the example, let’s make sure we have the right compiler flags for debugging. This is necessary to include debugging symbols that help GDB present useful debugging information to the user.
To check the compiler flags, edit the Makefile located at <nRF5_SDK_Folder>/examples/peripheral/uart/pca10056/blank/armgcc.
In the Makefile, look for the “Optimization flags” section:
# Optimization flags
OPT = -O3 -g3
# Uncomment the line below to enable link time optimization
#OPT += -flto

# C flags common to all targets
CFLAGS += $(OPT)
Let’s modify this to reflect the following changes:
# Optimization flags
OPT = -Og -g3
# Uncomment the line below to enable link time optimization
#OPT += -flto

# C flags common to all targets
CFLAGS += $(OPT)
We changed the compiler’s optimization level to “-Og”, which optimizes the debugging experience. According to GDB’s documentation for Optimization:
Turning on optimization flags makes the compiler attempt to improve the performance and/or code size at the expense of compilation time and possibly the ability to debug the program.
and
-Og should be the optimization level of choice for the standard edit-compile-debug cycle, offering a reasonable level of optimization while maintaining fast compilation and a good debugging experience. It is a better choice than -O0 for producing debuggable code because some compiler passes that collect debug information are disabled at -O0.
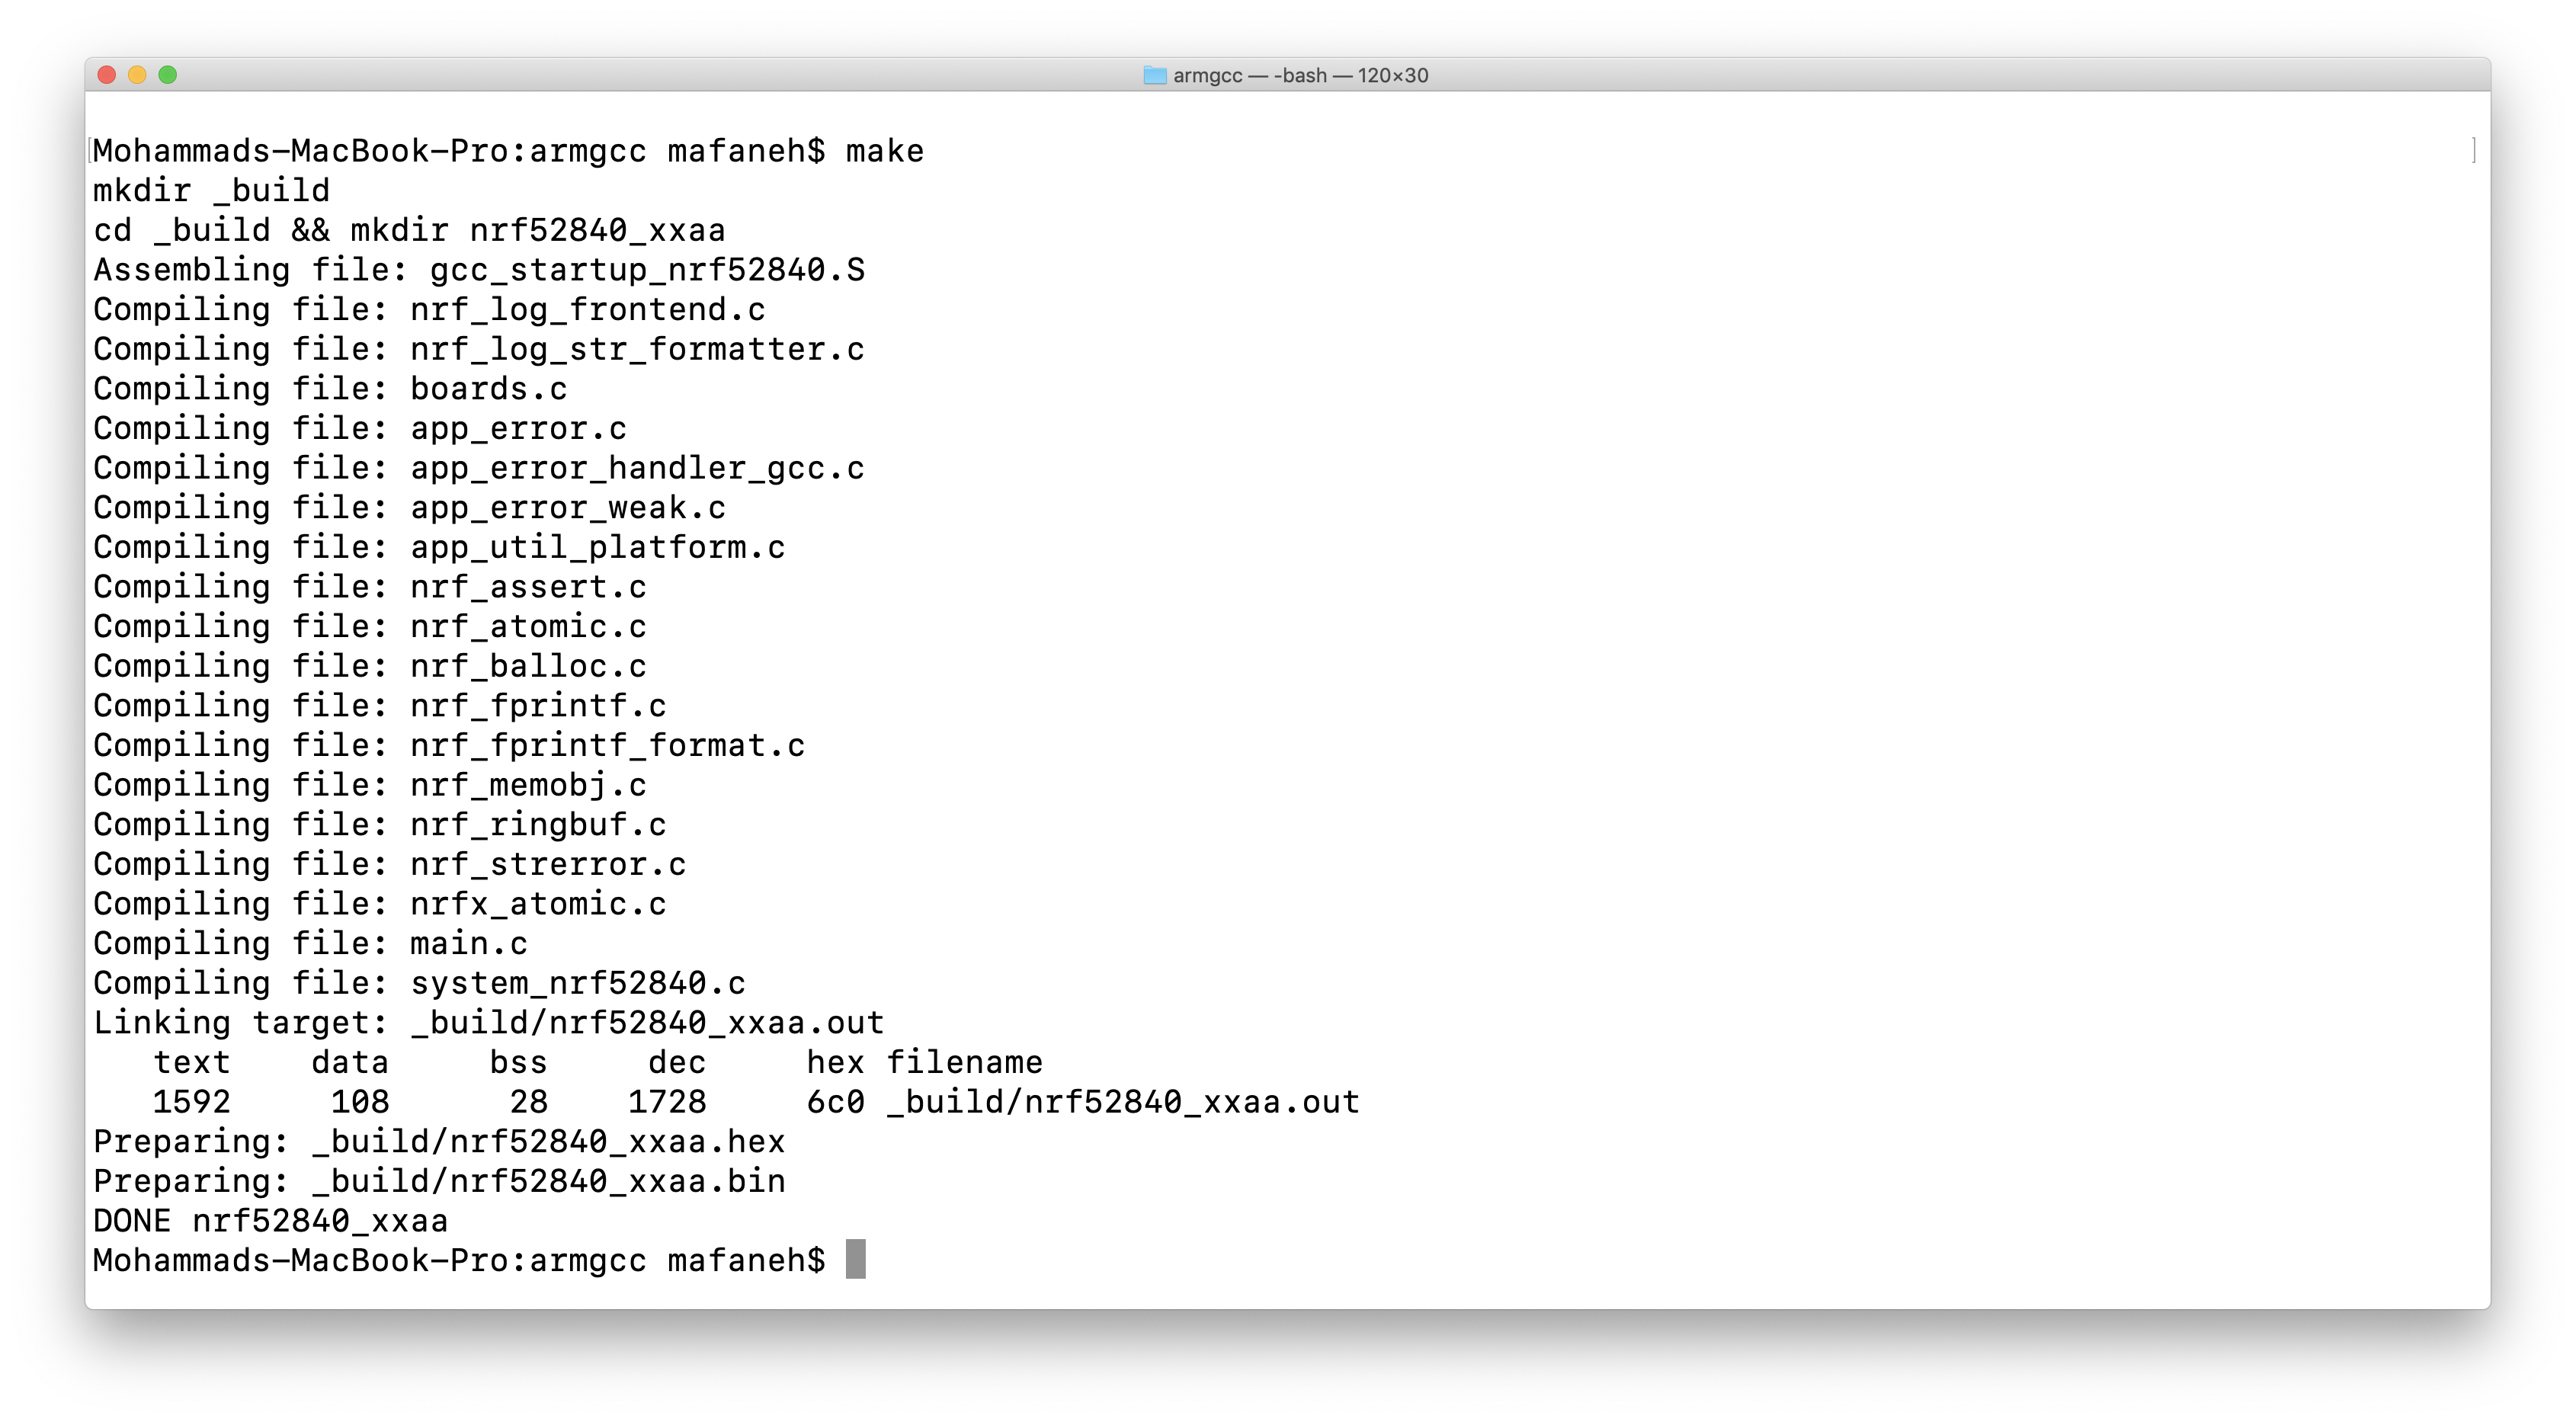
Now, we can go ahead and build the project. To do this, run the following command:
$ make
The output should look something like this:
2. Hardware Setup
The second step is to get the hardware set up to run the example.
Here are the steps to accomplish this:
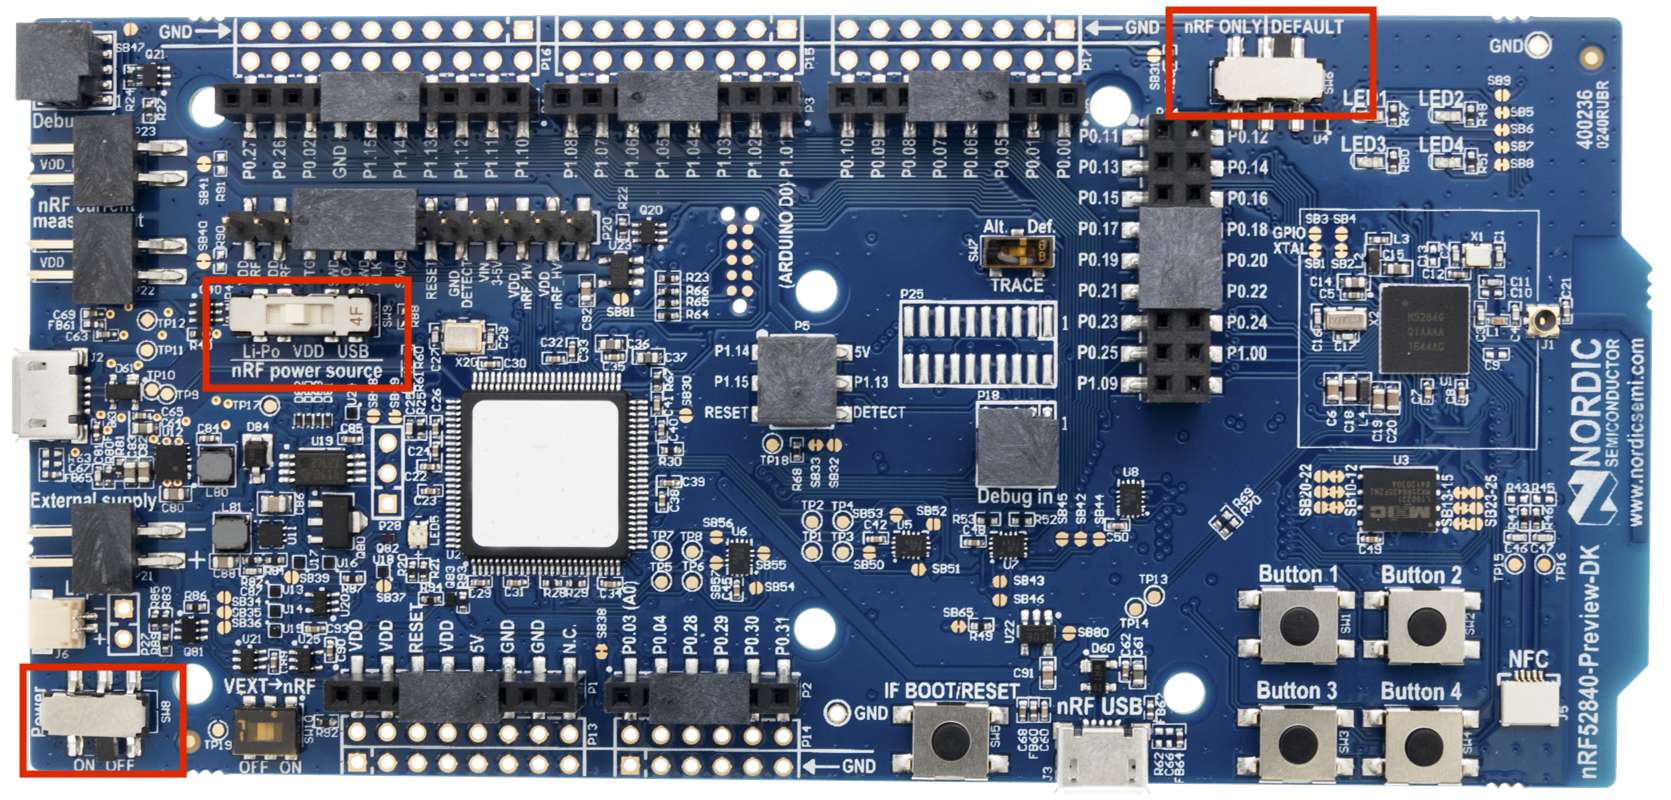
- Connect the development kit to your computer (via the micro-USB to USB-A cable)
- Make sure the development kit jumpers are in the right settings:
- SW6 set to “Default” (not “nRF ONLY”)
- SW9 (nRF power source) set to “VDD”
- Power set to “ON”
-
Erase the development kit by running the following command:
$ nrfjprog -f NRF52 --eraseall -
The final step is to flash the development kit with the example’s binary.
To do so, run the following command from the folder
<nRF5_SDK_Folder>/examples/peripheral/blinky/pca10056/blank/armgcc.$ nrfjprog -f NRF52 --program _build/nrf52840_xxaa.hex --chiperase
That’s it!
Now the nRF52840 development kit should be flashed with the UART example and it should be running properly.
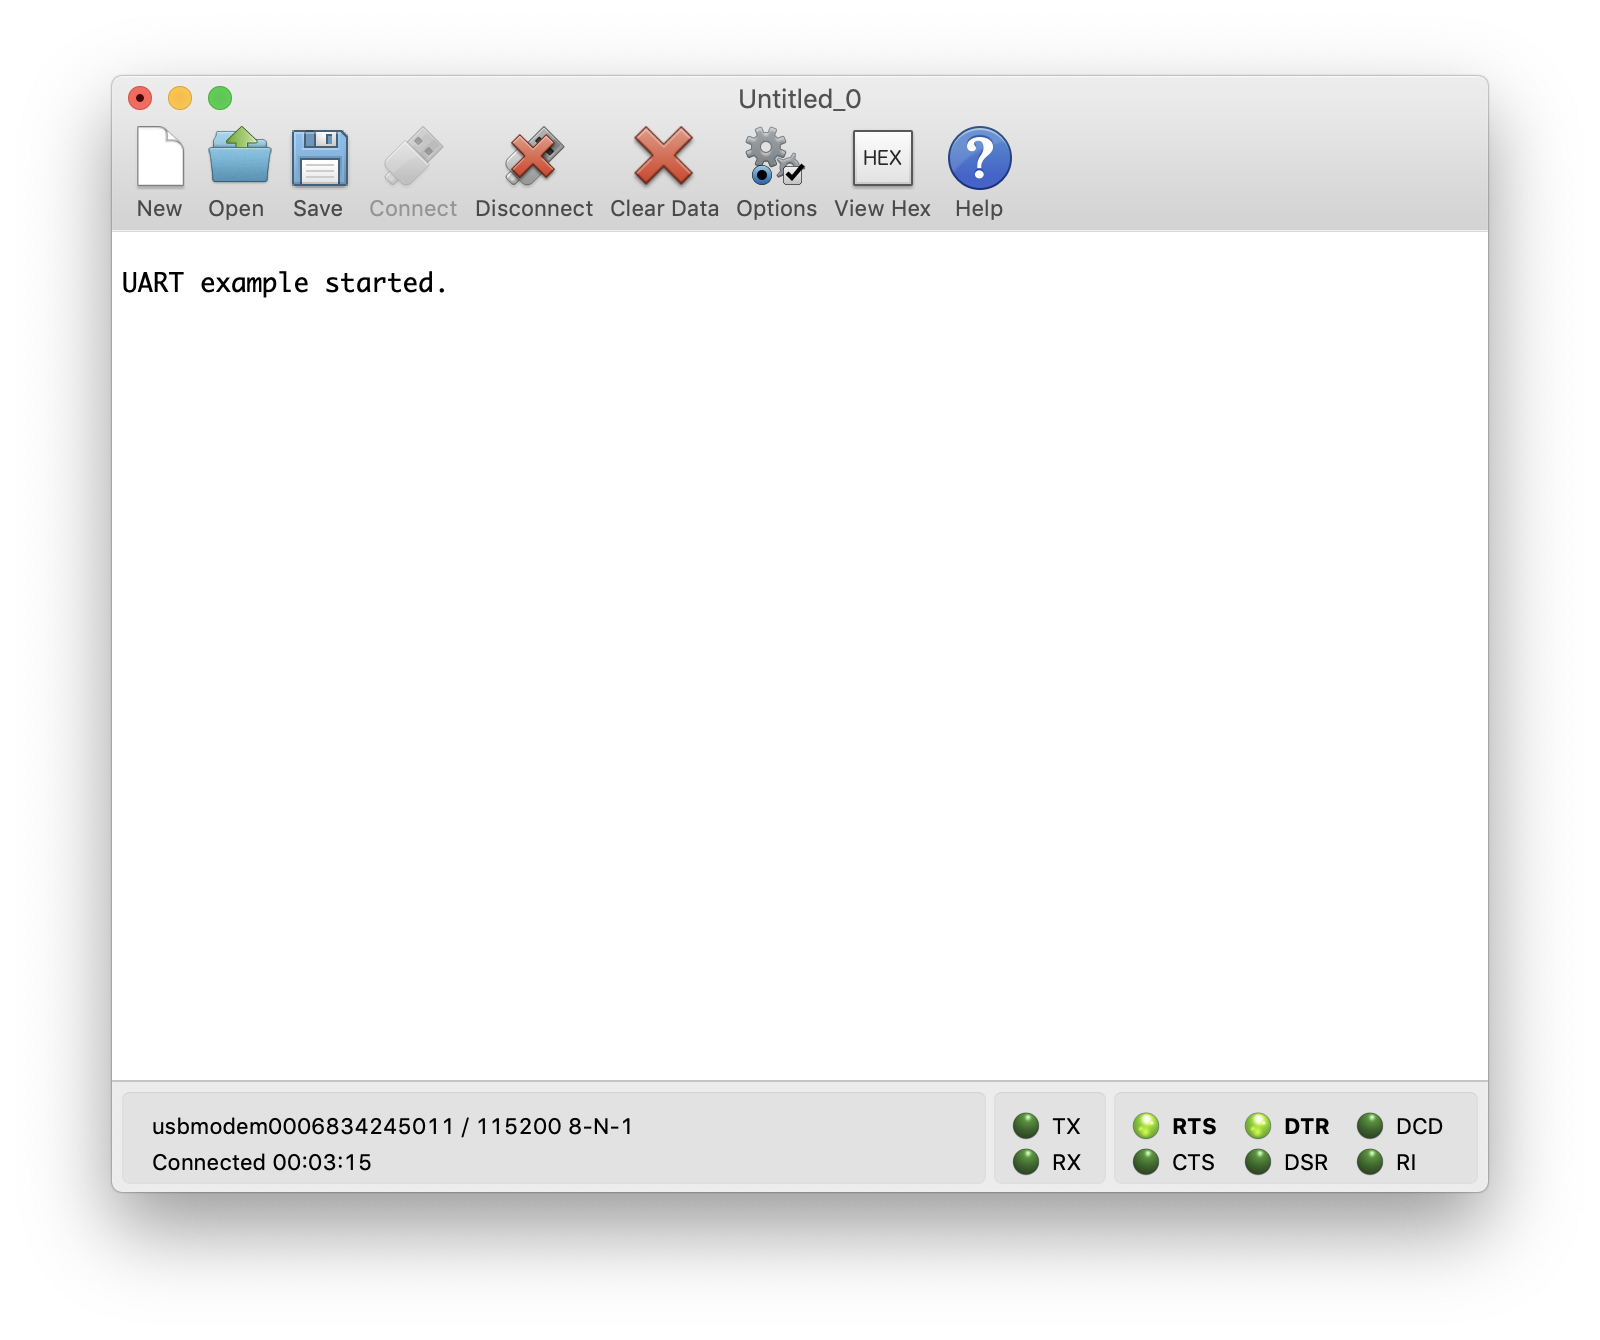
To verify that, we will be using a serial terminal program.
3. Serial Terminal Program Setup
As we mentioned earlier, we’ll be using a program called CoolTerm.
There are three parts to get this working:
- Run the CoolTerm application
-
Make sure the serial port settings are correct (listed at this link):
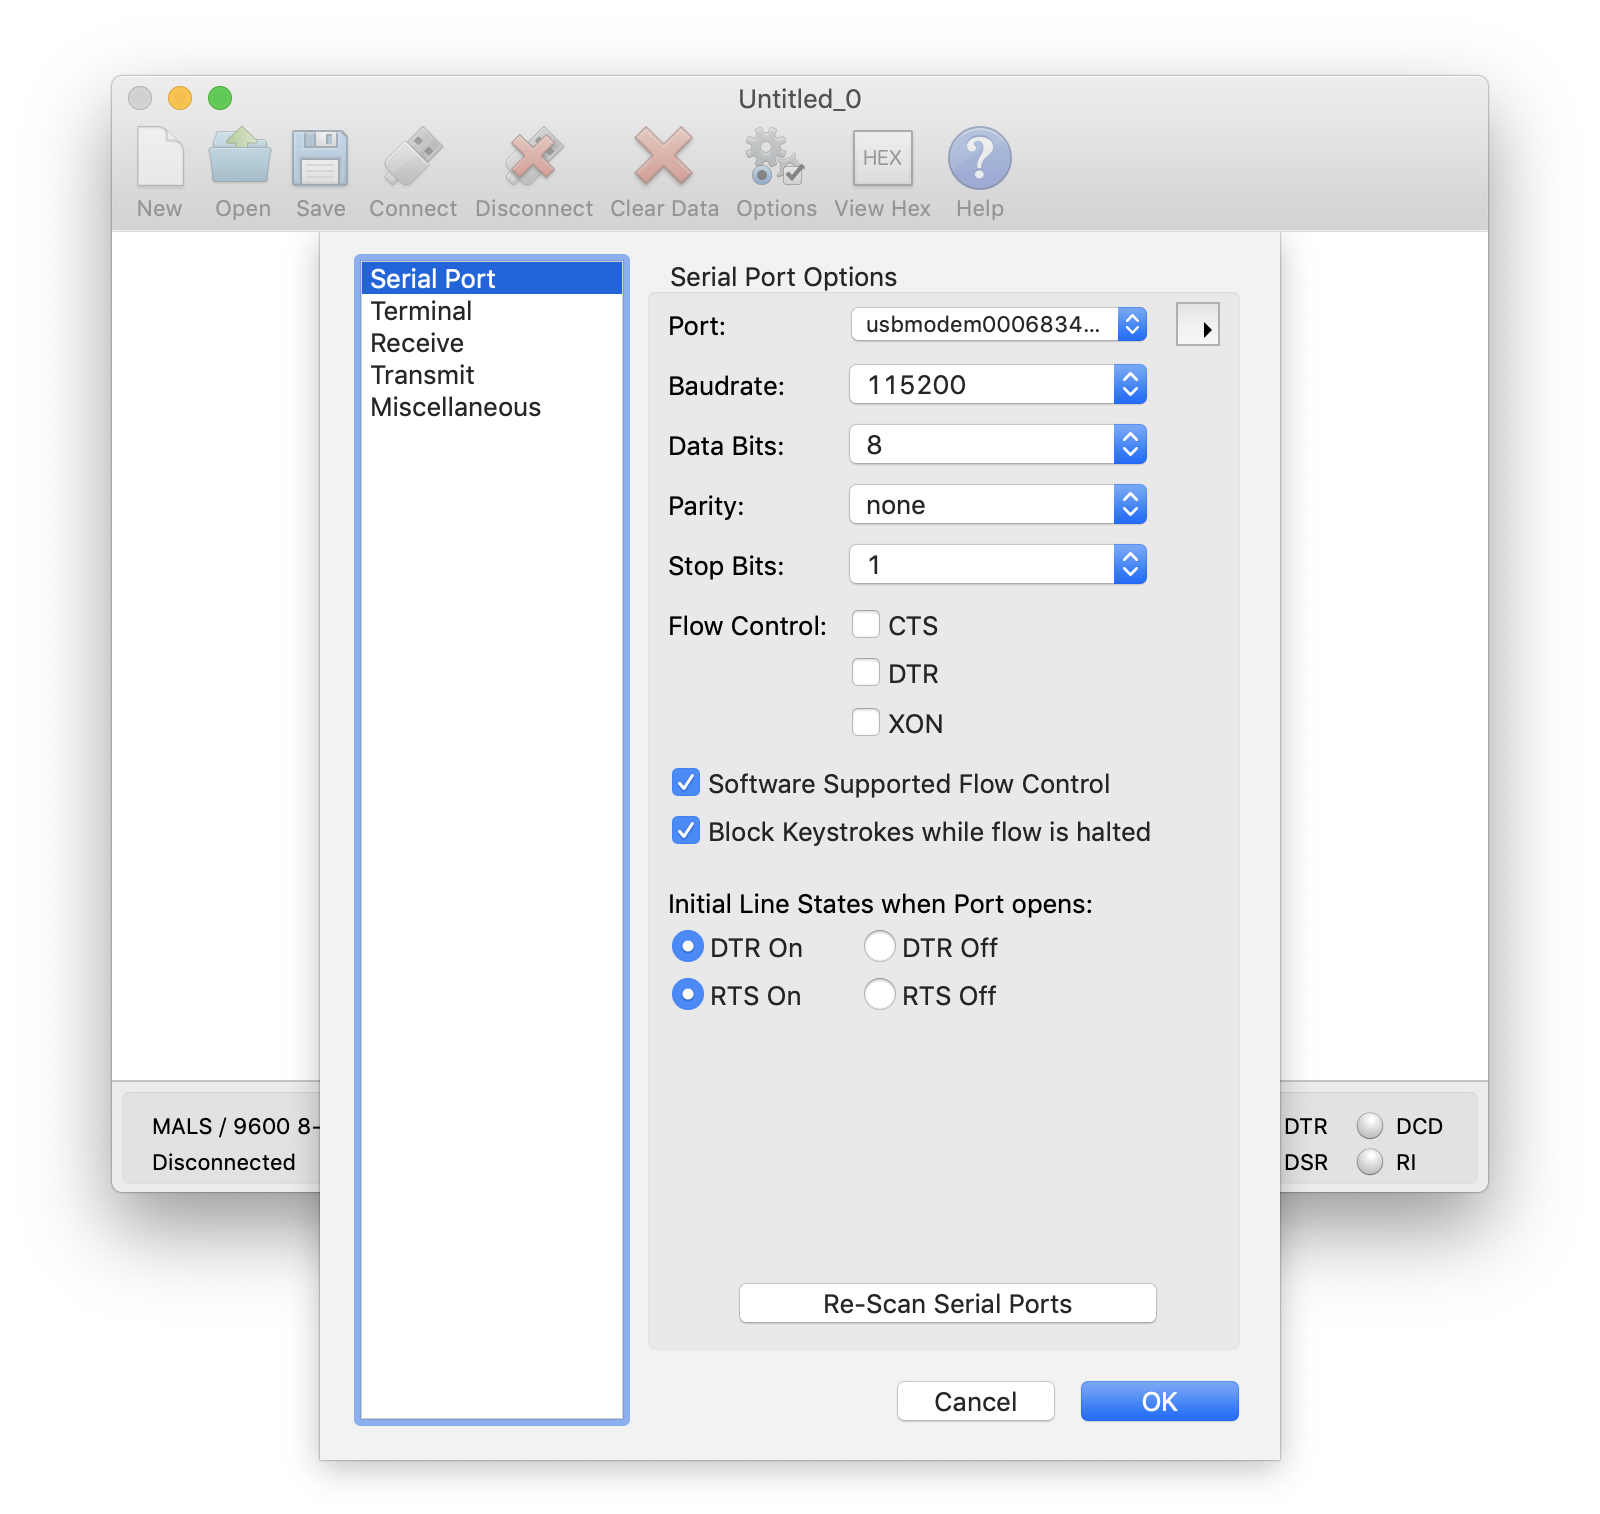
Now, hit OK.
-
Finally, connect to the serial port by clicking the “Connect” button:
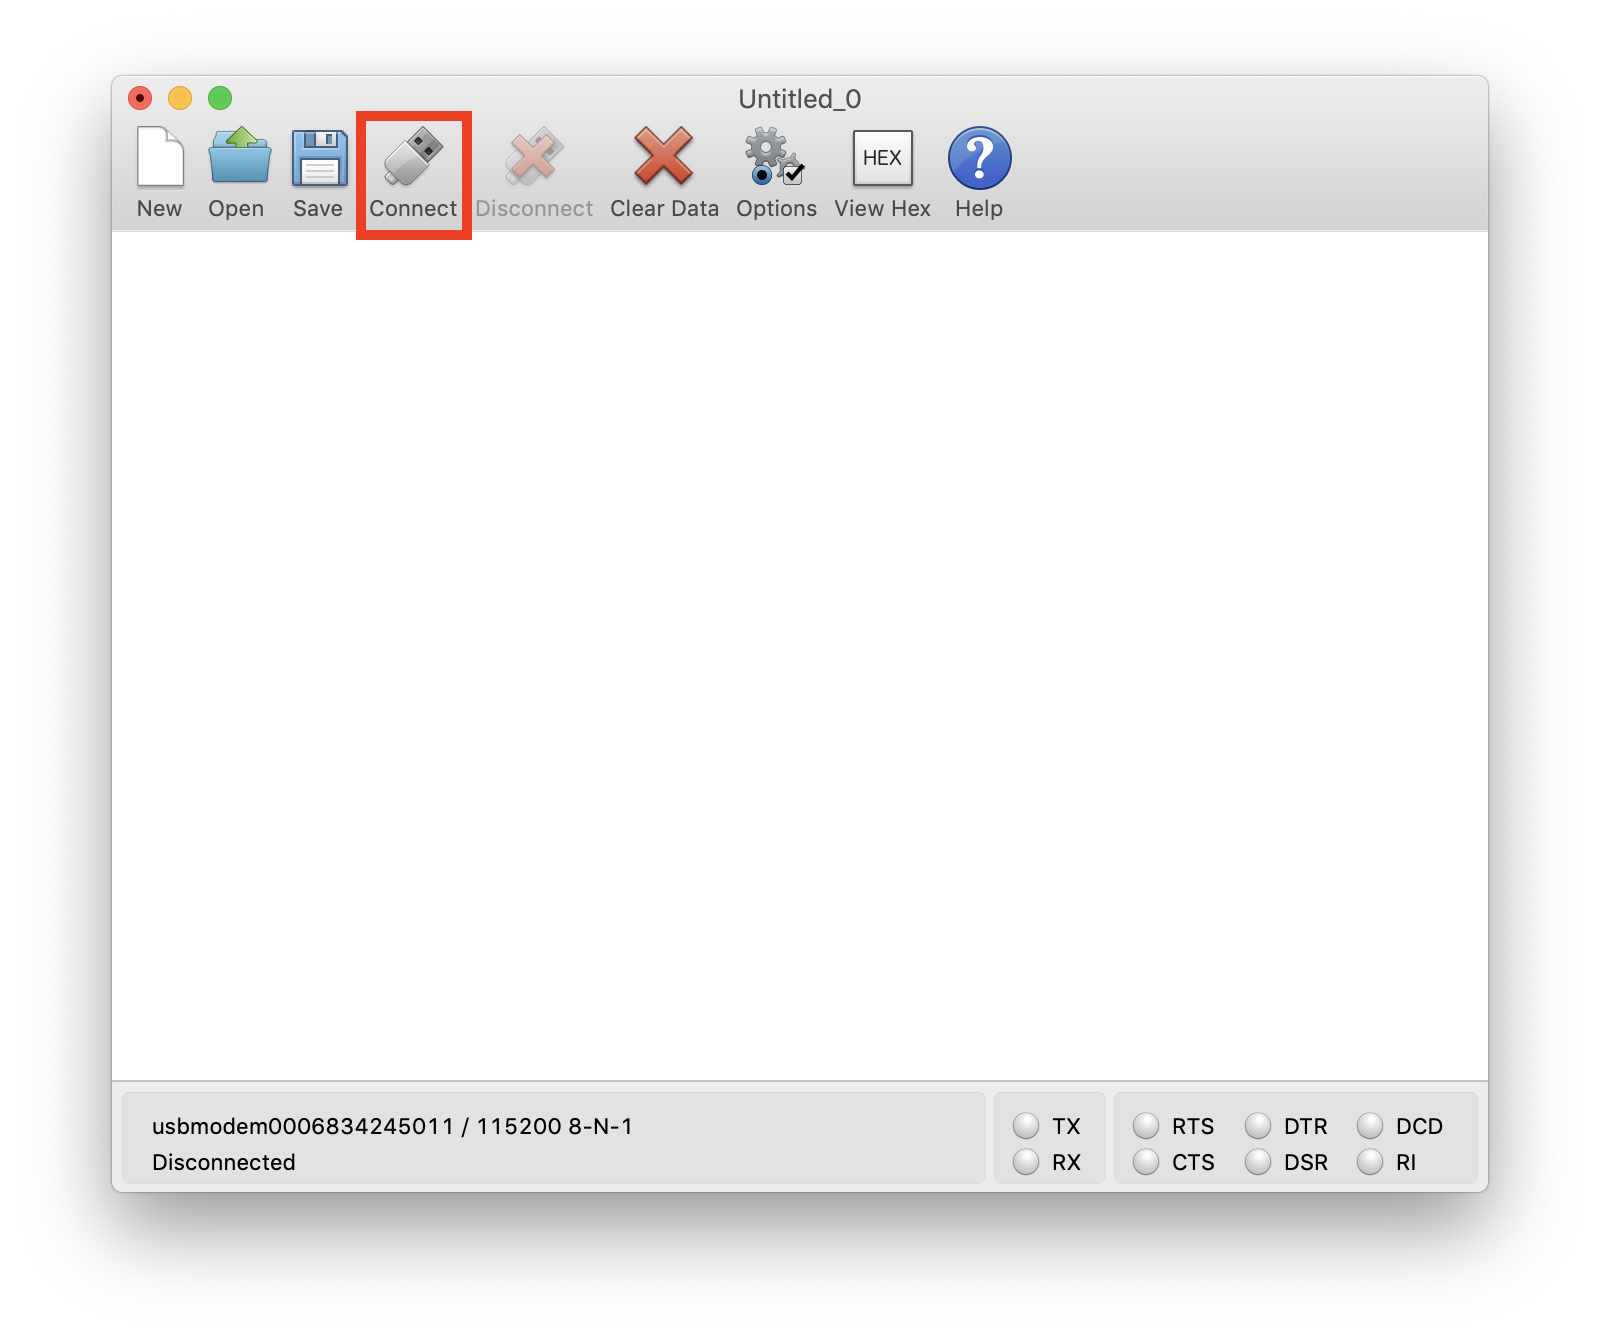
You may not see any output since the program probably started before you connected. To reset the development board, we can simply run the following command from the Terminal:
$ nrfjprog -f NRF52 --resetIf all goes well, you should see the following printed in the Terminal window:
Debugging the Program
Now that we have the application running properly, let’s go ahead and set up the debugger.
1. Remote GDB Setup
There are a few steps to get this working.
-
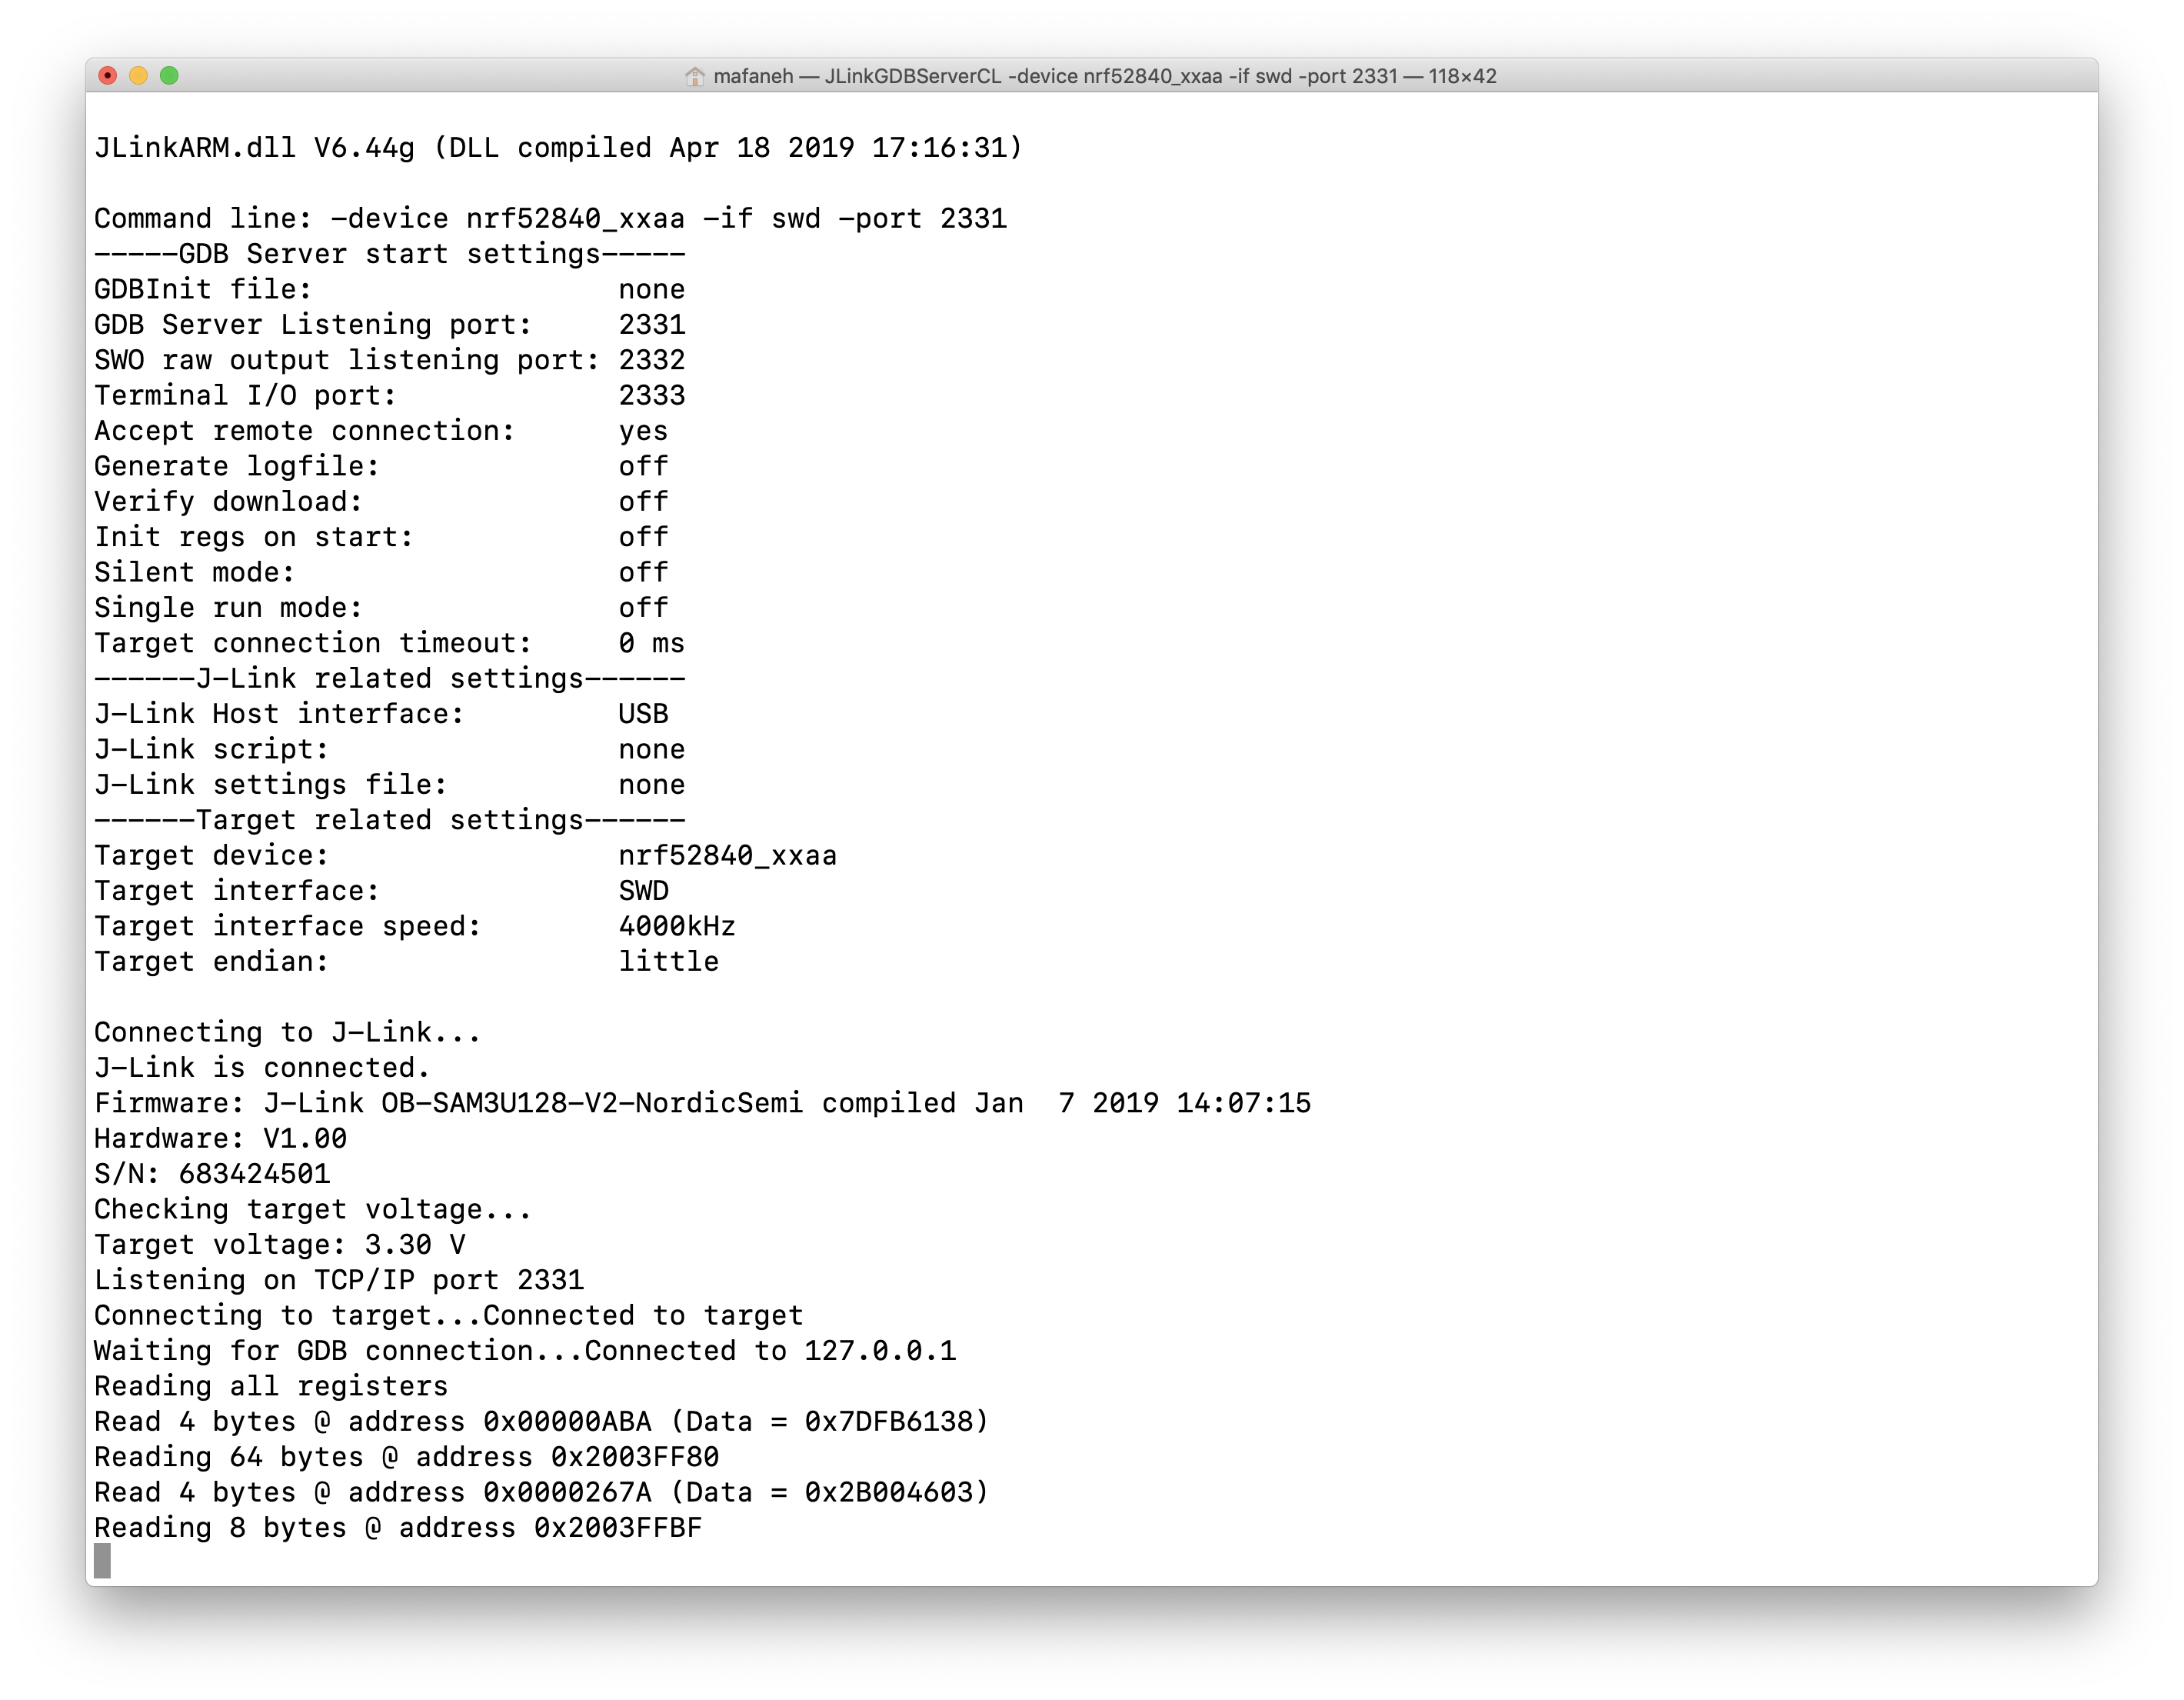
JLinkGDBServer
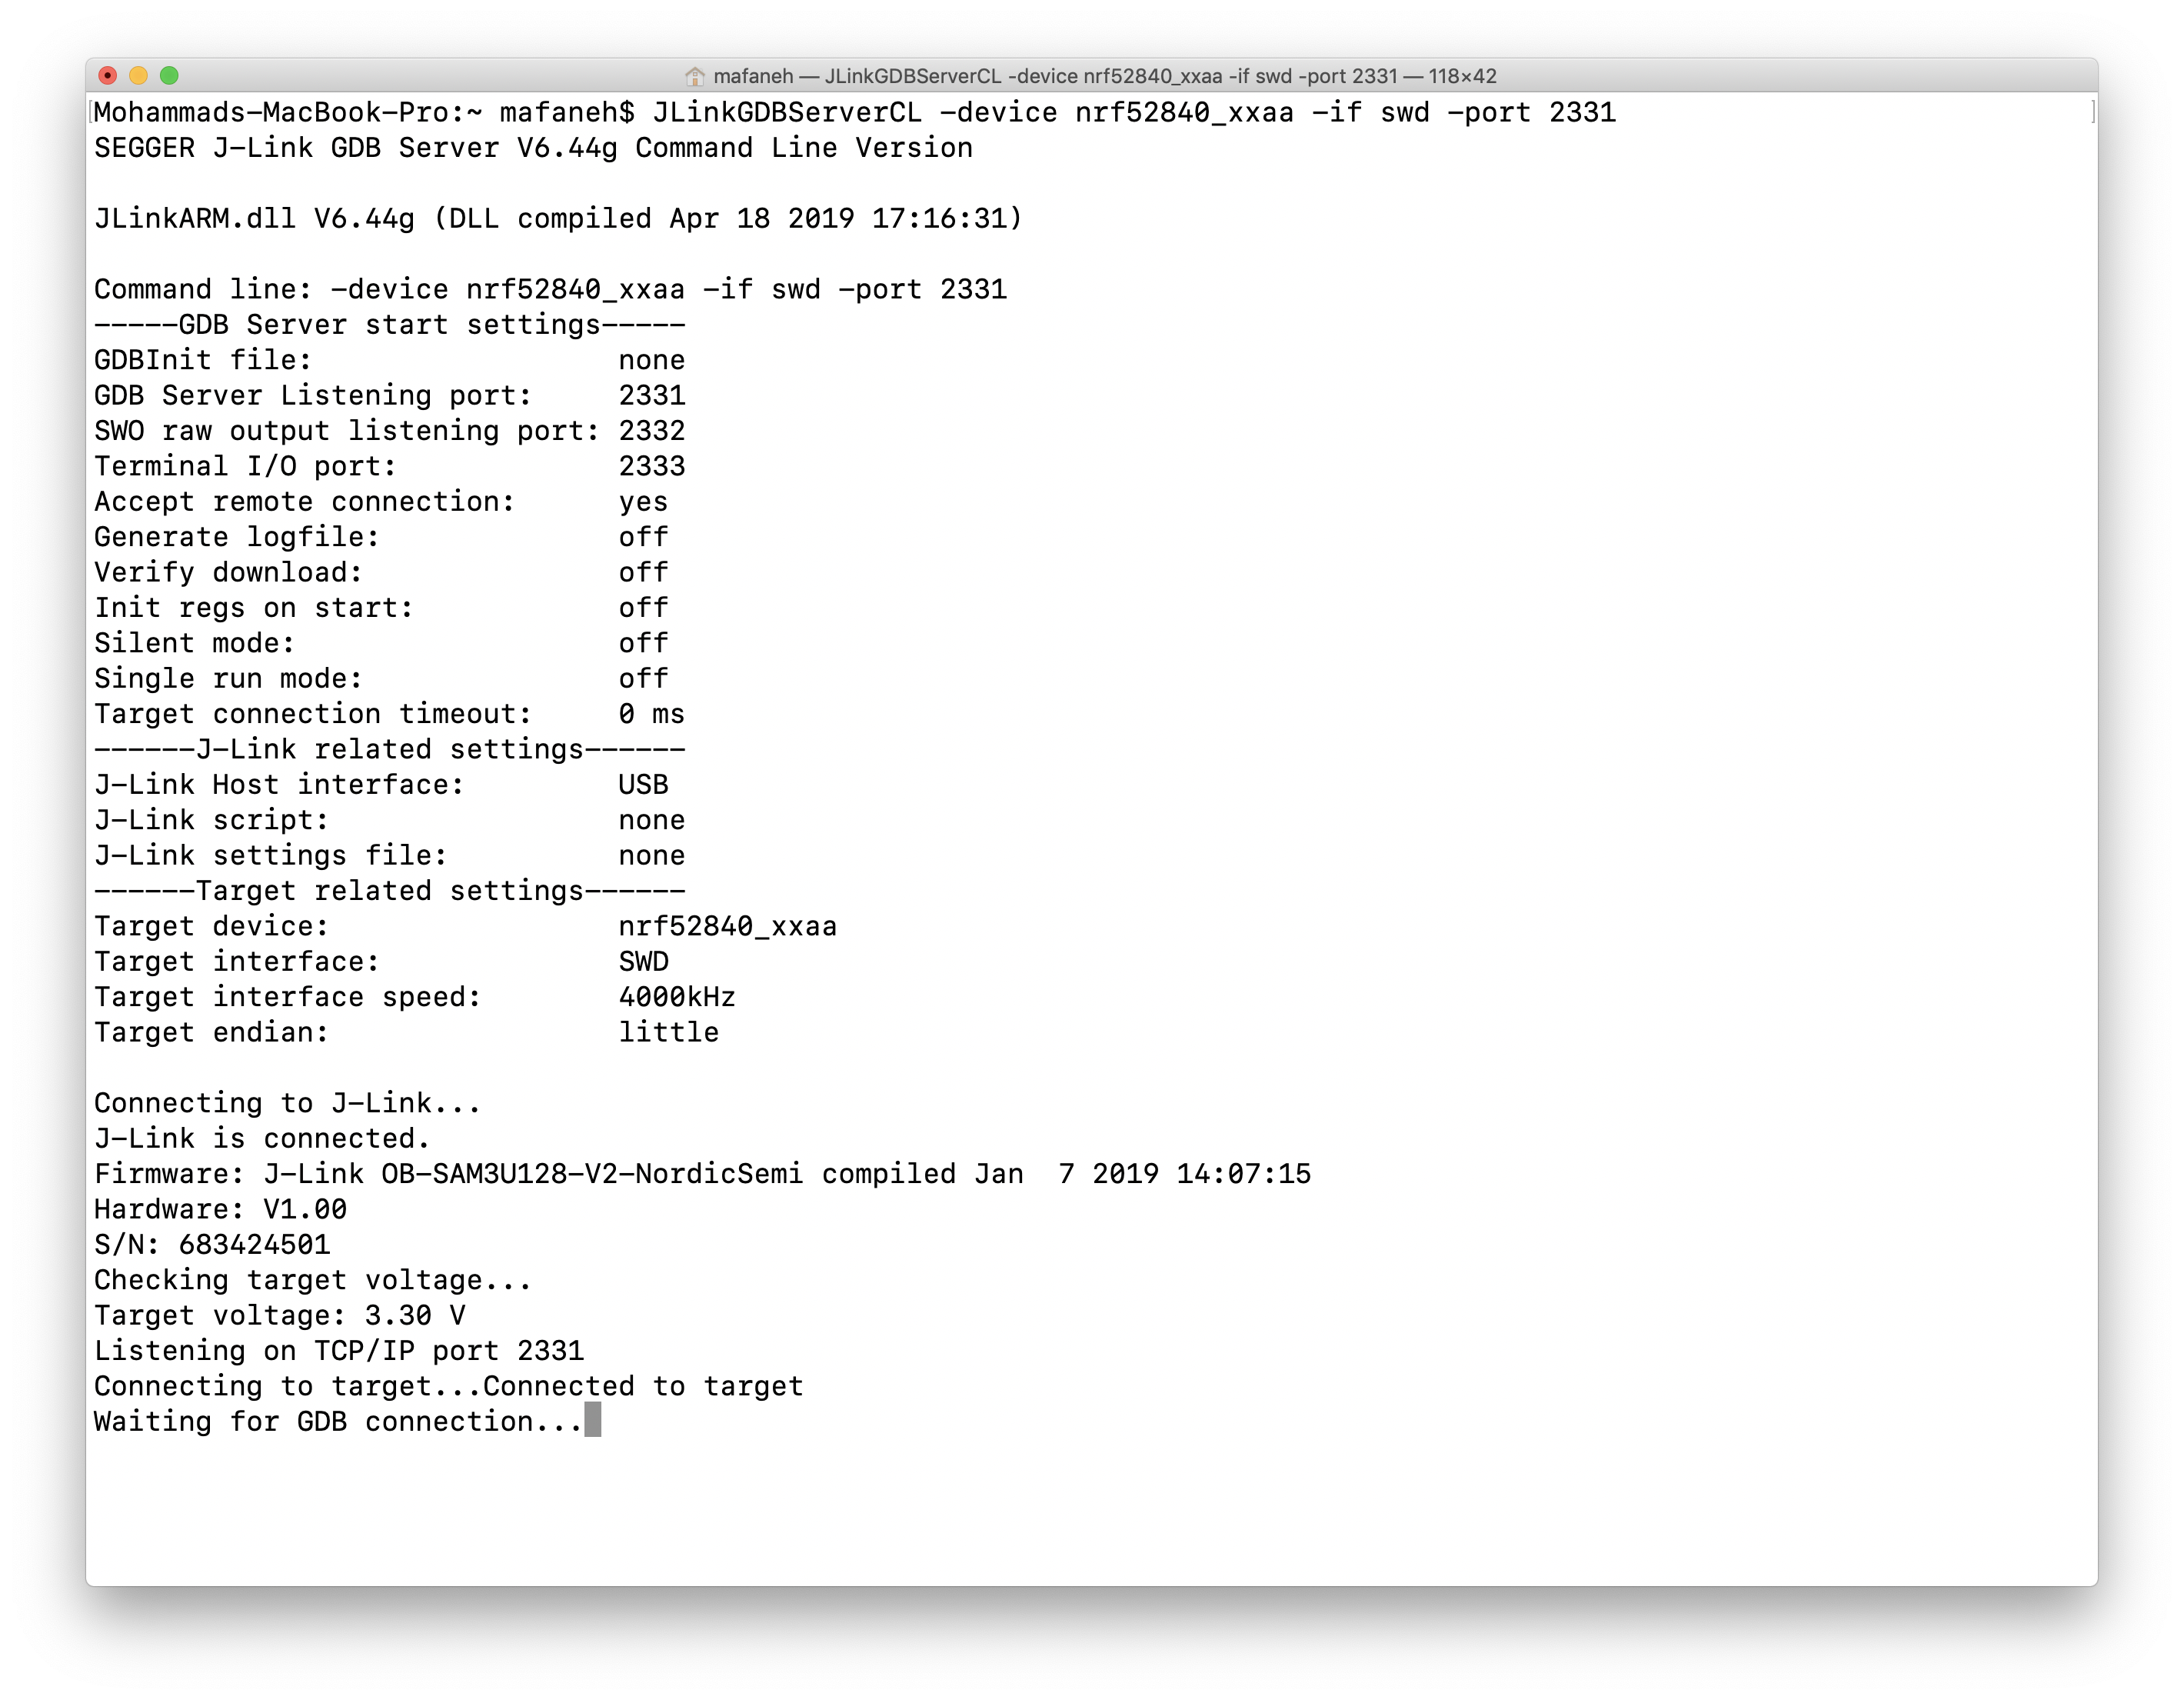
As part of the SEGGER J-Link Software we installed, the program JLinkGDBServer is included. This is the GDB Server application that will interface directly with the development kit and the nRF52840 chipset. It will open up a port (we chose port 2331) over the network to allow connections from a GDB Client.
To start the J-Link GDB Server, run the following command:
$ JLinkGDBServerCL -device nrf52840_xxaa -if swd -port 2331- “-device” specifies the device type (“nrf52840_xxaa” in our case).
- “-if” specifies the debug interface (“swd” refers to Serial Wire Debug which is an alternative to JTAG that is relatively recent and is used for ARM processors. Keep in mind that some chipsets may not support SWD and will require JTAG instead.)
- “-port” specifies the network port where the GDB Server will be accessible by the GDB Client.
The output should look something like this:
-
Running GDB
Now that the GDB Server is running, we have to connect to it from a GDB Client. In our case, the client is the
arm-none-eabi-gdbprogram included as part of the GNU Arm Embedded Toolchain we downloaded earlier.To make things easier, run the following command from the output folder where the binary images for the compiled example are located (
<nRF5_SDK_Folder>/examples/peripheral/uart/pca10056/blank/armgcc/_build/).$ arm-none-eabi-gdb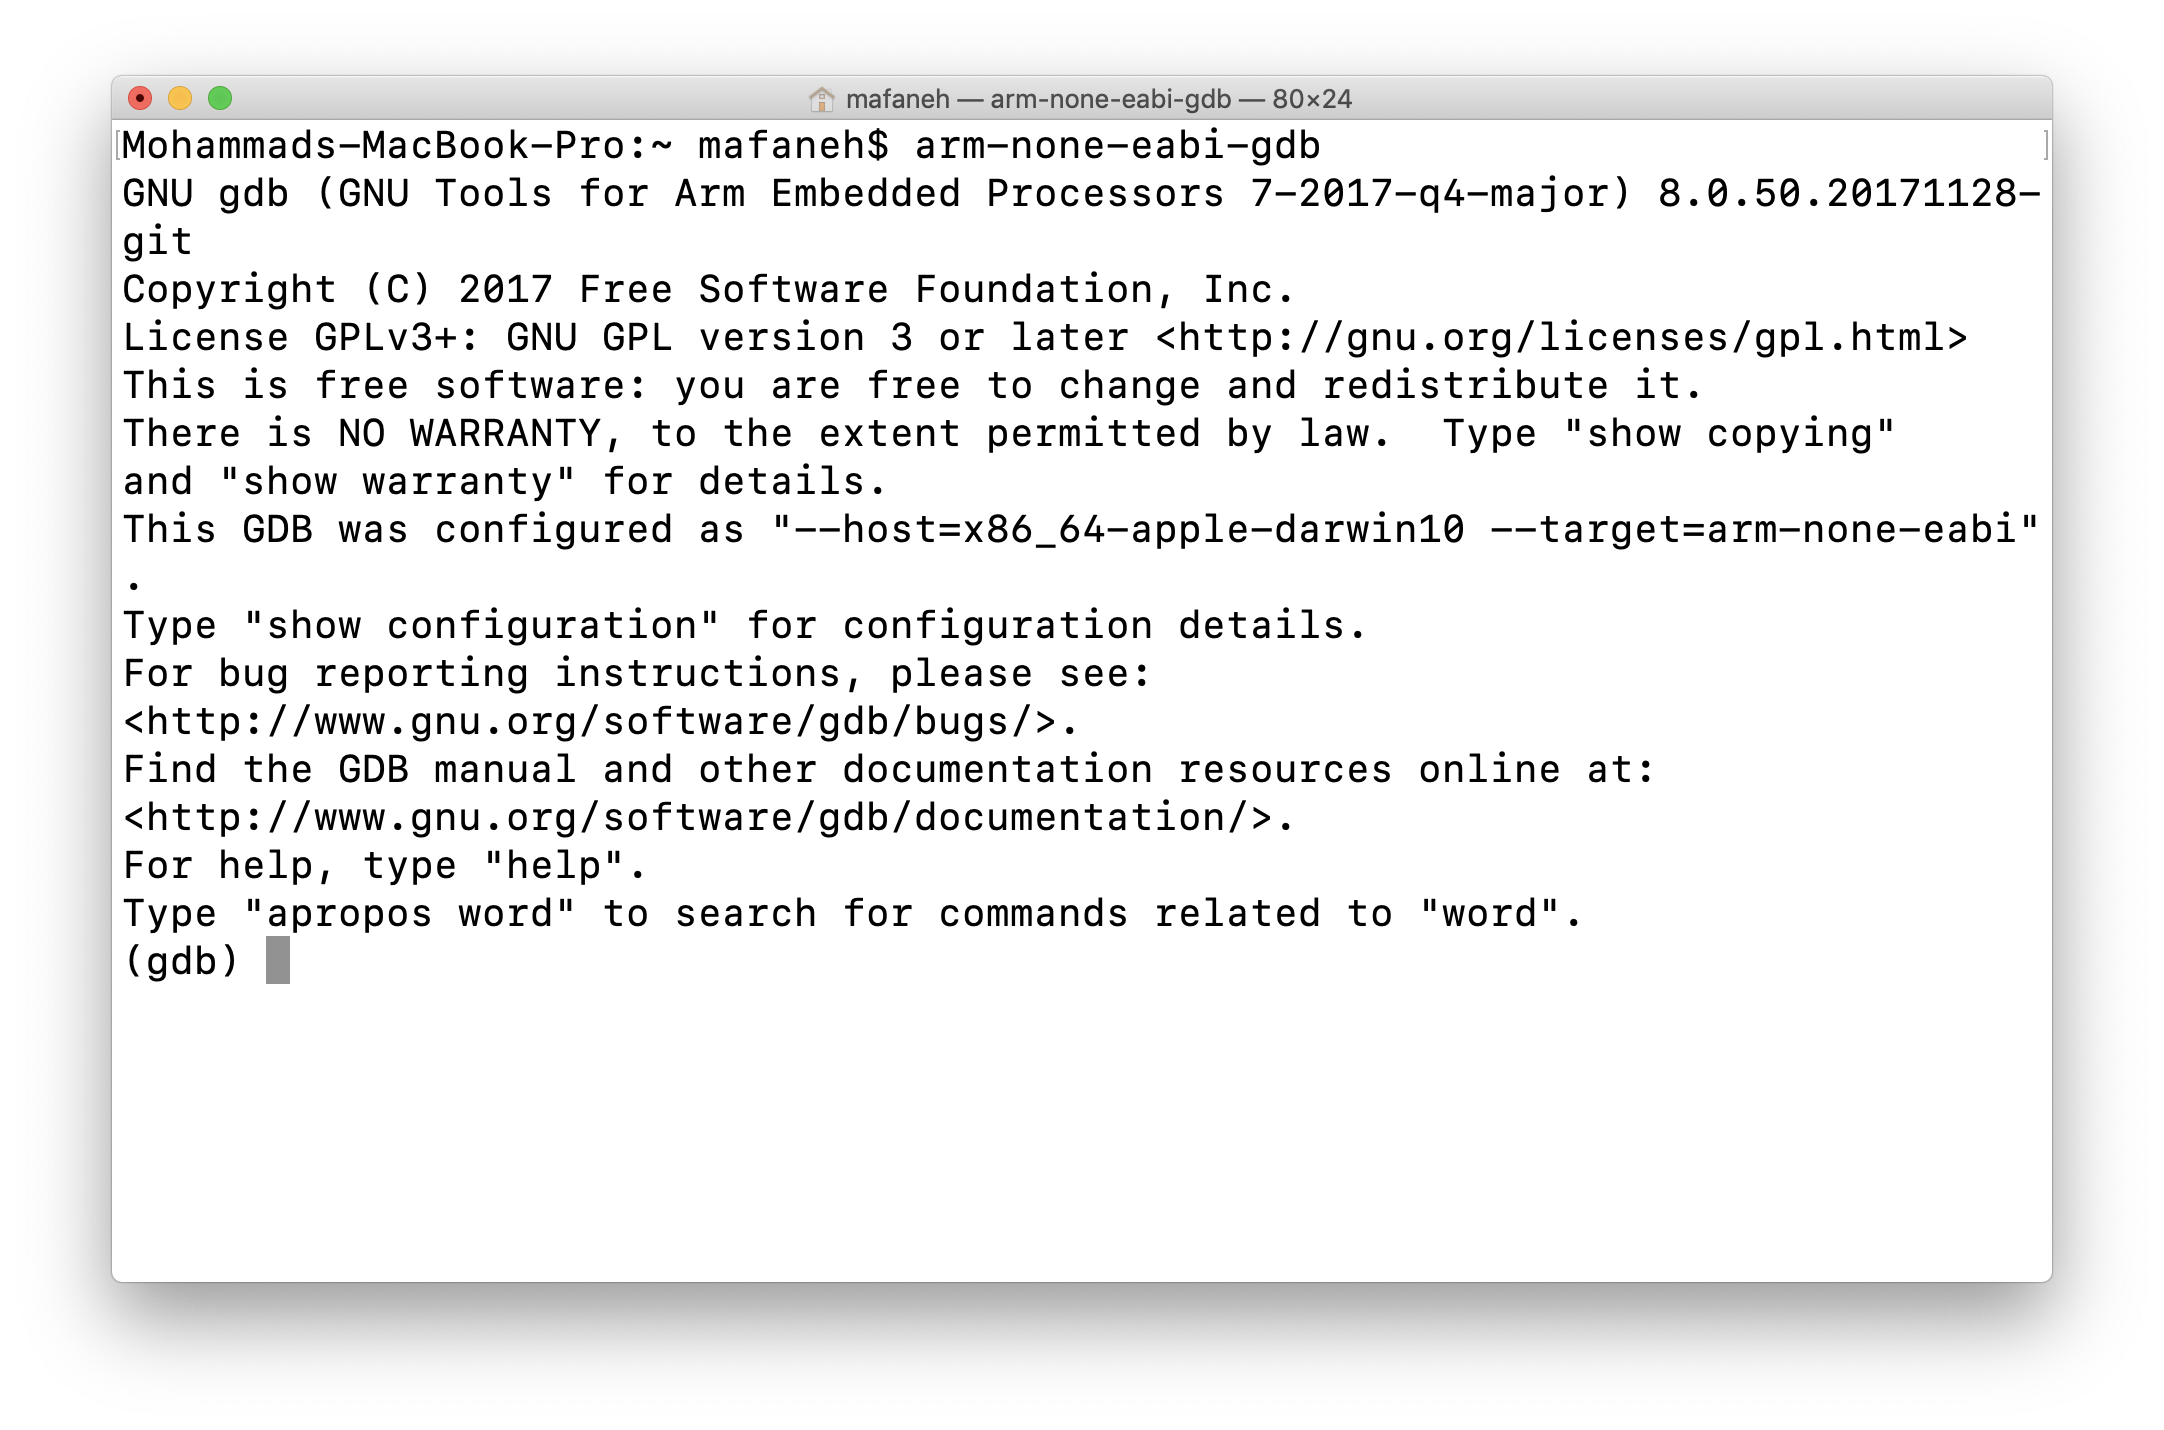
Next, we want to tell GDB what output file is used for the program running on the development kit. We do so with the following command within the GDB console:
(gdb) file nrf52840_xxaa.out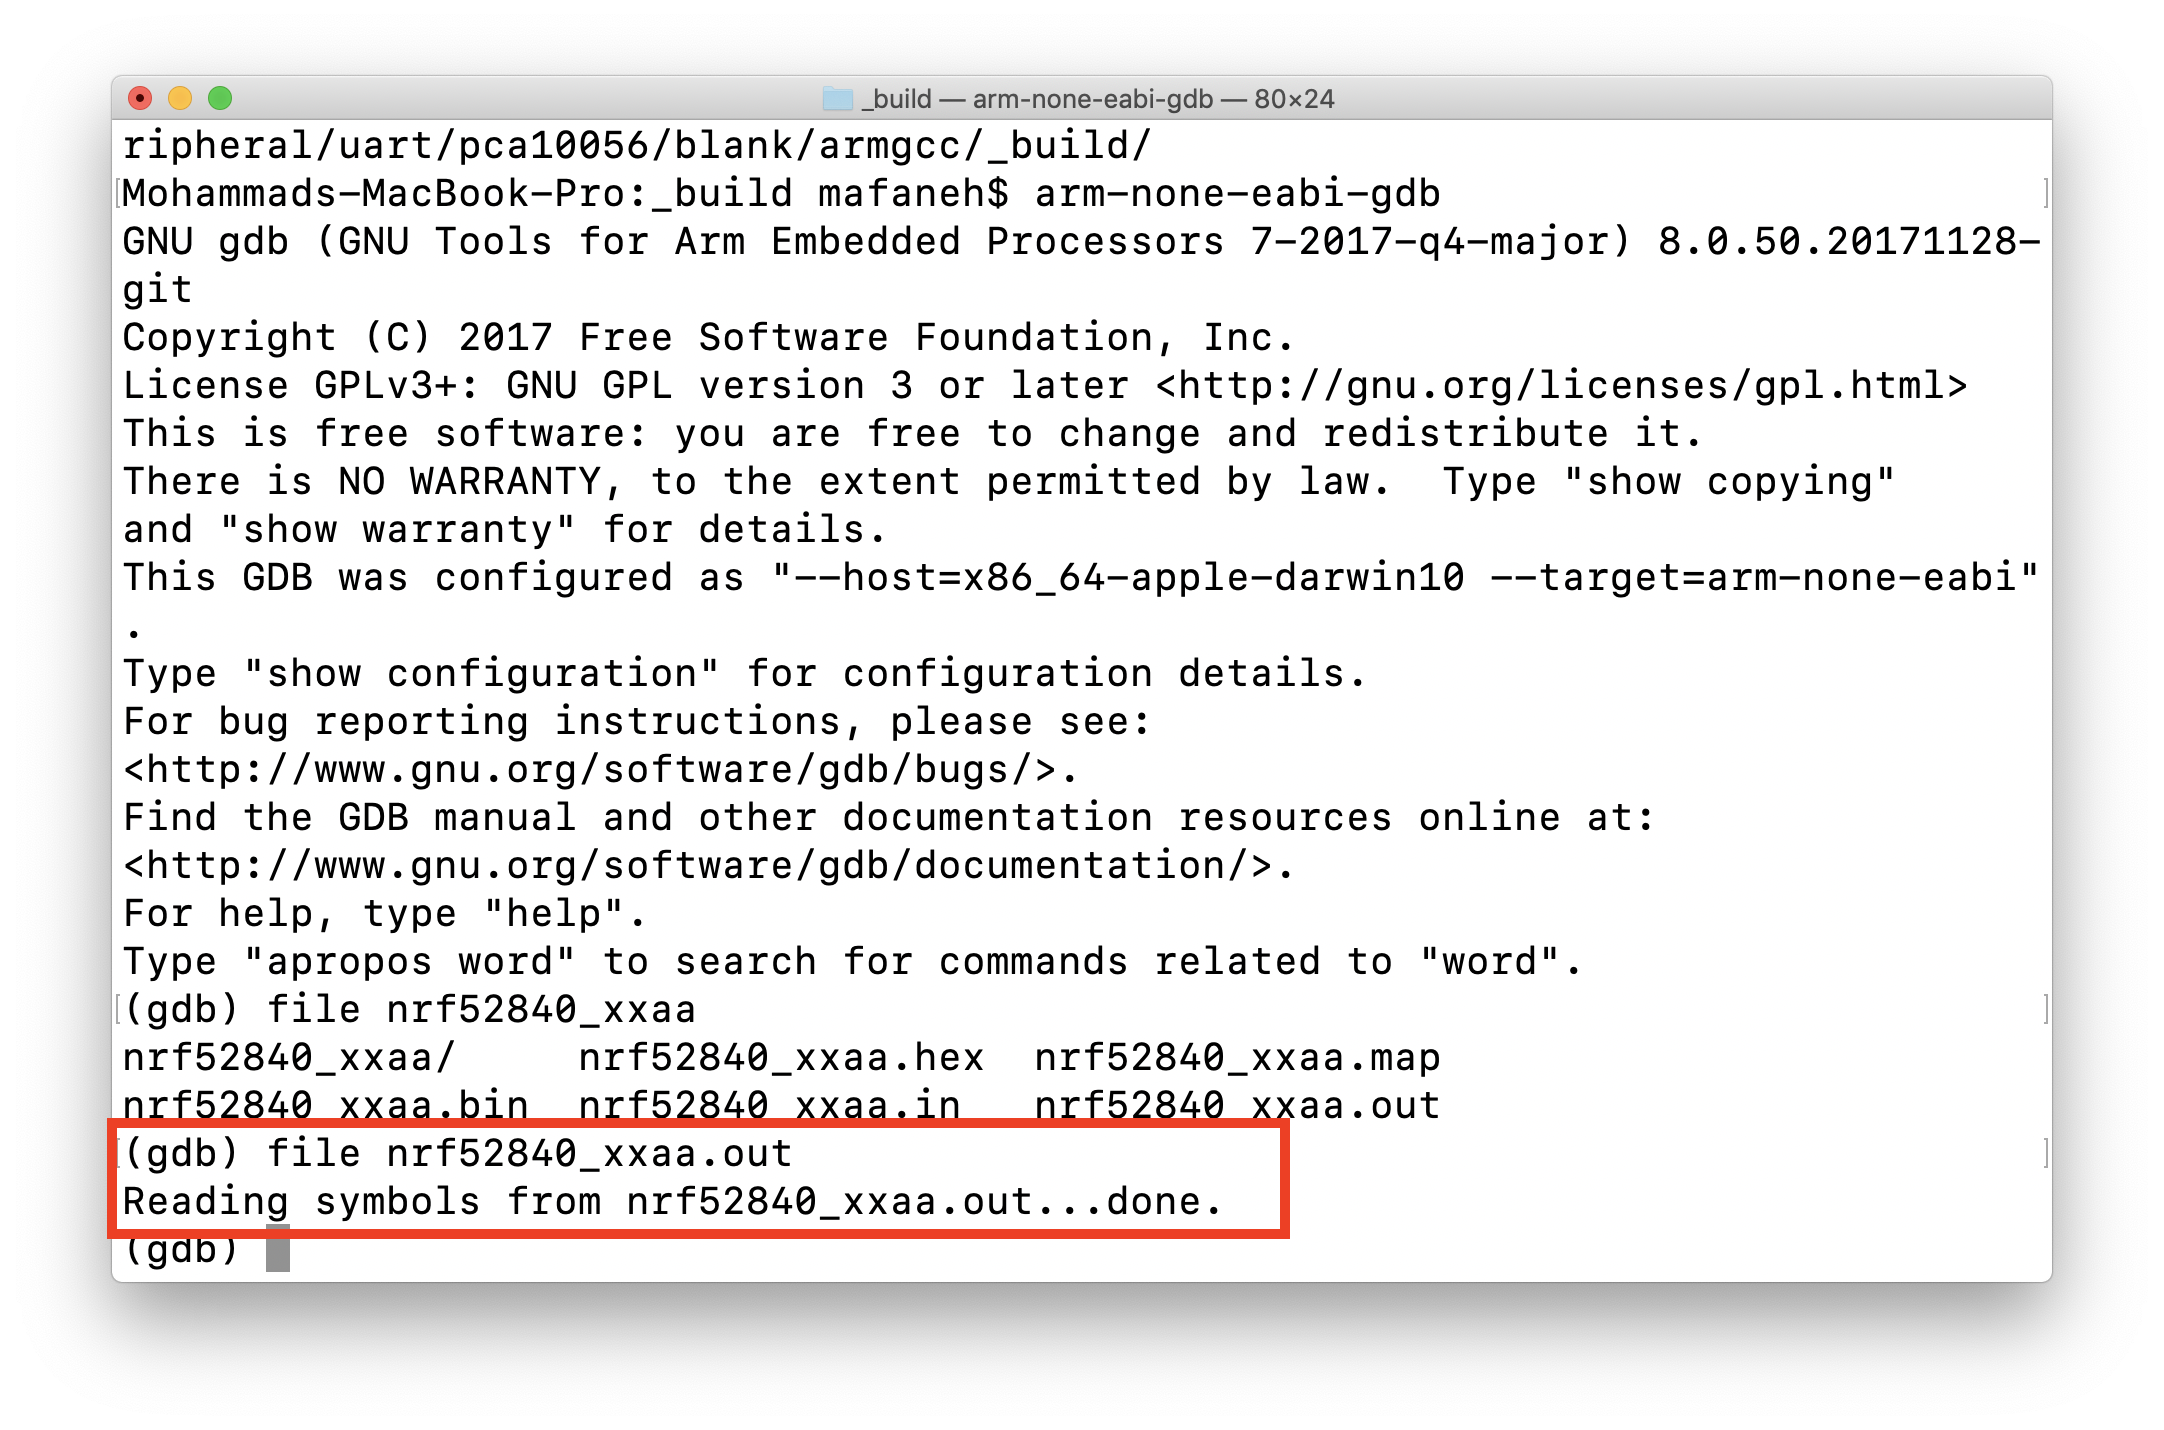
-
Connecting GDB to the Remote Target
The last step is to connect to the GDB server:
(gdb) target remote localhost:2331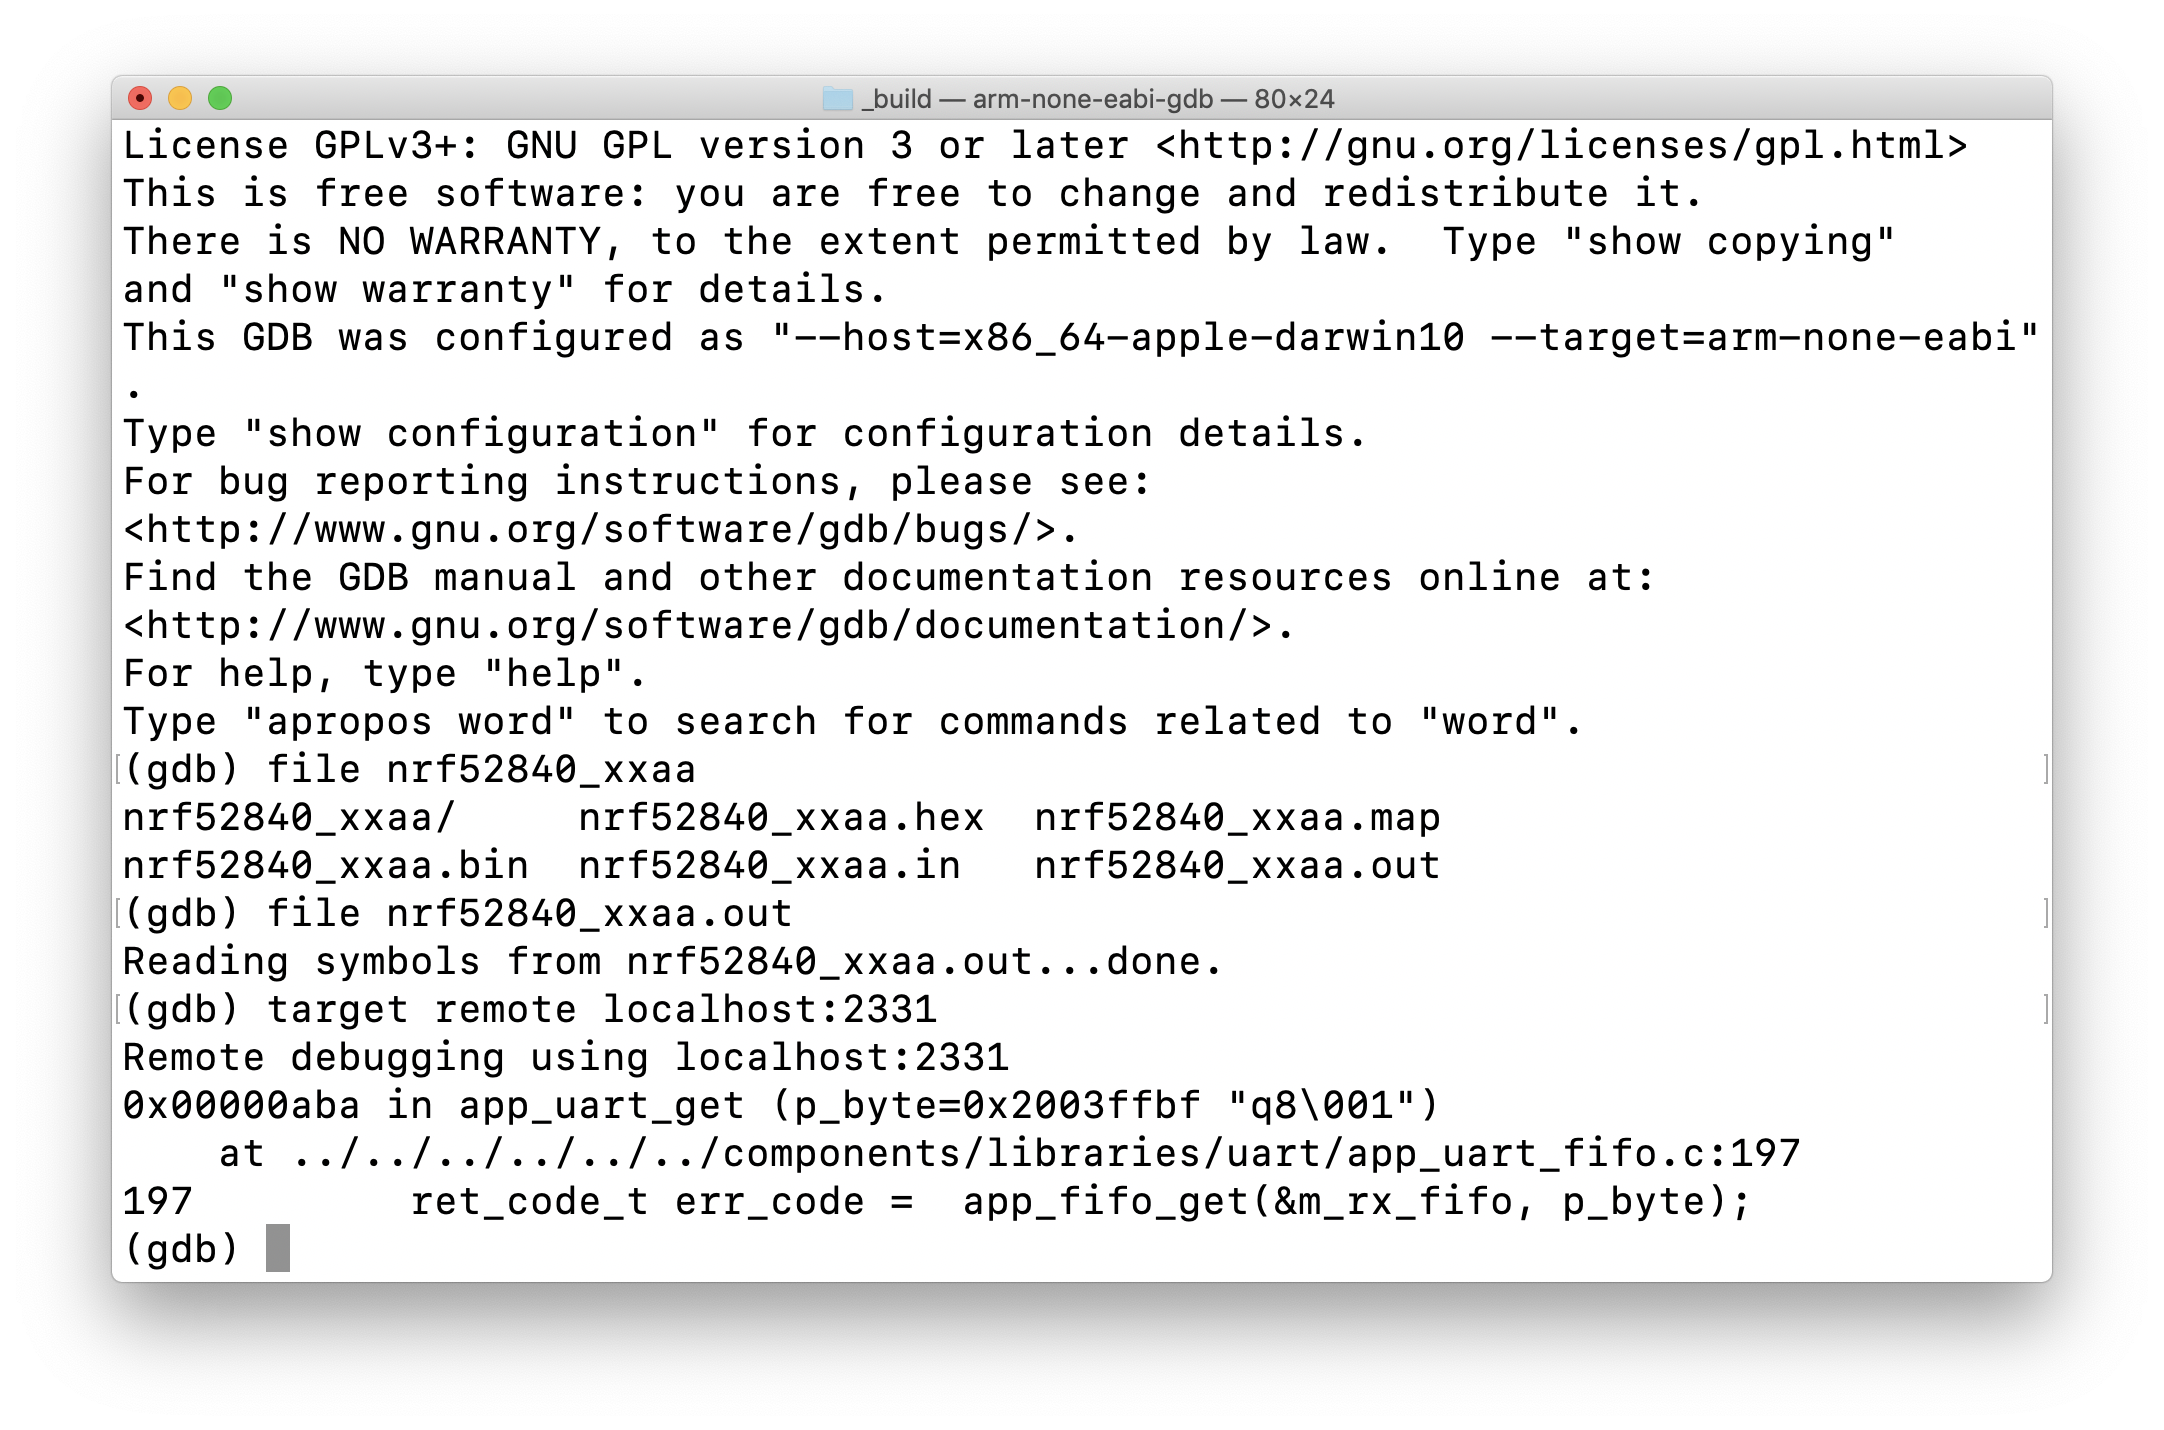
The GDB Server (which should be left running in another Terminal window) will show something like the following:
2. GDB Commands
Now that we’ve been able to connect the debugger to the nRF52 chipset on the development kit, it’s time to start having some fun!
Hint: In the GDB console, pressing “Enter/Return” on a blank line will repeat the last command called.
Here are some of the most useful GDB commands that you can use for debugging your application:
Help
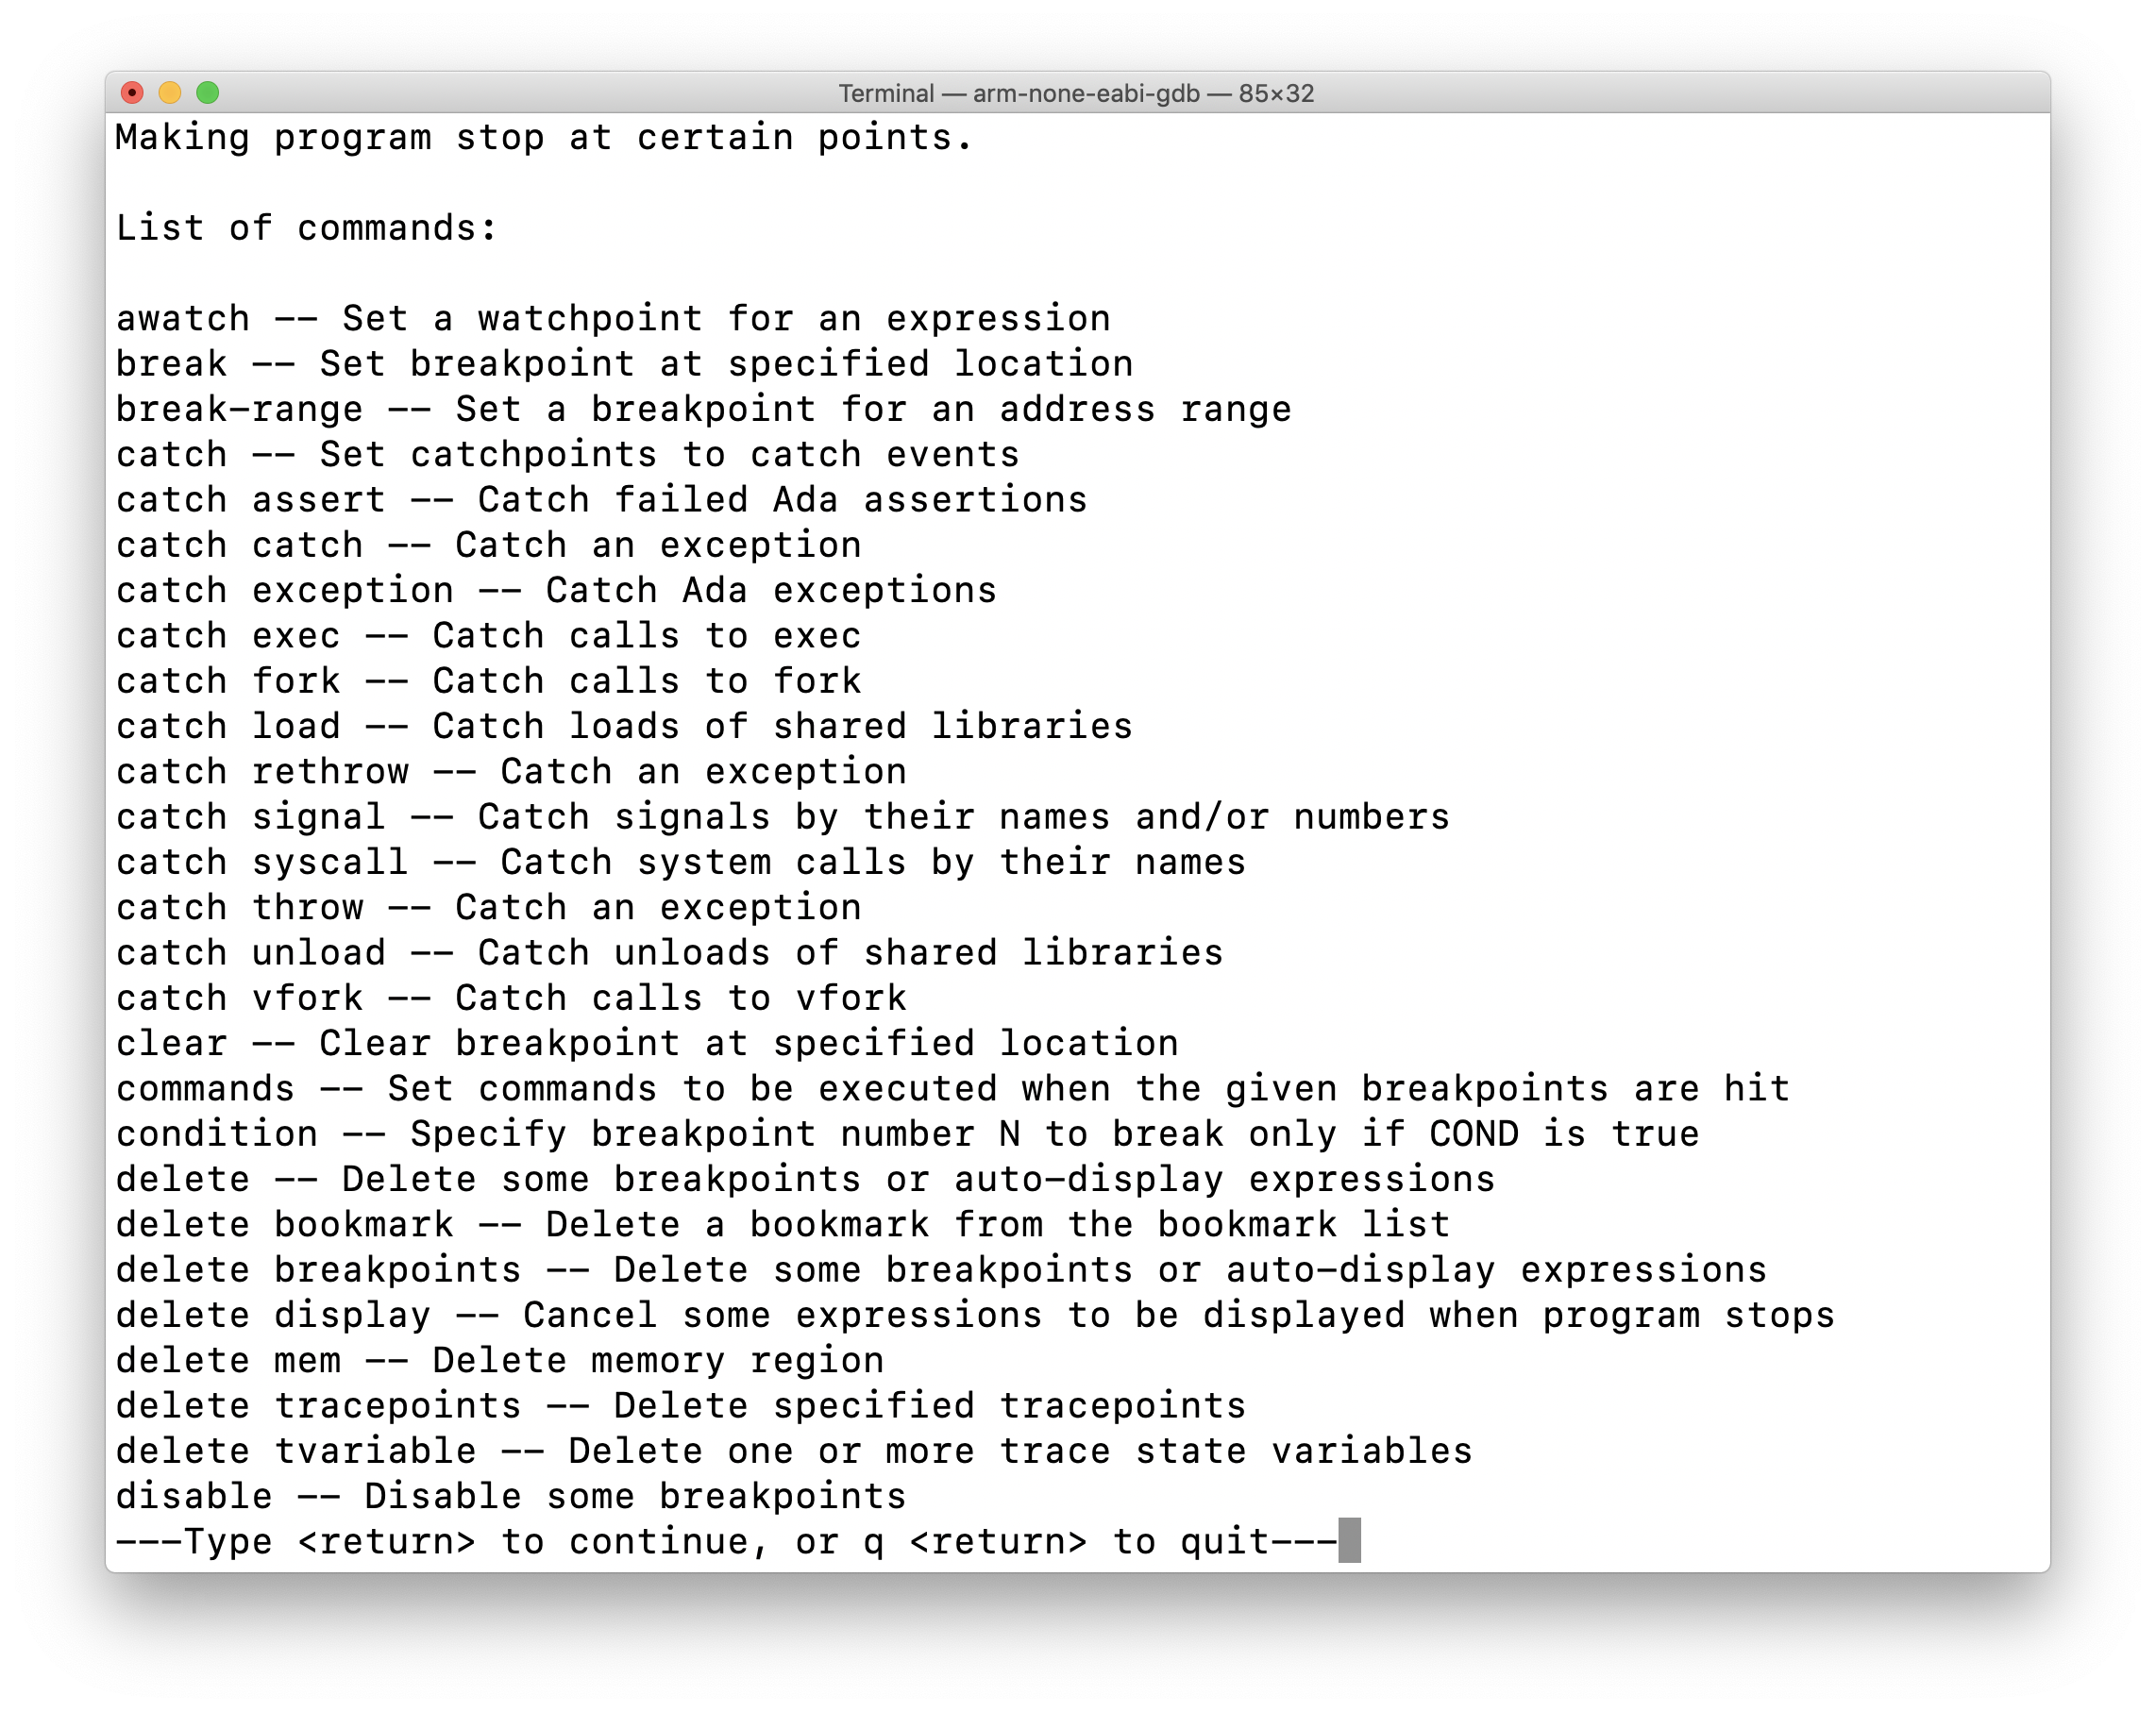
The first command you should be aware of is the help command. You can use help followed by any other command to learn everything you need to know about the usage of that command. Or you could simply type help in the GDB console to see what options are available.
For example, let’s run help for the “breakpoint” command:
Breakpoint
The Breakpoint command is used to set a breakpoint at a location telling the debugger to halt the application when the program reaches that line of code. You can use the shortcut b instead of spelling out the full name, too.
Continue
The Continue command is used to continue execution after a breakpoint was hit. You can simply use the shortcut c instead of spelling out the full word.
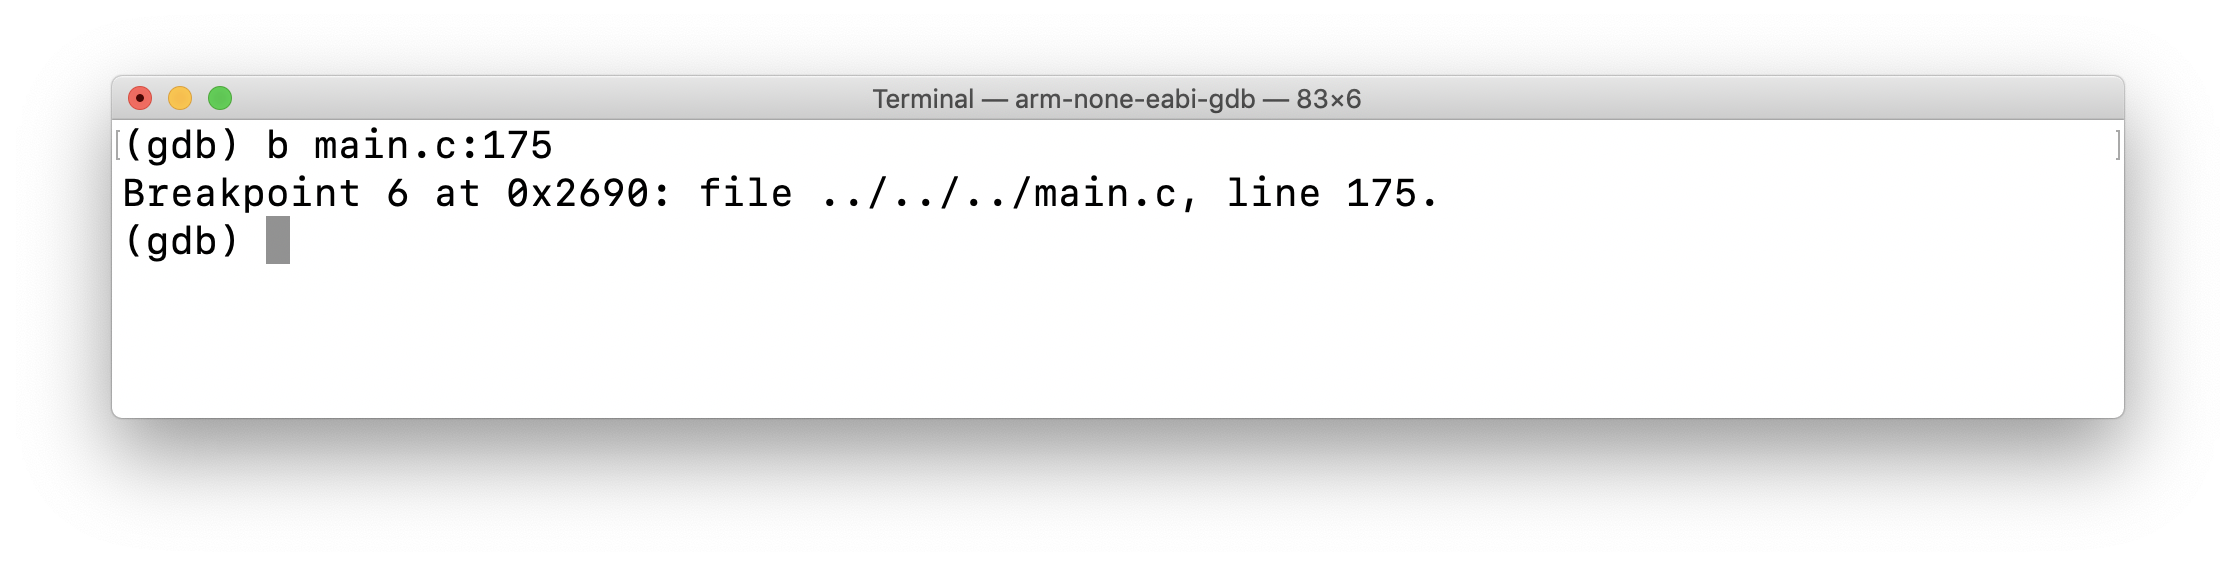
Breakpoints with Condition
Breakpoints are very useful, but sometimes you don’t want the application to stop running unless a certain condition has occurred.
This is where the Breakpoint with condition command comes in.
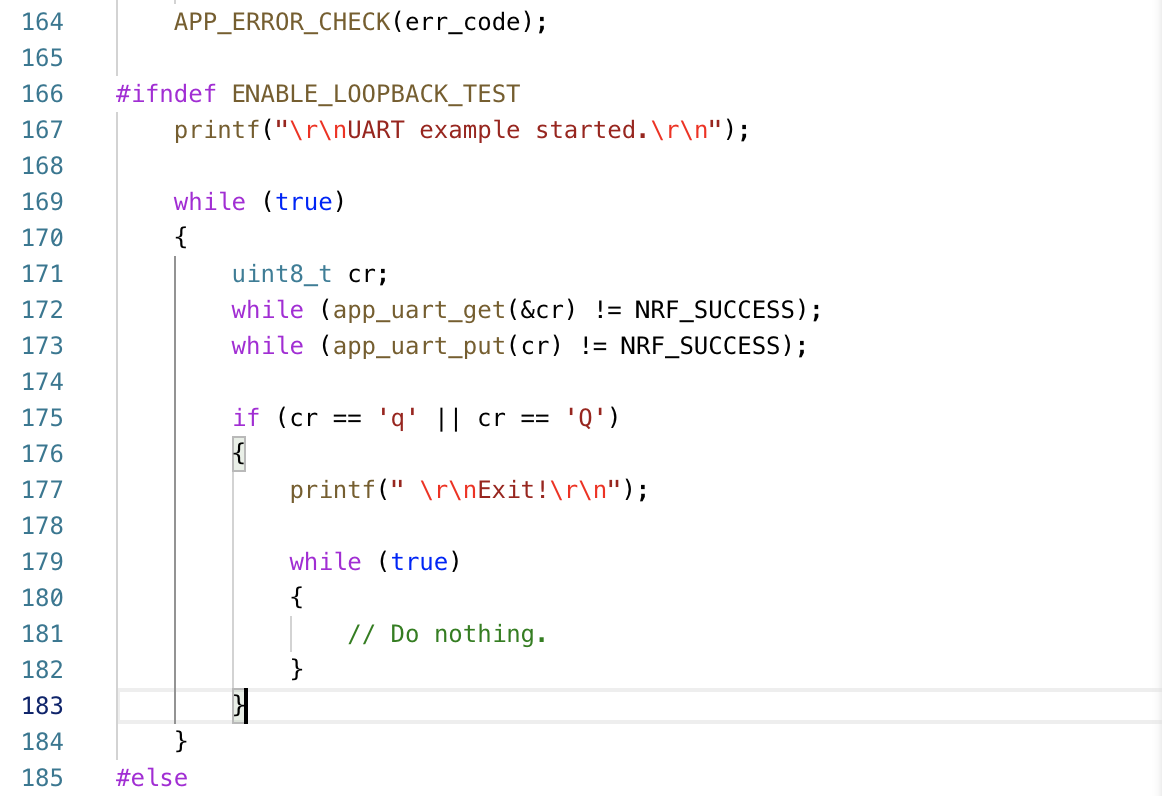
In our example program, the code in main.c at line 175 checks the character sent from the UART to see if it matches the q or Q character:
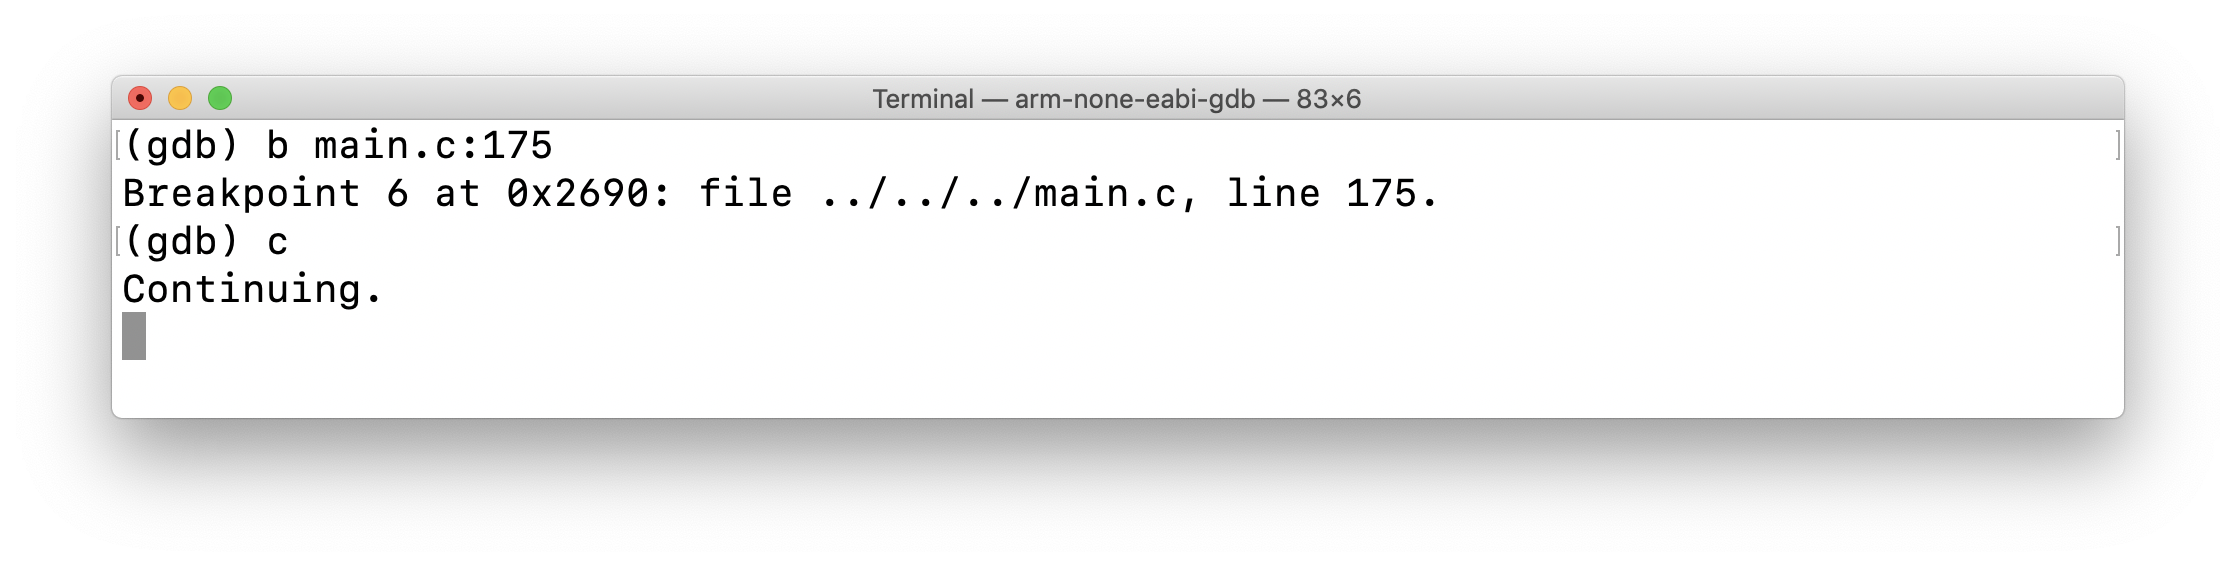
We can set a breakpoint that only stops the program if we receive a specific character (other than q or Q), for example: s.
(gdb) b main.c:175 if cr == 's'
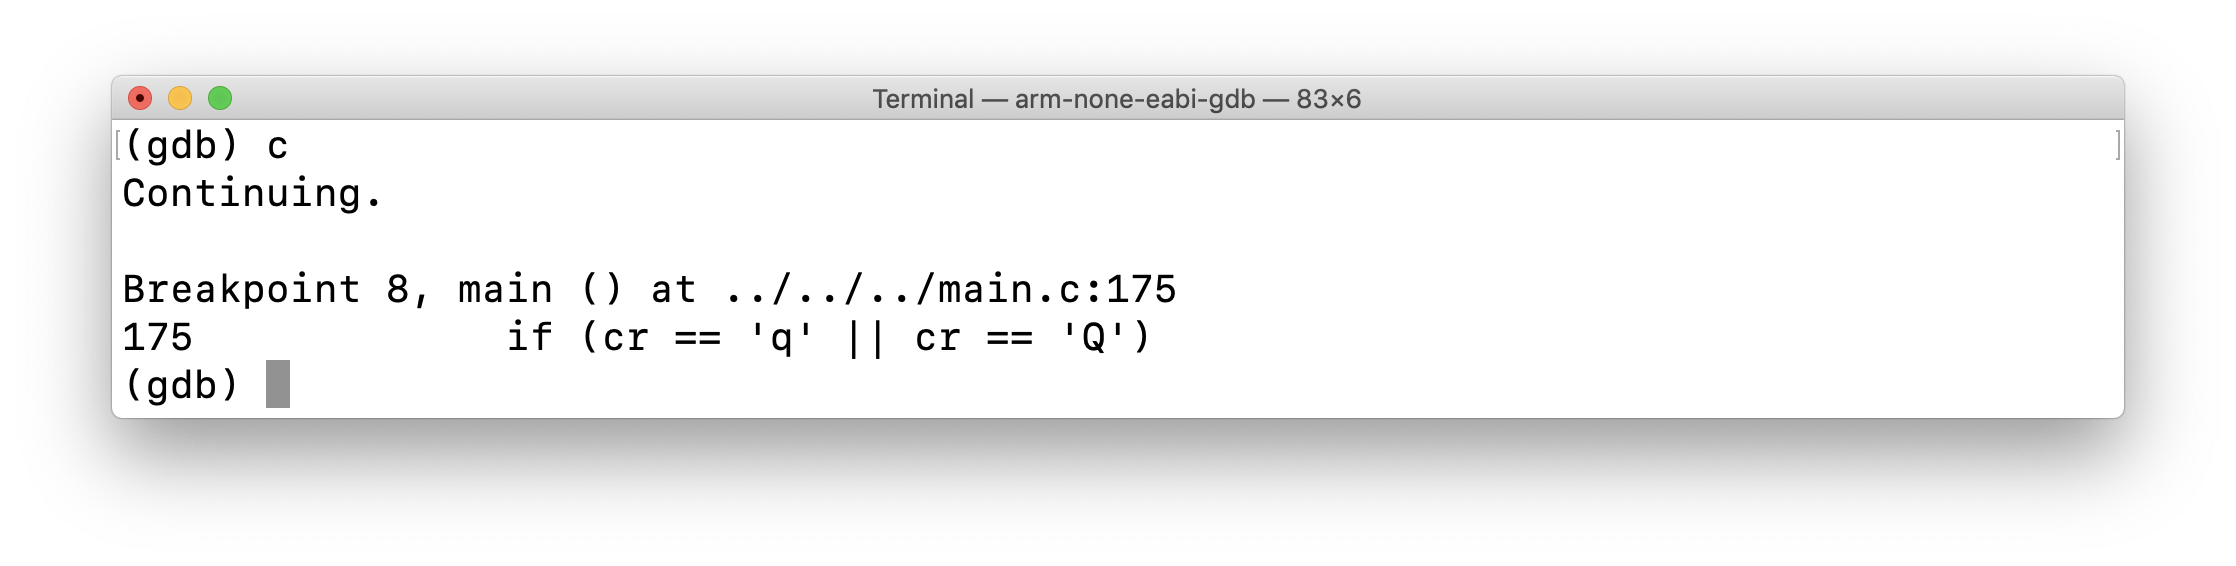
Now, if we set this breakpoint, we can run the program as normal and then type the character s in the CoolTerm program to send this character to the nRF52 chipset.
We’ll see that the application halts only if that character is sent across the UART.
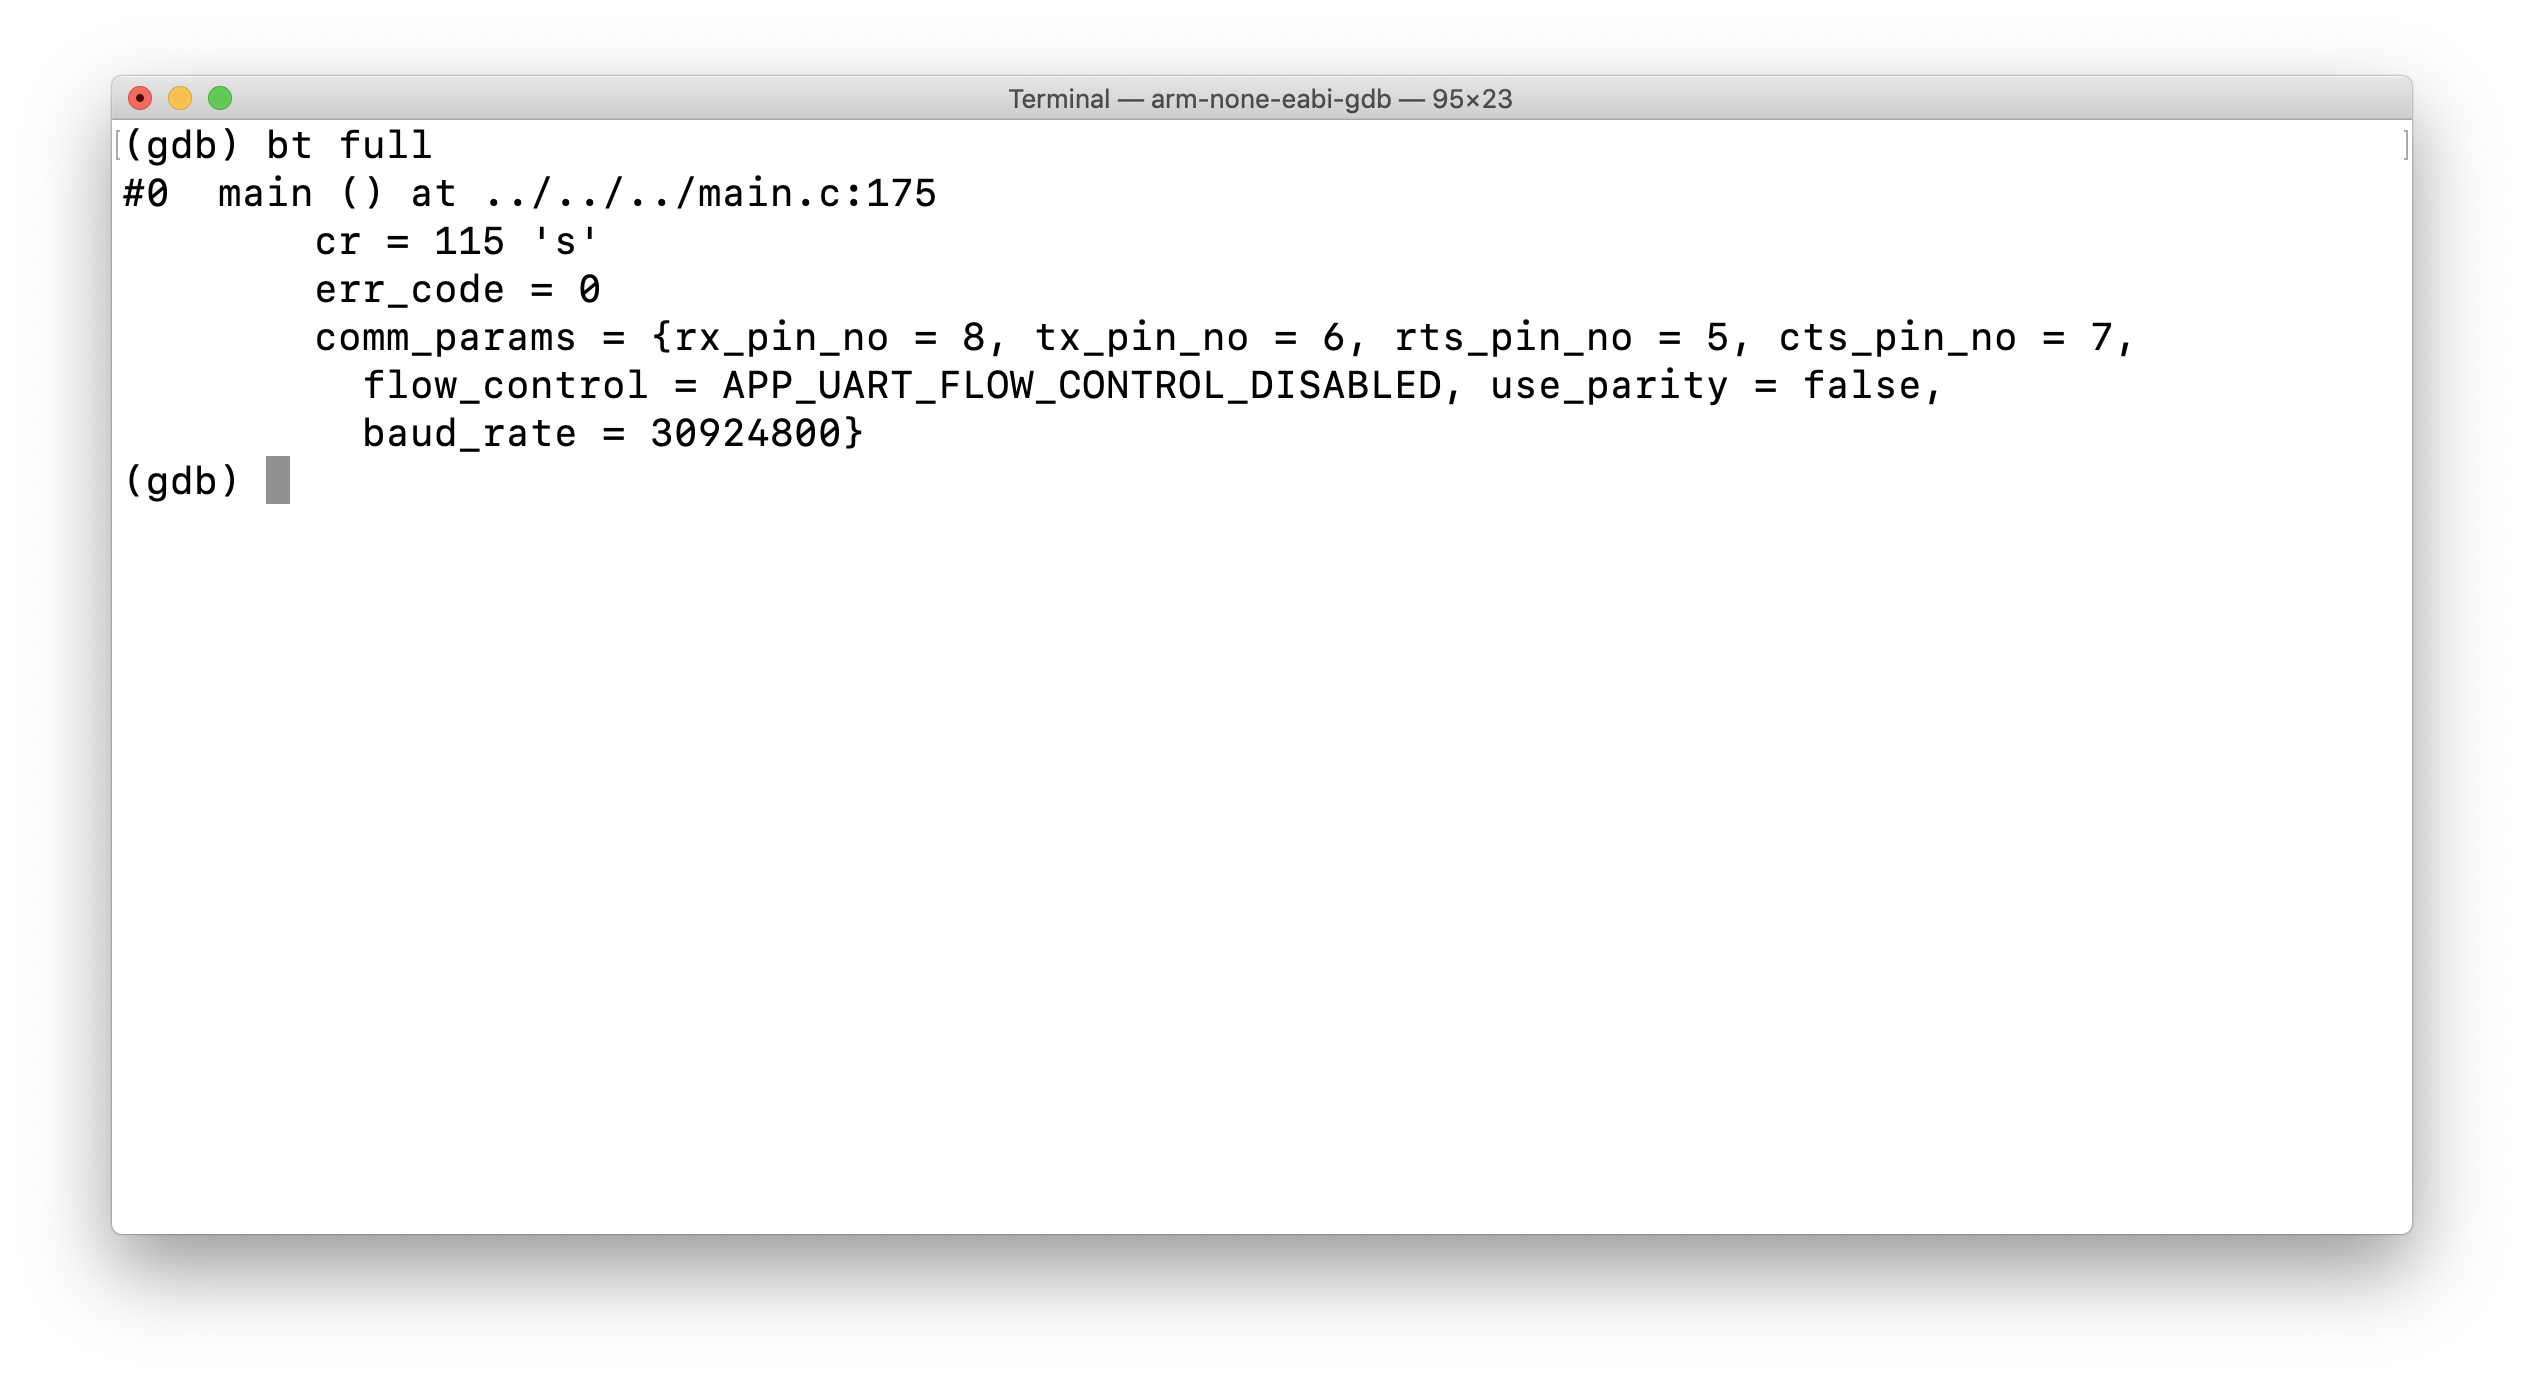
Backtrace
The Backtrace command is used to show the call stack of the program at the current Program Counter (PC). In simple terms, it shows you a summary of how your program got to where it’s currently at.
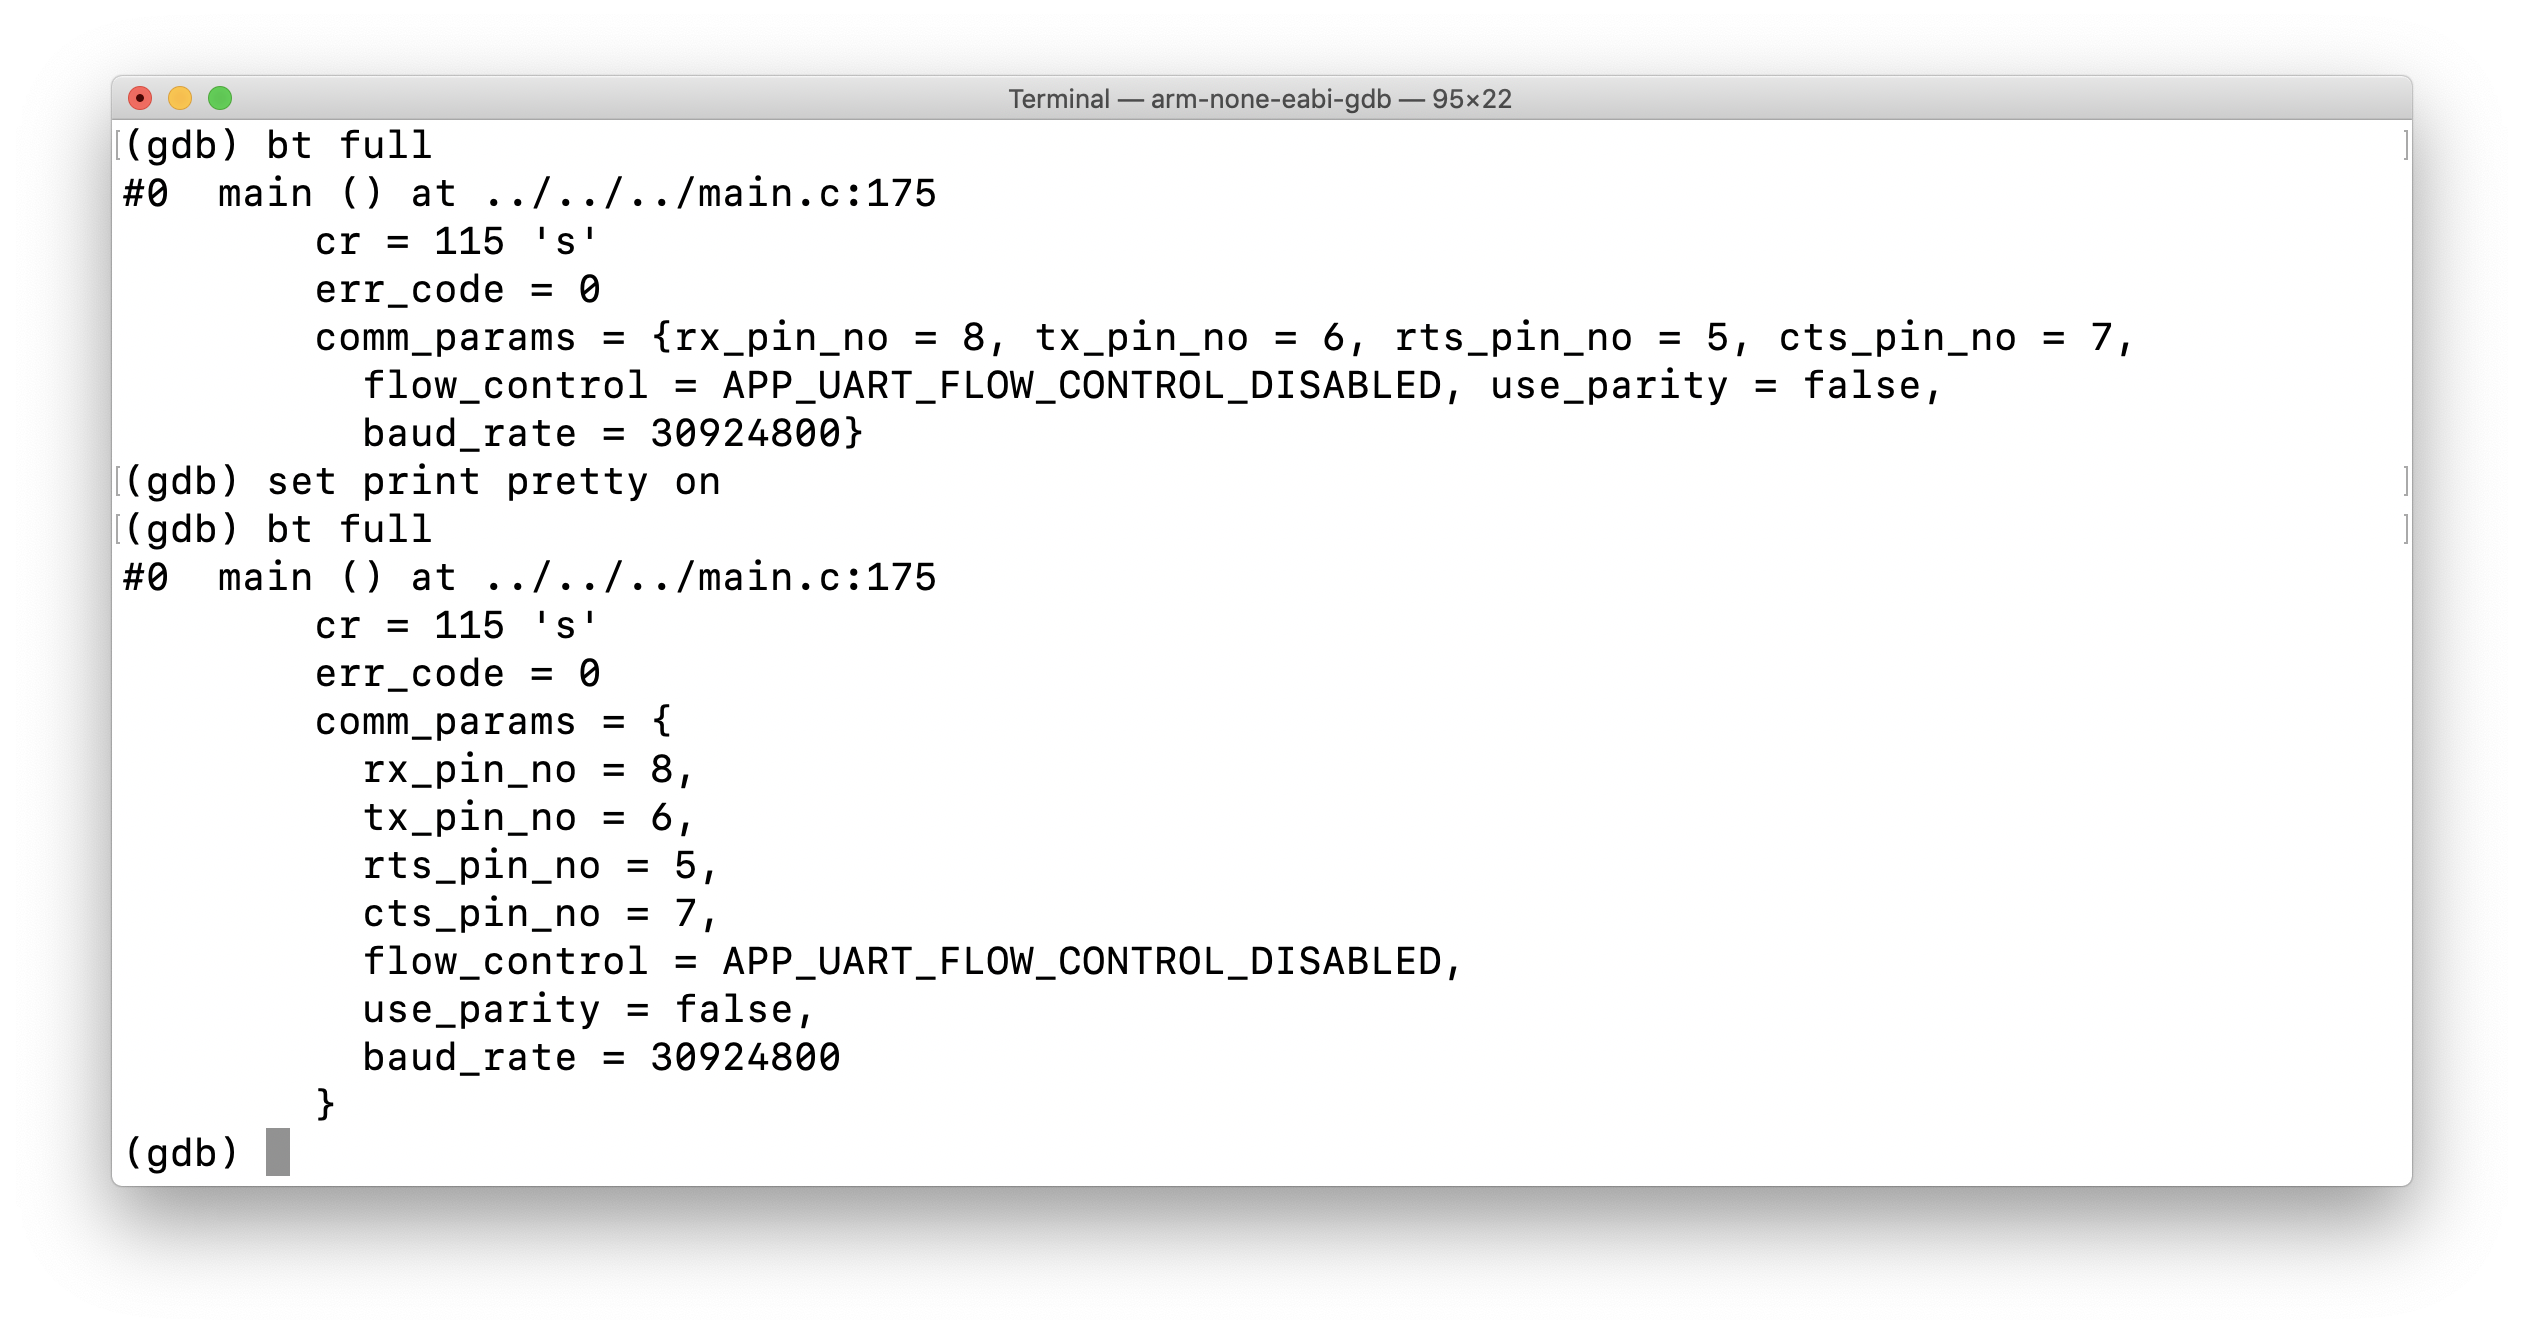
Here’s what the output of backtrace looks like when adding the “full” option to show all the local variables as well:
If you want to make it look “pretty” with some basic formatting, you could use the following command:
(gdb) set print pretty on
Here’s a screenshot showing the difference between the output with “pretty” being on or off:
Step
The Step command is used to step through and execute your source code during debugging. It will step into any function in its path, however it will not step into functions that do not contain debugging information.
For reference, here’s our code again from main.c:
Let’s take a look at how the Step command behaves after hitting the breakpoint at main.c:175 that we had set.
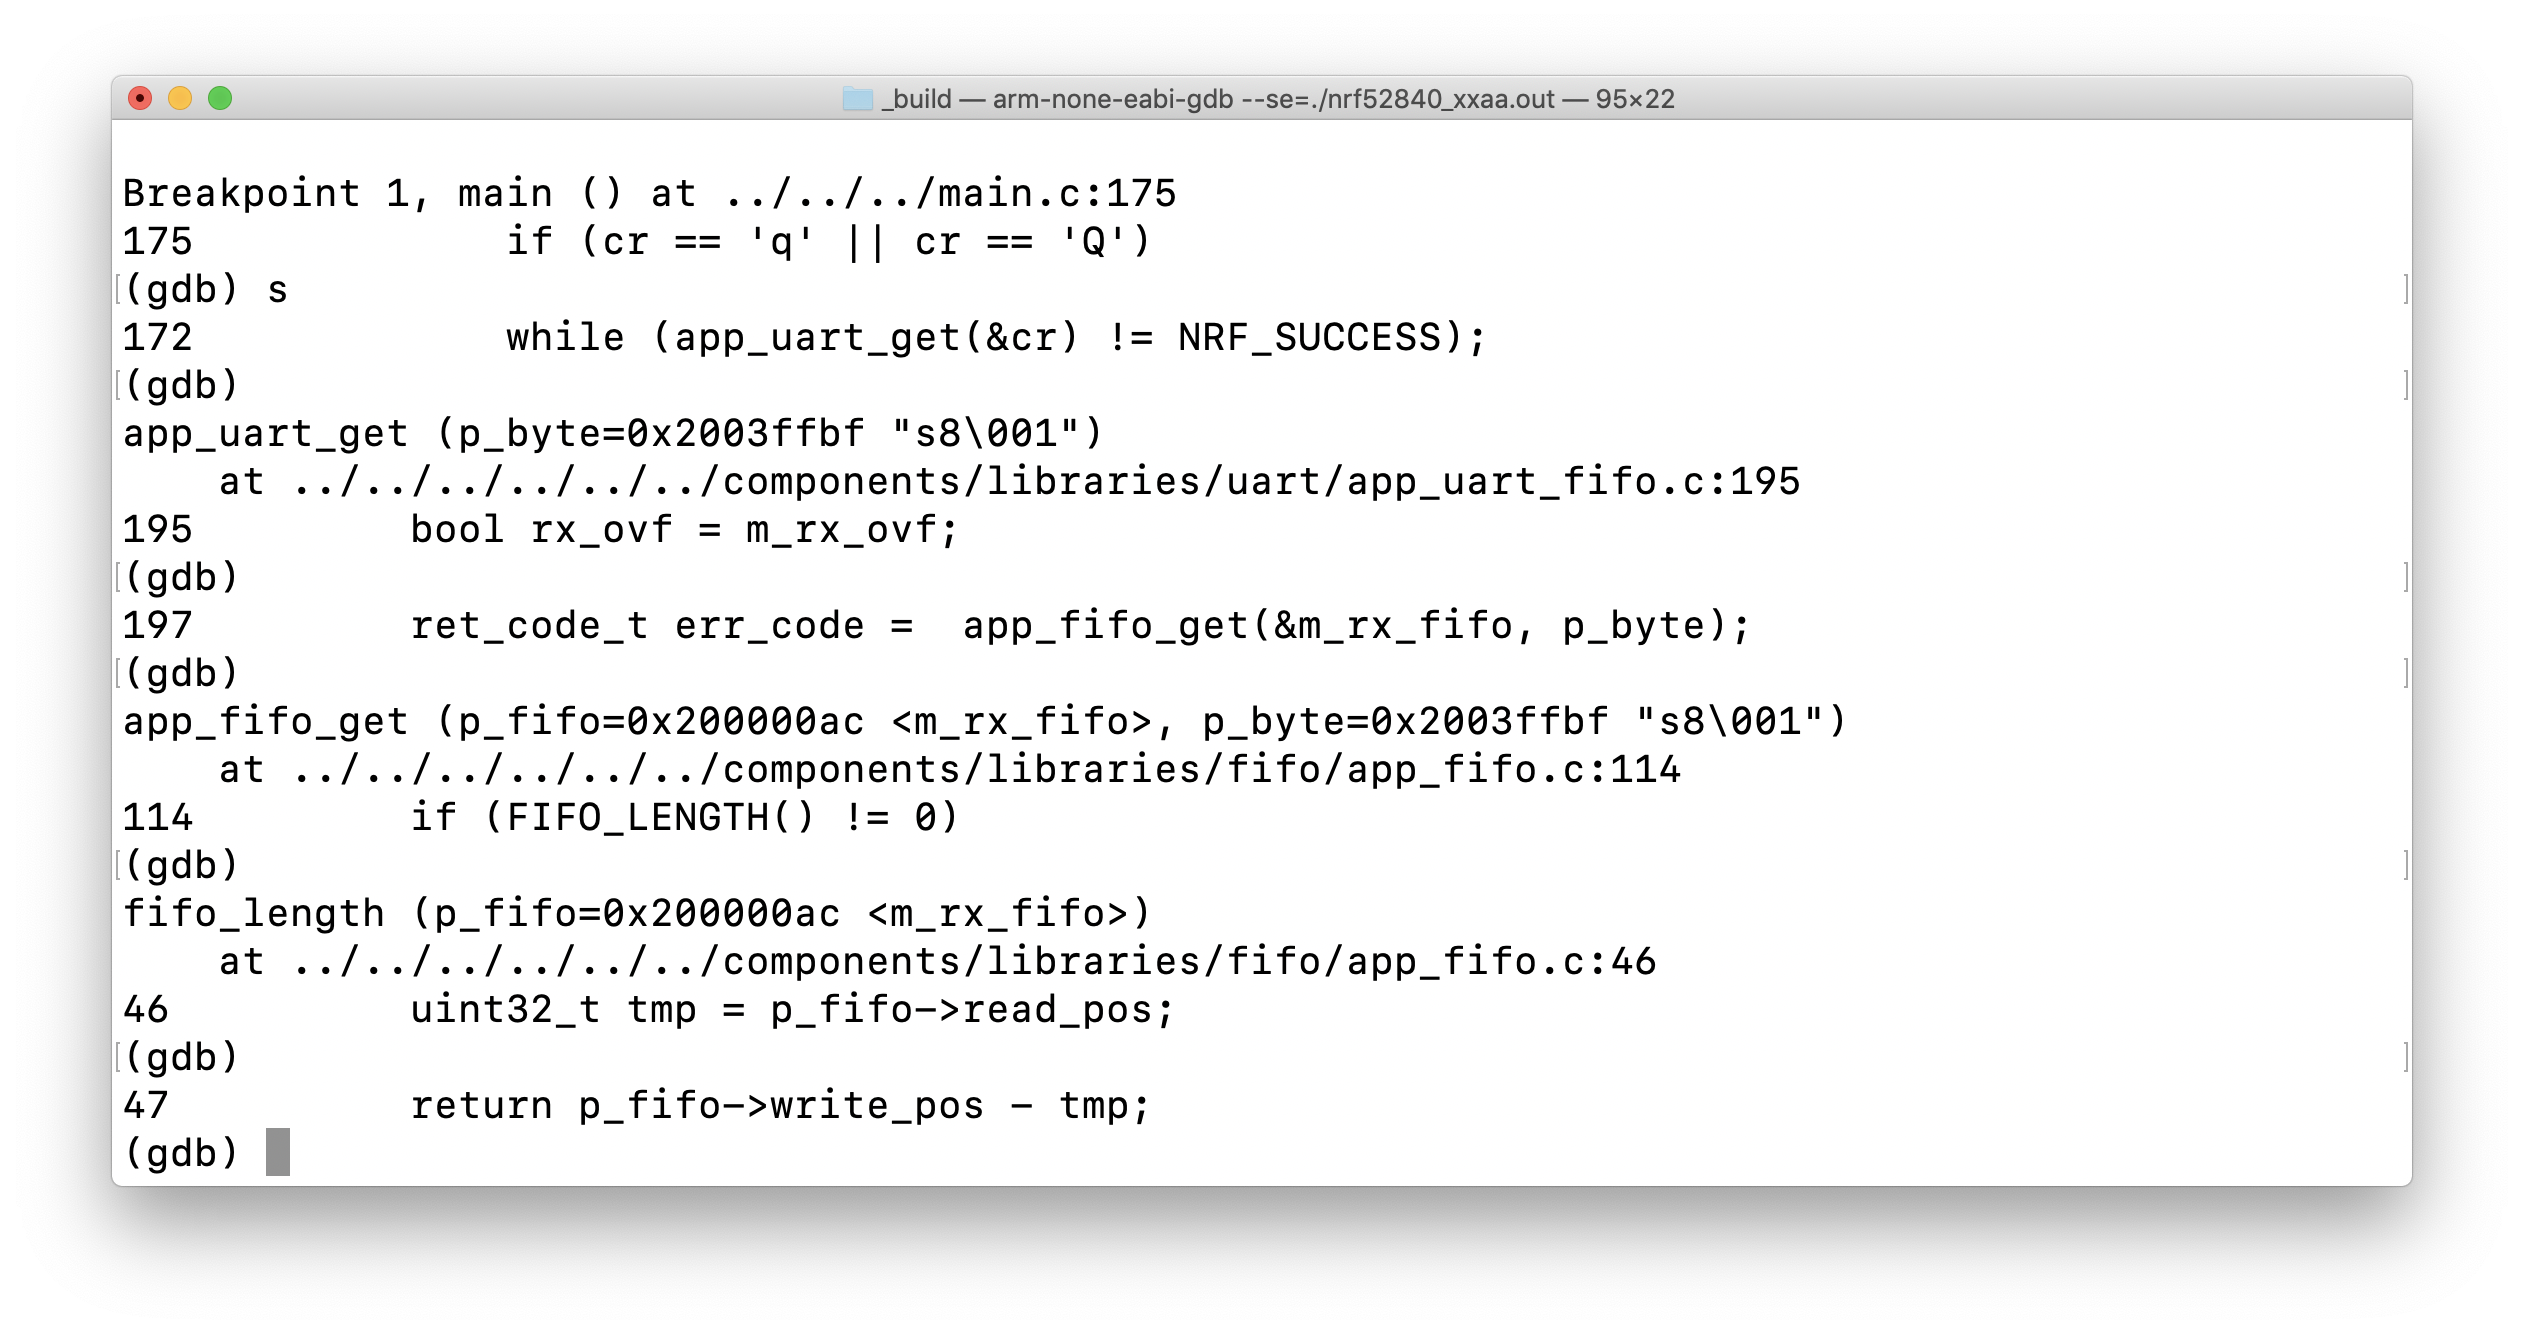
Notice that GDB stepped into the function app_uart_get() after reaching line 172.
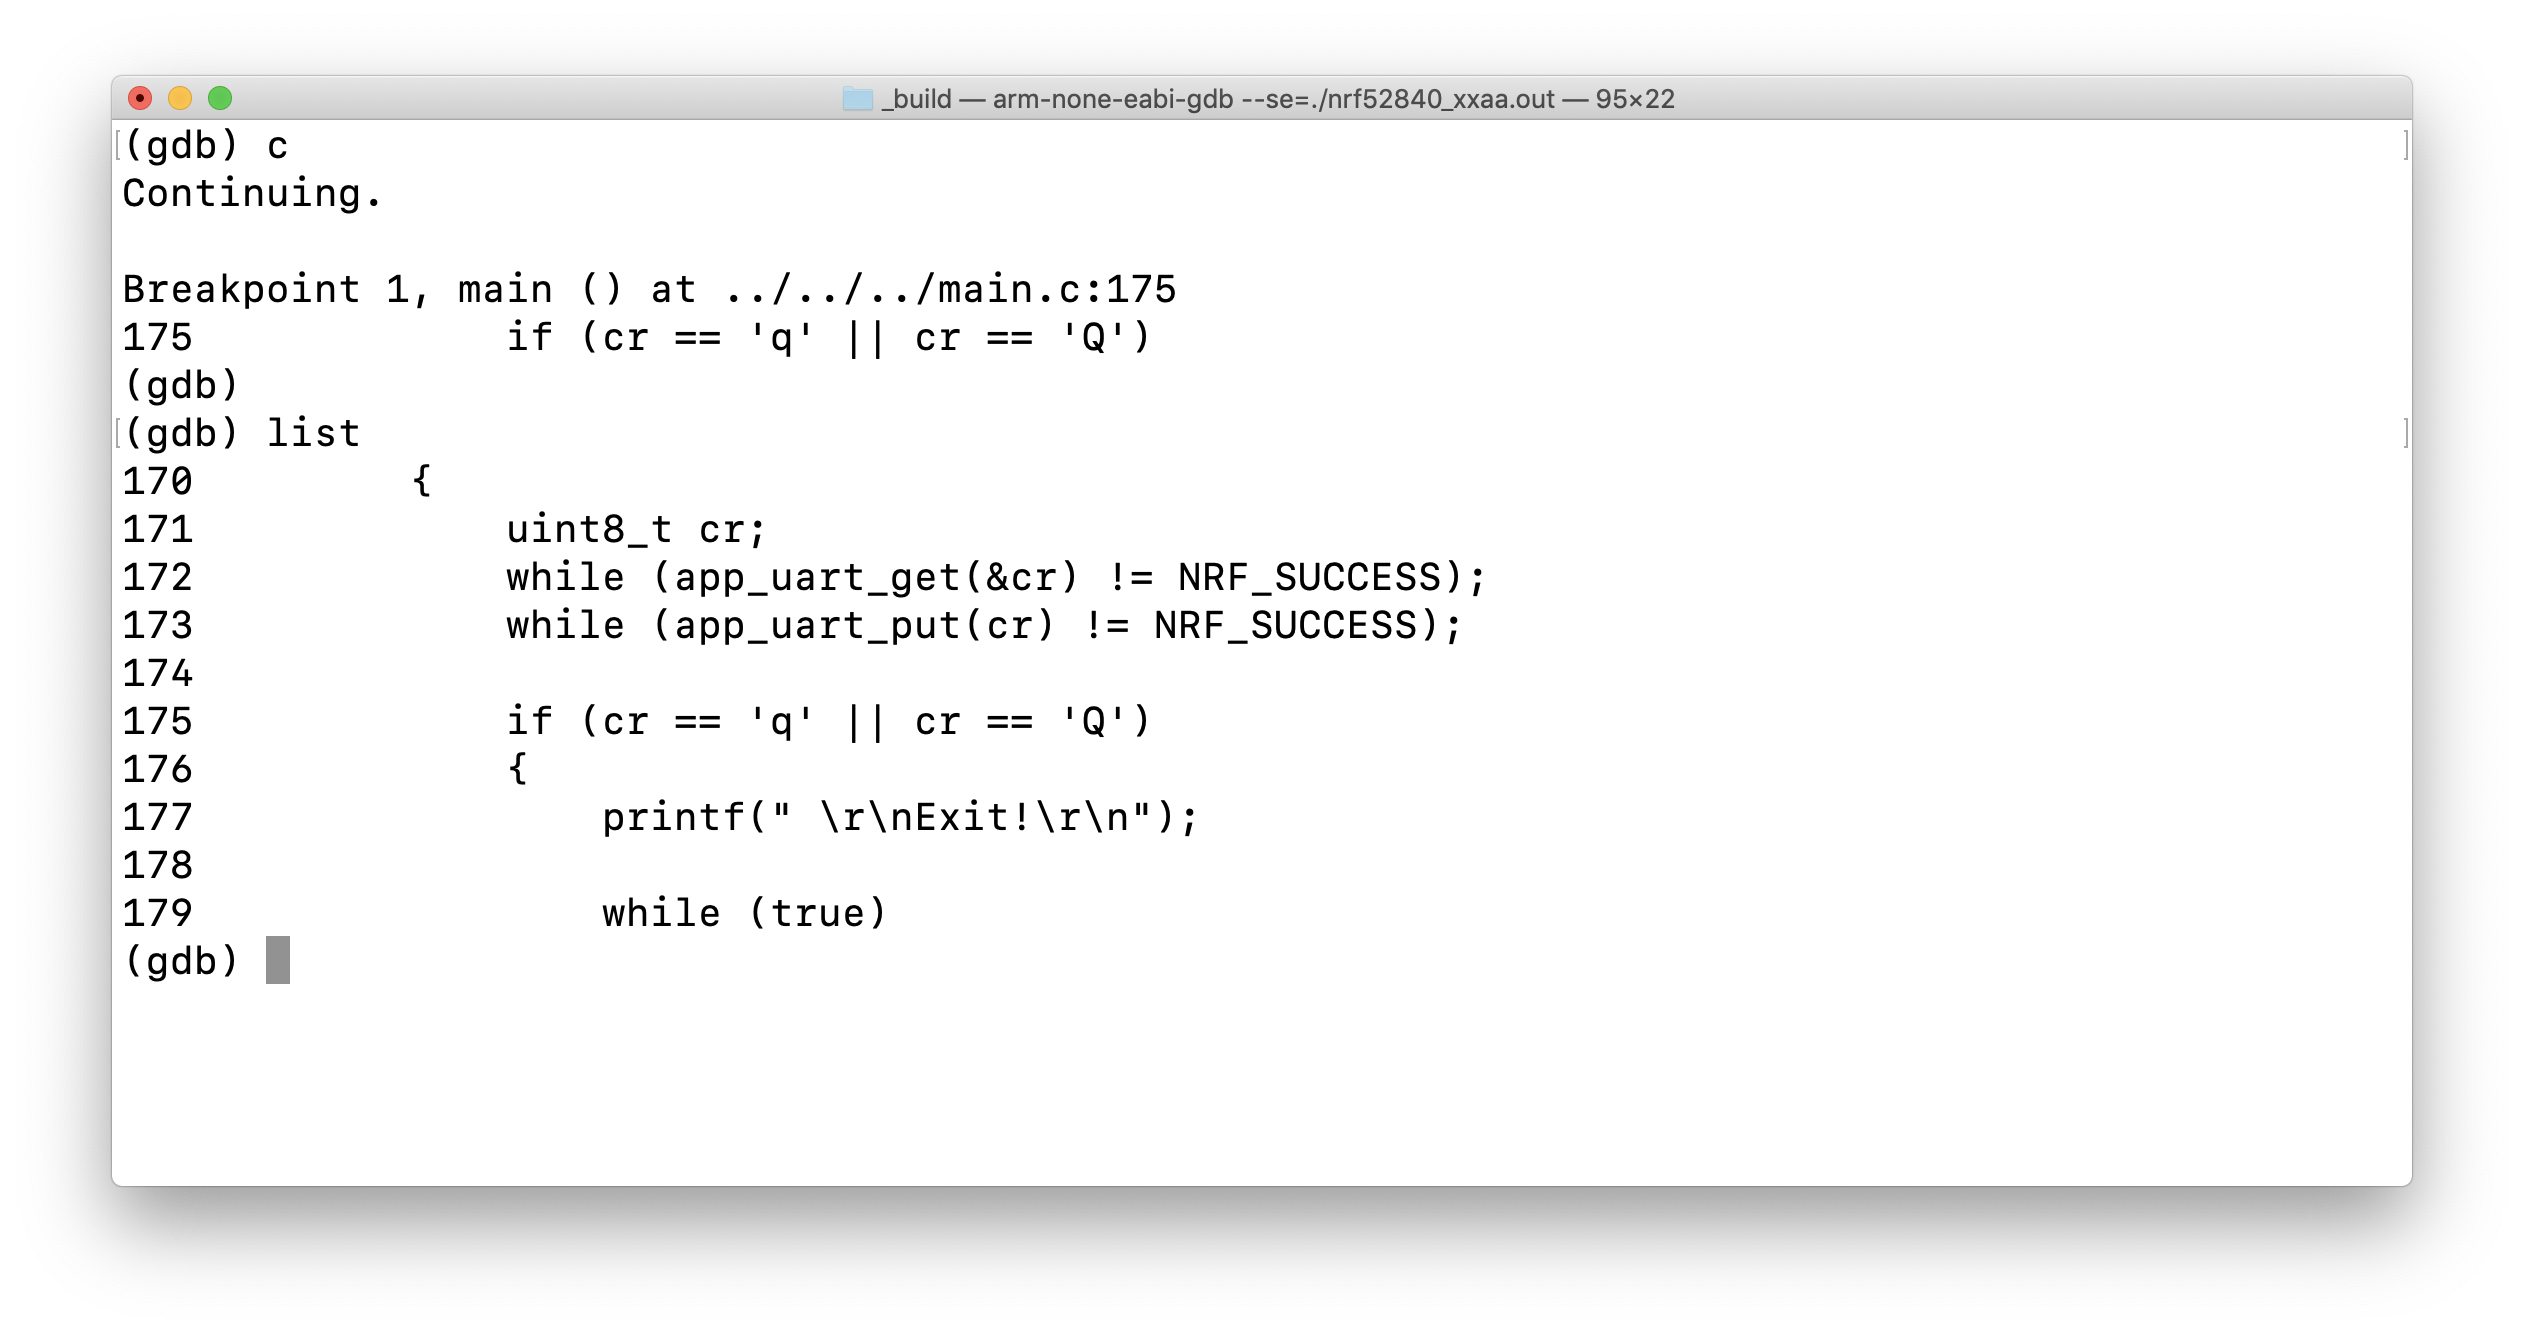
List
The List command shows the source code for the current Program Counter (PC). The default is to show the source code surrounding the location of the PC (with a few code lines before and after).
Here’s an example of using List after we hit our breakpoint at main.c:175.
Info
The Info command has many uses, but as the name implies, it is used to display more information for a specific element.
Here are some examples for uses of Info.
-
Info locals: shows information about all local variables.
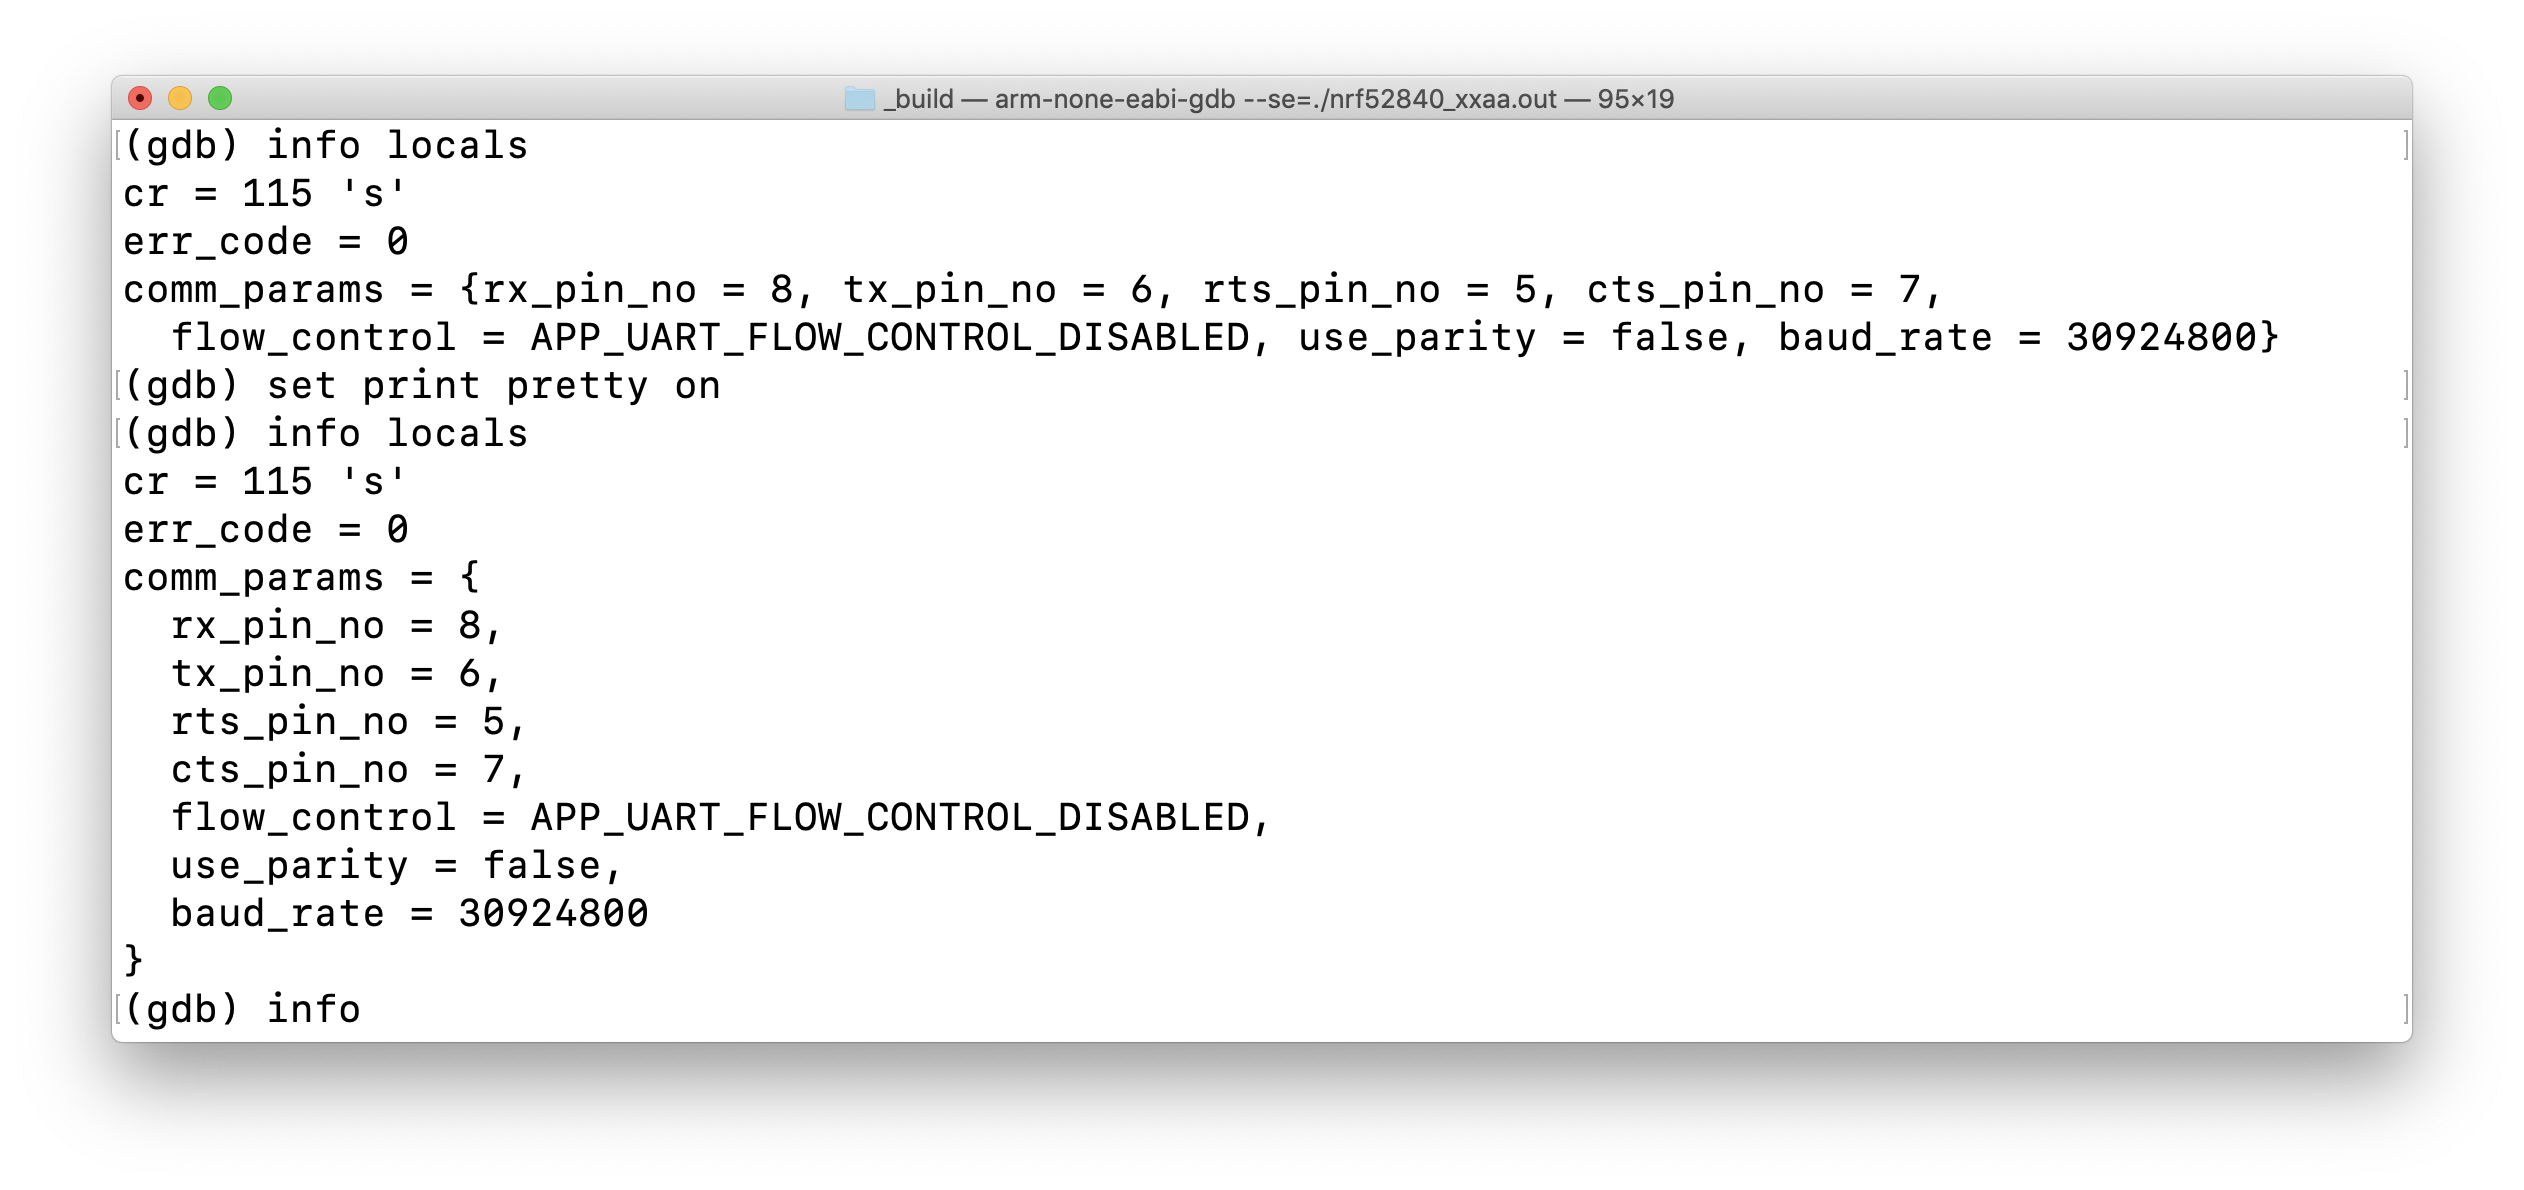
-
Info variables: shows information about all types of variables (local and global).
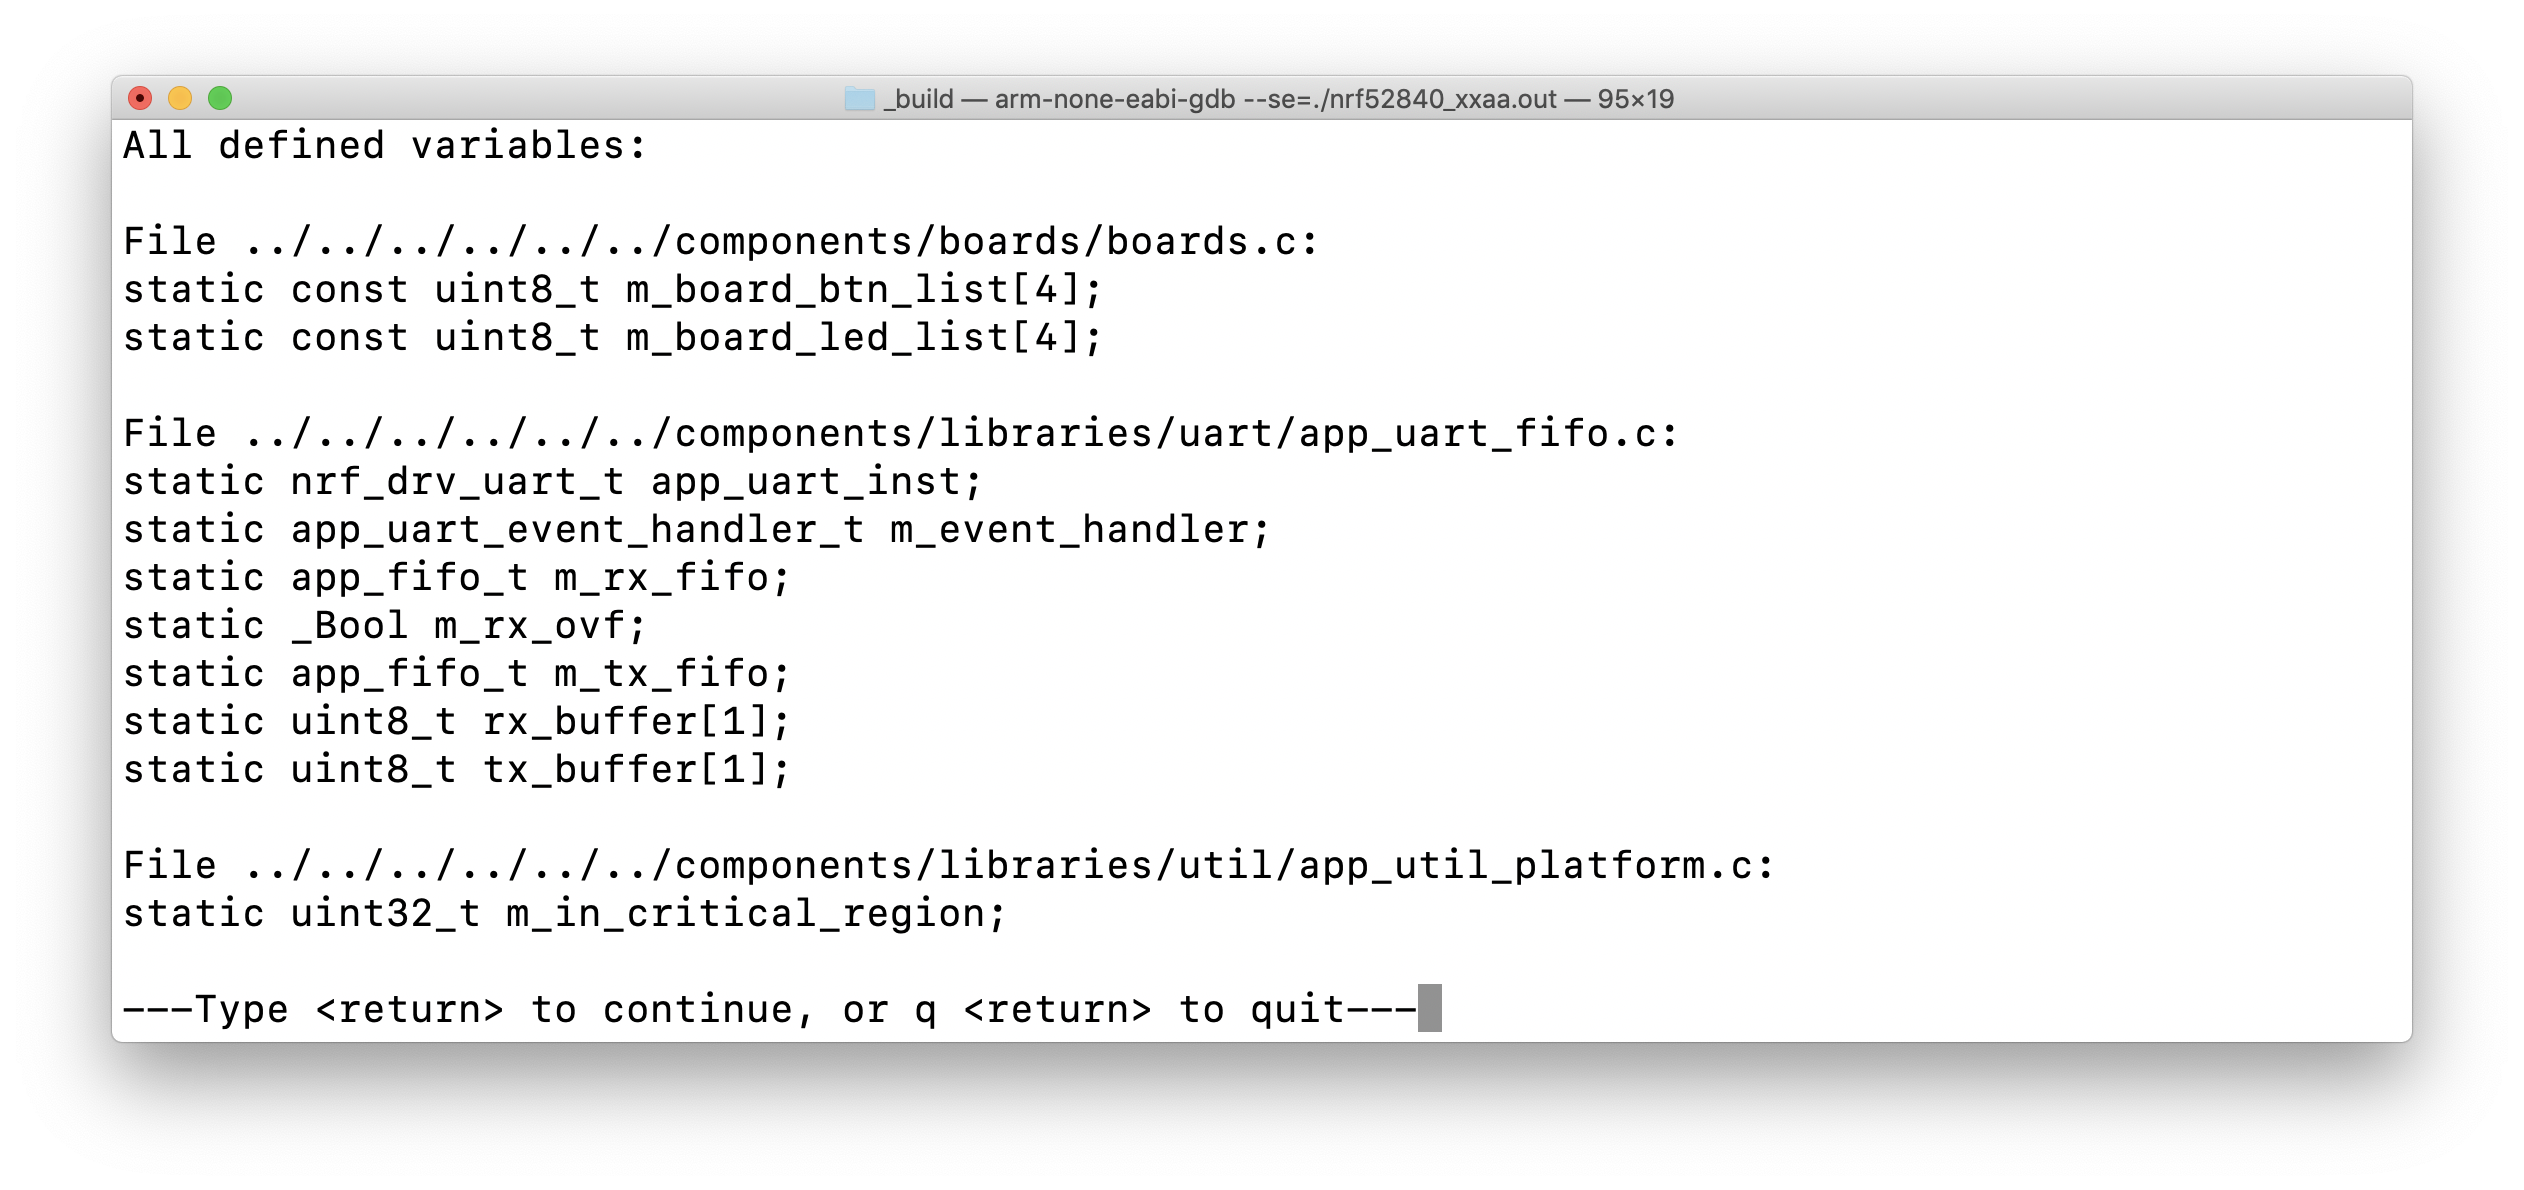
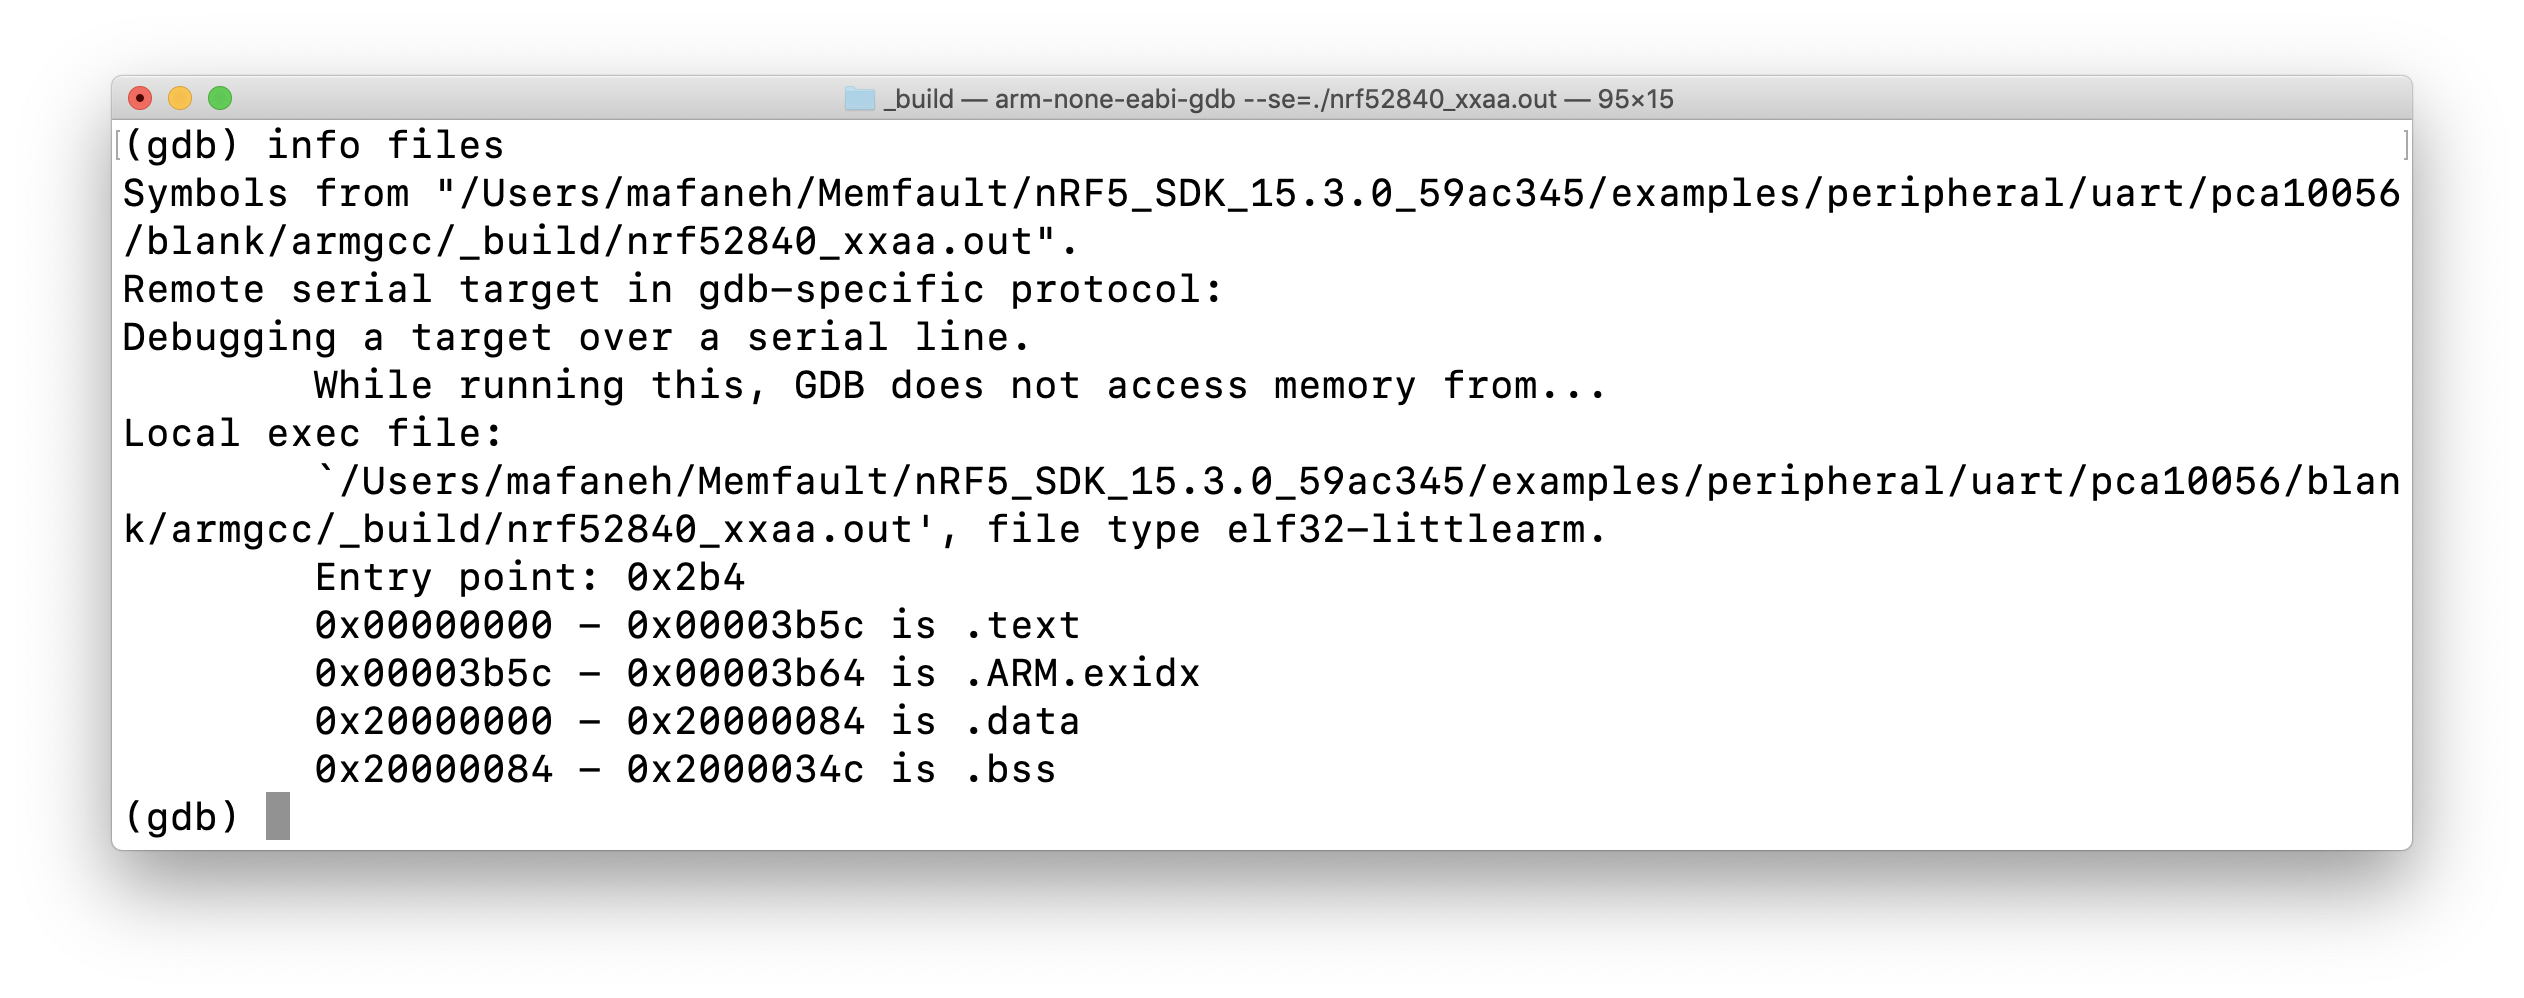
-
Info files: shows information about all files being debugged.
Logging
One useful feature within GDB is the ability to log all output to a text file. This makes it much easier to share the output of GDB with others, or to simply save the output for later reference.
It’s done as follows:
-
(gdb) set logging onto start logging -
(gdb) set logging offto stop logging - The default output log filename is
gdb.txtand it is saved to the same folder where the execution of GDB was initiated from.
Closing and Summary
We hope this post served as a good starting point for using GDB, or a refresher if you’re already familiar with the tool. GDB is a very powerful tool and has way too many functions and commands that we could cover in a single post!
Some ideas for future GDB-related posts include:
- GDB scripting and automation EDIT: Post written! - Automate Debugging with GDB Python API
- Debugging nRF5x SoftDevice-based applications
What other GDB tips and tricks do you know? Are you facing any problems or struggles with using GDB?
Let us know in the discussion area below!
Useful Resources
Finally, I’ll leave you with some useful GDB resources that I’ve referred to over the years:
 Mohammad Afaneh is the founder and CEO of Novel Bits, a company that focuses on providing comprehensive tutorials, resources, and online training for Bluetooth developers.