Logging on Embedded Devices
Logging on embedded devices comes with a host of interesting and unique challenges that aren’t found on servers — devices are generally more memory, bandwidth, space, and CPU constrained, and devices often take weeks, months, or years to update, rather than days or hours. This has interesting ramifications on how we log: we can’t log as much data as we’d want to, logs have a more finite lifespan, and the format of logs is much more permanent, so if we don’t log the right data in the right way to begin with, it can be months before we ship the next release with new logs. All that being said, there is still a lot of literature and learnings from logging on servers that we can also apply to the client side.
In this article, I discuss some of the problems I’ve encountered in producing and analyzing device logs over the years, on single digit number of devices up to hundreds of thousands, and concepts I’ve applied to manage that complexity. My background is in Android development, so some of the examples may skew towards much more powerful hardware than simple microcontrollers.
Table of Contents
Log Collection
As is common in embedded development, there are many interesting decisions to be made long before any code is actually written, or any logs actually logged. Before we can use the logs, we first need to design how the logs are stored on the device, and then how to access them.
Log Cache Size
One of the fundamental constraints to work around with device logging is how much disk space to allocate just for logging. Unlike on servers where the log cache is basically infinite (and you can often pay more for the storage), most logging systems on hardware will reserve a fixed amount of disk space in the form of a rotating buffer of logs. When you log past the limit, the logs in the oldest buffer gets written over.
The amount of disk space chosen greatly influences logging — it affects how verbose your logs can be, how long your logs are retained, what information you’ll want prioritize logging, how you’ll store the logs, and more. You’ll want to choose the maximum amount of space you can afford, where the logs you get back contain enough useful information at the timeframe of the incident. But you’ll also want to change how you log to accommodate for the amount of space, such as using an abbreviated short form instead of full words.
I’ve been lucky in that embedded Android devices are generally not very disk space constrained, so I’ve had the benefit of having 10s of MBs of logs to store (and comb) through. But even so, that would only constitute maybe 2-3 hours of logs, depending on how busy the device was, and there was a constant trade-off with how much information was being logged.
Some embedded devices might not write logs to disk at all, and instead write the logs only to memory, but still as a rotating buffer! The size of this buffer is even more constrained than on disk due to the lower amount of memory versus disk space, and there’s a downside of all the logs being cleared if the device restarts. However, this could be a useful way to mitigate concerns around flash wear if logging is a significant contributor, or if there’s no non-volatile memory on the device. But whether the logs are on disk or in memory, we still have to get access to them!
On-location vs. Remote Collection
One of my favorite often overlooked questions when you develop a new embedded device product is, “How do I get the logs off of my production device and onto my computer”? During development, this could be as easy as connecting a cable directly to the device and downloading the log files directly from the filesystem. But when the device is in the field, it’s not so simple.
I distinctly remember going out to a customer’s business and connecting to their network so I could pull logs off of a network-connected device, just to diagnose an issue they were having. This is unsustainable if you have hardware distributed across multiple locations and want to collect logs more frequently than each time you have physical access to the device.
In that case, you’ll want to build a way to upload logs to a backend somewhere, account for all the storage and privacy-related concerns and regulations, and then a way to download those logs for analysis on your computer.
Triggering Collection
Naively, the easiest way to upload logs is to have the user do it. If the device has a UI, it’s as simple as building a button for the user to click when they’re having problems — think about the “Shake to Report Feedback” or “Submit Feedback” feature on many apps. This way, you can be upfront about the data you’re collecting right at the time of collection.
Sadly, this depends on the user though, and users are notoriously unreliable. If they’re a technical user, they might not even need a UI! — they might be happy using a CLI tool instead. But if they’re non-technical, even asking them to navigate to a certain page might be a huge burden.
A simpler technical solution would be to have your devices poll periodically to see if they need to upload logs. Or, instead of polling, the devices can register for push notifications from the server using a web socket, MQTT, or equivalent, and upload the logs when it receives the push message.
The problem with using only a push or poll system to upload logs is that by the time you request the logs from the device via a push or a poll, the log cache might not contain the data from the time of the interest anymore. At a previous company, it was often the case that our log cache often only saved the last 2-3 hours of logs, so by the time our engineers were informed about an incident in the field, a day would have passed and the logs that we’d retrieve wouldn’t have any useful information from the time of the incident.
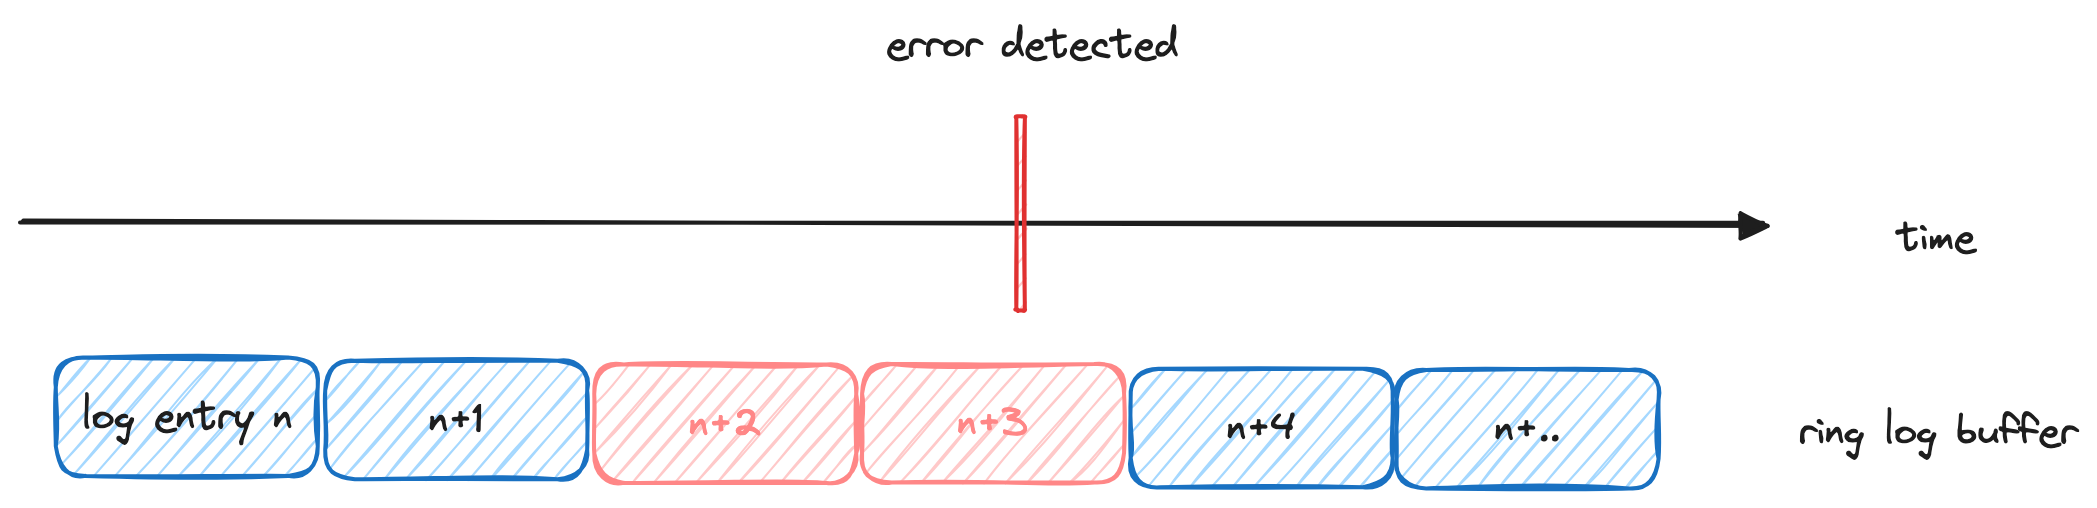
One of the cooler log collection triggers we developed here at Memfault is what I like to call “Just in time” log collection. Instead of having the user click a button or someone send a push to the device, we can automatically detect if an abnormal event happened, and then mark the log files around that time as significant, where they will then be uploaded at the next convenient moment. This allows us to capture the exact log files relevant to an incident, if we can automatically detect that abnormal event.
Logging Best Practices
Now that we’ve designed how to get the logs, we can delve into what makes a good log!
Remember Your Target Audience
It’s important to consider the target audience of your logs, especially as the use of your device grows over the years, and more people and more teams are involved in its development.
When you’re only logging for yourself, anything goes, as you’ll have all the context to make interpreting the logs easier (though you might still want to give your future self an easier time, too). But when your logs might be used by your teammates or even other teams with varying context and skills, you might want to use some strategies to make sure that the logs are also effective for them.
Make Logs Actionable
During development, we can be guilty of logging in a way that’s technically accurate rather than actionable, because we assume the eventual reader of the log will have as much context and knowledge of the domain as we do, and they’ll be able to diagnose the remedy themselves.
For example, I’m often guilty of leaving behind a bare minimum error log in certain situations like below, where it’s technically accurate but not helpful.
when (val name = reader.nextName()) {
  VERSION -> Logger.w("Invalid key: '$name'")
  else -> Logger.w("Unhandled key: '$name'")
}
Instead of only logging the technical reason for the failure, I could have added meaningful information about how to resolve the error1, which would give me context in the future about what kinds of problems could have led to this log. And the plus side is that we can give this context when we’re adding the log, while the code is fresh in our mind.
when (val name = reader.nextName()) {
  VERSION -> Logger.w(
    "Invalid key: '$name', the key should only be written, not read"
  )
  else -> Logger.w(
    "Unhandled key: '$name', is the parser version behind the writer version?"
  )
}
Adding additional context can jumpstart the debugging effort, as now the person debugging has an avenue to investigate immediately after seeing the log.
Link to Additional Documentation
It doesn’t feel right to write a paragraph in the log, but it can often take a few sentences to explain the logged error.
try {
  // ...
} catch (e: RemoteException) {
  Logger.w("Unable to connect to Reporter, this happens if Reporter is so old that it does not contain the Service at all.", e)
}
Instead of logging a large paragraph, we can log a reference link to somewhere else where the paragraph is written. This is similar to how SDKs will also contain a glossary of all the exceptions it may throw, what each error means, and documentation on how to resolve each one. We can apply that same logic with our own logging.
try {
  // ...
} catch (e: RemoteException) {
  Logger.w("[REPORTER_SERVICE_NOT_FOUND] Unable to connect to Reporter", e)
}
A comment is often sufficient, but for target audiences that might not have access to the project source code, it can also be added to an external page in a much more human-readable format for others to use.
REPORTER_SERVICE_NOT_FOUND
  * Reason: This can happen if Reporter is so old that it does not contain the Service at all
  * Steps to fix: Update the Reporter application
Improve Readability
One of the biggest difficulties of logging is that there’s often so much of it! On Android, you’re especially susceptible to the verbosity of whatever the OS is already logging for you, when sometimes you only care about a certain event during your investigation.
2012-12-21 14:00:05.000119000 +0000  1000  1369  1505 I InputReader: Reconfiguring input devices ...
2012-12-21 14:00:05.000119000 +0000 u0_a5  2505  2505 V bort    : Network connection established!
2012-12-21 14:00:05.000119000 +0000  1000  1369  1442 W VoiceInteractionManagerService: no available ...
2012-12-21 14:00:05.000119000 +0000  1000  1369  1369 I Telecom : DefaultDialerCache: Refreshing default dialer ...
2012-12-21 14:00:05.000119000 +0000  1002  1542  1542 D Avrcp   : isBrowsableListUpdated: false
2012-12-21 14:00:05.000119000 +0000  1002  1542  1542 V NewAvrcpMediaPlayerList: mPackageChangedBroadcastReceiver: ...
2012-12-21 14:00:05.000119000 +0000  1002  1542  1542 D NewAvrcpMediaPlayerList: Name of package changed:  ...
2012-12-21 14:00:05.000119000 +0000  1000  1369  1682 D PackageManager: Instant App installer not found with ...
2012-12-21 14:00:05.000119000 +0000  1000  1369  1682 D PackageManager: Clear ephemeral installer activity
2012-12-21 14:00:05.000119000 +0000 u0_a5  2505  2505 V bort    : Lost network connectivity!
In the example above, we only wanted to see Bort’s “Network connection established!” and “Lost network connectivity!” events, but it’s visually difficult to dig out from the noise of the rest of the logs. There are a few simple techniques that can immediately improve the readability of your logs.
Consistent Formatting
One way to make it more readable is to log in a more consistent format. When logging state, you should log in a consistent key-value format so that the information is more visibly related.
V bort    : Network connected: true
W VoiceInteractionManagerService: no available ...
I Telecom : DefaultDialerCache: Refreshing default dialer ...
D Avrcp   : isBrowsableListUpdated: false
V NewAvrcpMediaPlayerList: mPackageChangedBroadcastReceiver: ...
D NewAvrcpMediaPlayerList: Name of package changed:  ...
D PackageManager: Instant App installer not found with ...
D PackageManager: Clear ephemeral installer activity
V bort    : Network connected: false
This allows you to more easily filter by just the lines containing the “Network connected” string via grep, CTRL+F, or other text search tool (I use a plugin in Visual Studio Code).
V bort    : Network connected: true
V bort    : Network connected: false
Session IDs
For complex operations with lots of related logging, it can make sense to take a page out of server-side best practices, and log a session ID during the entire series of operation, which makes it easy to track information that should be correlated together.
V bort    : Payment started: payment_session_id=0xFF
W VoiceInteractionManagerService: no available ...
I Telecom : DefaultDialerCache: Refreshing default dialer ...
D Avrcp   : isBrowsableListUpdated: false
V bort    : Awaiting response: payment_session_id=0xFF
V NewAvrcpMediaPlayerList: mPackageChangedBroadcastReceiver: ...
D NewAvrcpMediaPlayerList: Name of package changed:  ...
D PackageManager: Instant App installer not found with ...
D PackageManager: Clear ephemeral installer activity
V bort    : Payment rejected 500: payment_session_id=0xFF, msg=...
With your filtering tool of choice, you can quickly filter by payment_session_id=0xFF and see only the relevant information.
V bort    : Payment started: payment_session_id=0xFF
V bort    : Awaiting response: payment_session_id=0xFF
V bort    : Payment rejected 500: payment_session_id=0xFF, msg=...
Uniqueness
A major impedance to reading logs is when the exact same string is re-used multiple times.
V bort : Payment started: payment_session_id=0xFF
fun startPayment() {
    Logger.v("Payment started: payment_session_id=$id")
    // ...
}

fun retryPayment() {
    Logger.v("Payment started: payment_session_id=$id")
    // ...
}
If you see this log while you’re trying to diagnose an issue, you will probably have no clue which line of code it’s actually referring to. So it’s important to spend the extra time to make sure that all our logs are unique from one another.
Log for Computers First
We’ll never really stop reading logs, but it can become a chore to read 1000s of lines of logs, or look to see if multiple sets of logs from multiple devices may be experiencing the same issue. One of the best ways to get out of the business of reading logs, is to have our computers read it for us, and display it in a more digestible format.
At my past companies, we developed shared command line tools that would read log files and print out a text summary of all the exceptions, any network connectivity issues detected, and various other useful information. The benefit of this was massive; not only did the tool analyze logs much faster than we could individually, but having a shared solution meant everyone benefited from the time savings, we all agreed upon the interpretation of different log messages, and we could add new features to the tool as the team grew and new scenarios were discovered.
To facilitate that more easily, it would’ve helped if we could rely on the format of logs to be much more machine-readable.
Avoid Multiline Logs
Multiline logs are a particularly painful problem for computers to parse. Most systems expect logs to all be on a single line, and tracking logs across multiple lines requires retaining the state specific to that error message just to parse that error.
E bort    : Network error: -55
E bort    :     RSSI: 61
E bort    :     SSID: "Home-Guest"
On one line, it’s slightly less visually readable but vastly more easily machine parsable.
E bort : Network error: -55, RSSI: 61, SSID: "Home-Guest"
Structured Logs
We can take another page out of server logging best practices, and use structured logging. Logs by default are unstructured strings. If we logged more often in a structured format that was easily machine parsable, we could greatly simplify parsing and organizing the data. This is especially useful when we want to eventually parse specific information in the log, otherwise we’d have to write a Regex to parse the log.
E bort : {"Network error": "-55", "RSSI": 61, "SSID": "Home-Guest"}
JSON is the most common format for structured logs, and can be written manually in code fairly quickly. It’s also fairly readable compared to the unstructured log, too.
Just watch out for your platform’s maximum line length (Android’s logcat truncates lines at 4096 characters). Some languages, like Go, even have structured logging built into their standard library!
Skip Log Reading – Build Visualizations!
Ideally, the end state of logging is to never read the raw logs ourselves. Once we can empower computers to read all sorts of logs, we can build the tools to parse and then visualize the information, and save ourselves the effort of piecing together all the information in our head.
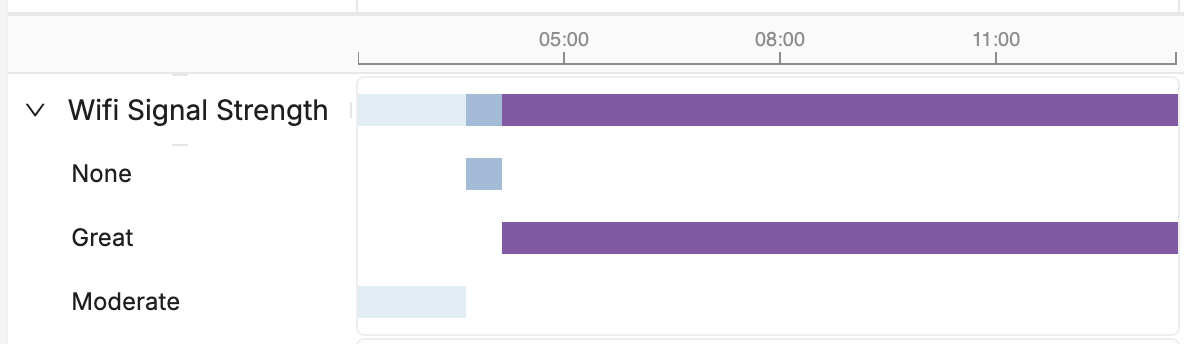
Here, instead of manually tracking each Wi-Fi connection and signal strength log over time, we can create a visualization for it and instantly understand the timing involved.
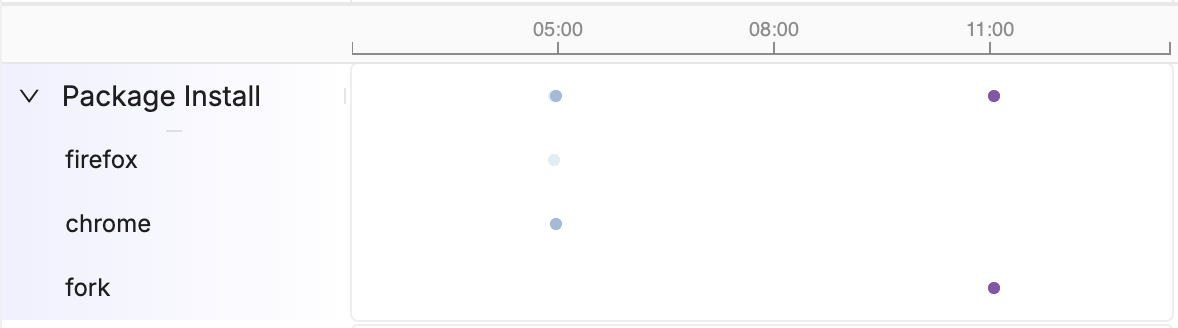
Or here, instead of scanning the logs to see when and which package was installed, we can automatically parse the logs and create a visualization.
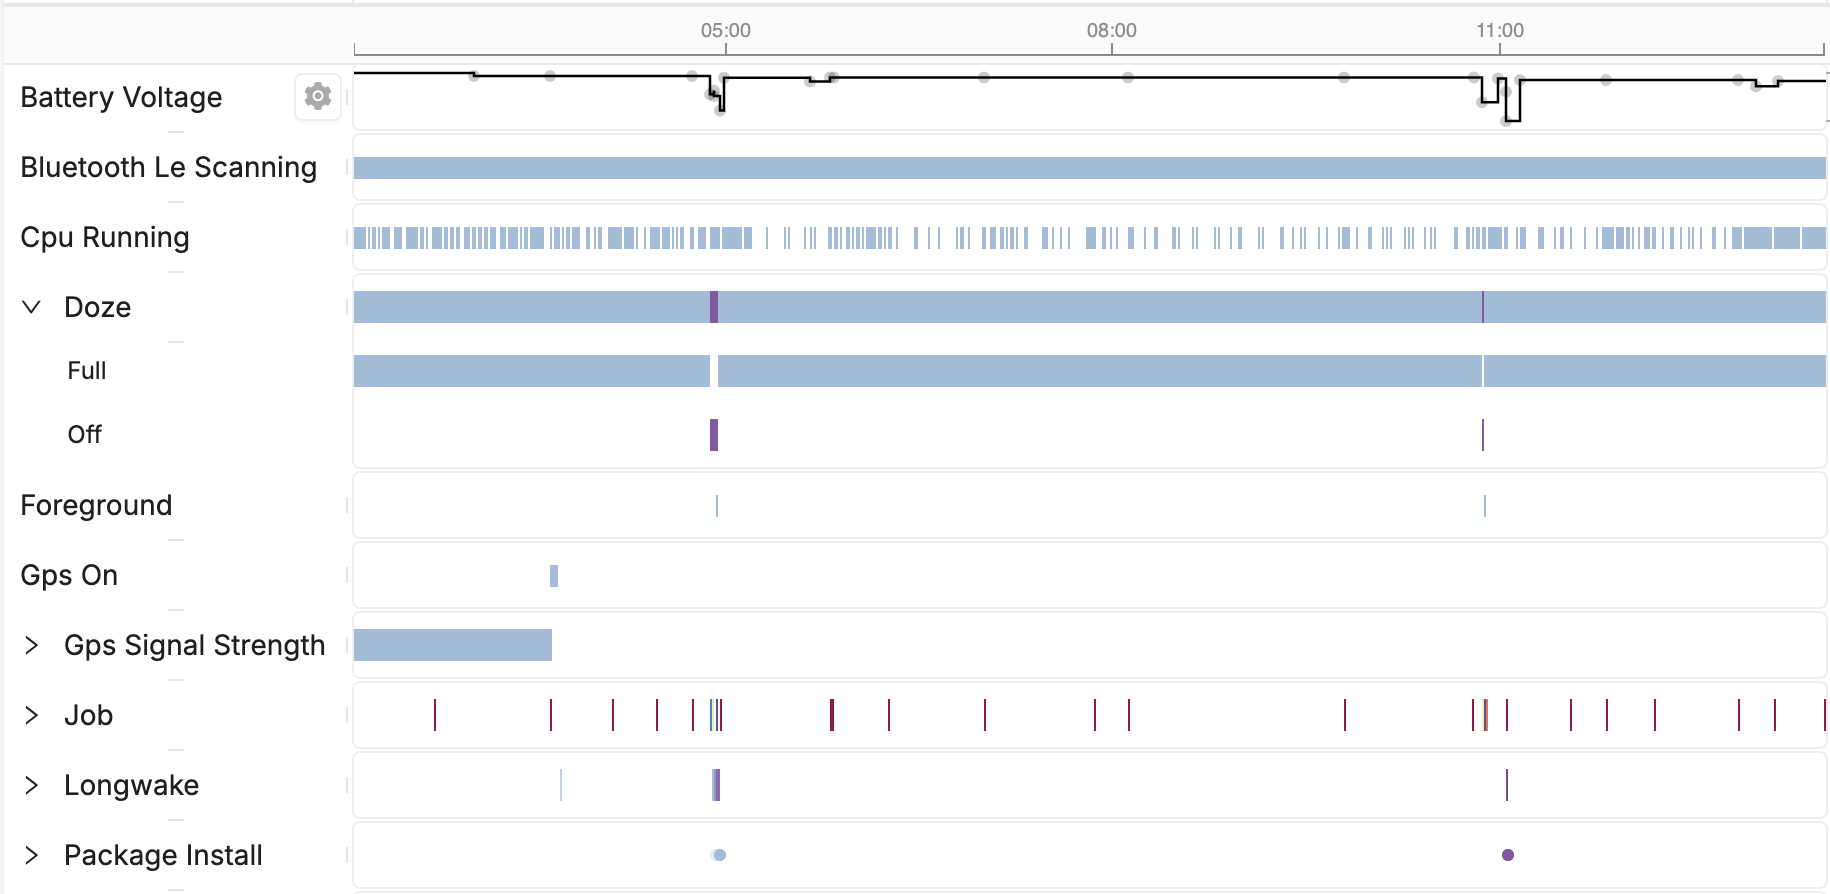
Once we’ve collected enough data, we can plot all the logs as events on a timeline, which allows us to make correlations instantly that we’d have to read logs to maybe get. In the above example, we can see the package installation correlated to doze being disabled, an app being foregrounded, and a drop in battery voltage, all correlations we can make instantaneously.
If this sounds familiar, this is a pitch for Memfault! Instead of reading logs, we can acquire a lot of the same data that the log would have produced, and then display it on a browsable timeline in extremely high resolution.
Conclusion
Logging is a fundamental part of our day-to-day debugging toolset, and it’s hard to imagine it ever going away entirely. But we all agree, there is a lot of noise in our logs, there are really no standards for logging, and there’s a lot we could probably improve how we log, if we only had the time. Hopefully I’ve shared some new or helpful ideas around logging that you can put to use today!
See anything you'd like to change? Submit a pull request or open an issue on our GitHub
Additional Reading
- Logging v. instrumentation
- Tracing: structured logging, but better in every way
- Debugging Android Devices
References
 Victor Lai is an Android solutions architect at Memfault.