Tools for Firmware Code Size Optimization
Every firmware engineer has run out of code space at some point or another. Whether they are trying to cram in another feature, or to make enough space for A/B firmware updates more code space is always better.
In this series of posts, we’ll explore ways to save code space and ways not to do it. We will cover compiler options, coding style, logging, as well as desperate hacks when all you need is another 24 bytes.
But first, let’s talk about measuring code size.
Table of Contents
Why measure?
Optimization is often counter intuitive. Don’t take my word for it: this is one of the topics Microsoft’s Raymond Chen and Unix programmers agree on!
So before you do anything, measure where your code size is going. You may be surprised!
Measuring overall code size
The simplest way to measure code size is to inspect the different sections of
your elf file. The ARM GCC toolchain comes with a handy utility to do just that:
arm-none-eabi-size.
Let’s try running it on one of our ELF files:
$ arm-none-eabi-size build/with-libc.elf
   text    data     bss     dec     hex filename
  10800     104    8272   19176    4ae8 build/with-libc.elf
So in this program we have:
- 10800 bytes of
text, which is code - 104 bytes of
data, which is statically initialized memory - 8272 bytes of
bss, which is zero-initialized memory
Unfortunately, the output of this tool is a little misleading. You may think
that your program will occupy 10800 bytes of flash, but this is not the case.
Indeed if we modify our linker script to specify that our flash size is 10800 exactly:
diff --git a/with-libc/samd21g18a_flash.ld b/with-libc/samd21g18a_flash.ld
index a07cc82b..f49e73e2 100644
--- a/with-libc/samd21g18a_flash.ld
+++ b/with-libc/samd21g18a_flash.ld
@@ -3,7 +3,7 @@ OUTPUT_ARCH(arm)

 MEMORY
 {
-  rom      (rx)  : ORIGIN = 0x00000000, LENGTH = 0x00040000
+  rom      (rx)  : ORIGIN = 0x00000000, LENGTH = 10800
   ram      (rwx) : ORIGIN = 0x20000000, LENGTH = 0x00008000
 }
We end up overflowing our flash!
$ make
[...]
/usr/local/Cellar/arm-none-eabi-gcc/8-2018-q4-major/gcc/bin/../lib/gcc/arm-none-eabi/8.2.1/../../../../arm-none-eabi/bin/ld:
build/with-libc.elf section `.data' will not fit in region `rom'
/usr/local/Cellar/arm-none-eabi-gcc/8-2018-q4-major/gcc/bin/../lib/gcc/arm-none-eabi/8.2.1/../../../../arm-none-eabi/bin/ld:
region `rom' overflowed by 104 bytes
collect2: error: ld returned 1 exit status
make: *** [build/with-libc.elf] Error 1
The 104 bytes overflow hints at the cause: we are overflowing our flash by
the size of our data section. This is because initialization values for our
initialized static variables are stored in flash as well.
To avoid confusion, I prefer to use a small script to compute the sizes:
#!/bin/bash

if [  $# -le 2 ]
then
    echo "This script requires 3 arguments."
    echo -e "\nUsage:\nget-fw-size FILE MAX_FLASH_SIZE MAX_RAM_SIZE \n"
    exit 1
fi

file=$1
max_flash=$2
max_ram=$3

function print_region() {
    size=$1
    max_size=$2
    name=$3

    if [[ $max_size == 0x* ]];
    then
        max_size=$(echo ${max_size:2})
        max_size=$(( 16#$max_size ))
    fi

    pct=$(( 100 * $size / $max_size ))
    echo "$name used: $size / $max_size ($pct%)"
}

raw=$(arm-none-eabi-size $file)

text=$(echo $raw | cut -d ' ' -f 7)
data=$(echo $raw | cut -d ' ' -f 8)
bss=$(echo $raw | cut -d ' ' -f 9)

flash=$(($text + $data))
ram=$(($data + $bss))

print_region $flash $max_flash "Flash"
print_region $ram $max_ram "RAM"
which gives us:
$ ./get-fw-size build/with-libc.elf 0x40000
0x8000
Flash used: 10904 / 262144 (4%)
RAM used: 8376 / 32768 (25%)
Stick that in your Makefiles, and you’ll have the size as you build your firmware.
Note that an alternative to running size is to add the -Wl,--print-memory-usage
link-time flag which will give you something that looks like this:
Memory region         Used Size  Region Size  %age Used
             rom:       10800 B       256 KB      4.12%
             ram:        8376 B        32 KB     25.56%
This falls into the same pitfall as size in that it does not count data
against ROM, and gives us less info since it does not break RAM out into data
and bss.
Digging into functions
The above tells us how much code space we are using, but not why. To answer the latter, we need to go deeper.
This is where another tool bundled with the GNU ARM toolchain comes in handy:
arm-none-eabi-nm.
nm allows us to print out all of the symbols in an ELF file, and with the
--size option it will also print the size of each symbol, and even sort them
by size if you specify --size-sort.
So if we want to dig into what symbols consume the most code space, we simply do:
$ arm-none-eabi-nm --print-size --size-sort --radix=d build/with-libc.elf | tail -30
00004420 00000100 T _write
00006948 00000112 T __sinit
00002096 00000118 T _sercom_get_sync_baud_val
00002684 00000124 T sercom_set_gclk_generator
00009864 00000128 T _fflush_r
00010112 00000136 T __smakebuf_r
00007060 00000144 T __sfp
00005676 00000144 T system_gclk_chan_disable
00010304 00000148 T _free_r
00009104 00000172 T __swbuf_r
00000000 00000180 T exception_table
00005112 00000180 T system_clock_source_get_hz
00007276 00000188 T _malloc_r
00003894 00000190 t usart_get_config_defaults
00005352 00000196 T system_gclk_gen_get_hz
00003332 00000200 T Reset_Handler
00001636 00000214 T usart_read_wait
00008164 00000218 T _printf_common
00001872 00000224 t long_division
00009316 00000236 T __swsetup_r
00006320 00000266 T __udivsi3
00005984 00000272 t _system_pinmux_config
00009588 00000276 T __sflush_r
00001122 00000416 T usart_init
00002808 00000444 T _sercom_get_default_pad
00002216 00000468 T _sercom_get_async_baud_val
00008384 00000532 T _printf_i
00007544 00000620 T _vfiprintf_r
00007544 00000620 T _vfprintf_r
00000430 00000692 t _usart_set_config
Note: you can also add -l to get filename & line # for each symbol.
Here we see that our largest symbol is _usart_set_config which uses 692
bytes of flash.
Puncover
Although you can get quite far with the ARM GNU tools, my favorite tool for code size analysis by far is Puncover. It was built by Heiko Behrens, my former coworker at Pebble.
Puncover will give you a full hierarchical view of both code size and static memory per module, file, and function. See the screenshot below:
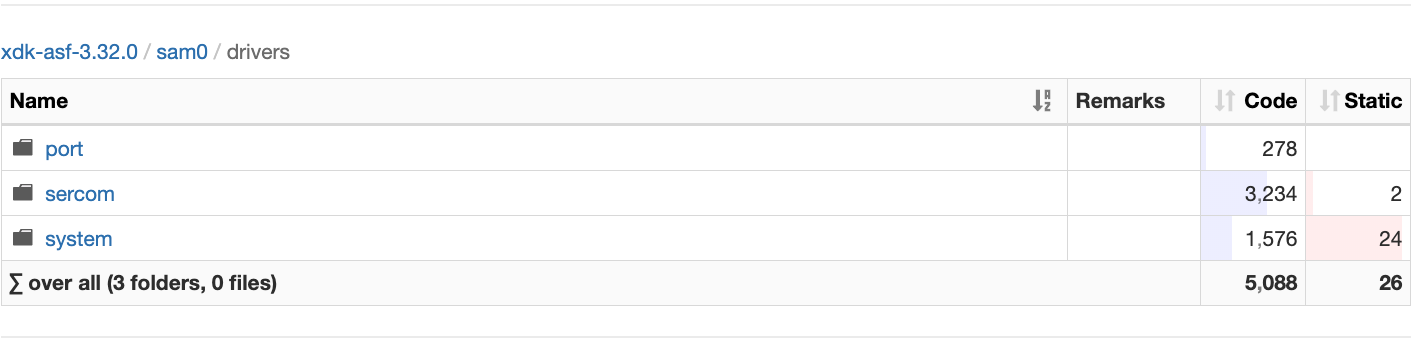
It also shows you details for each function, including callers, callees, and disassembly.
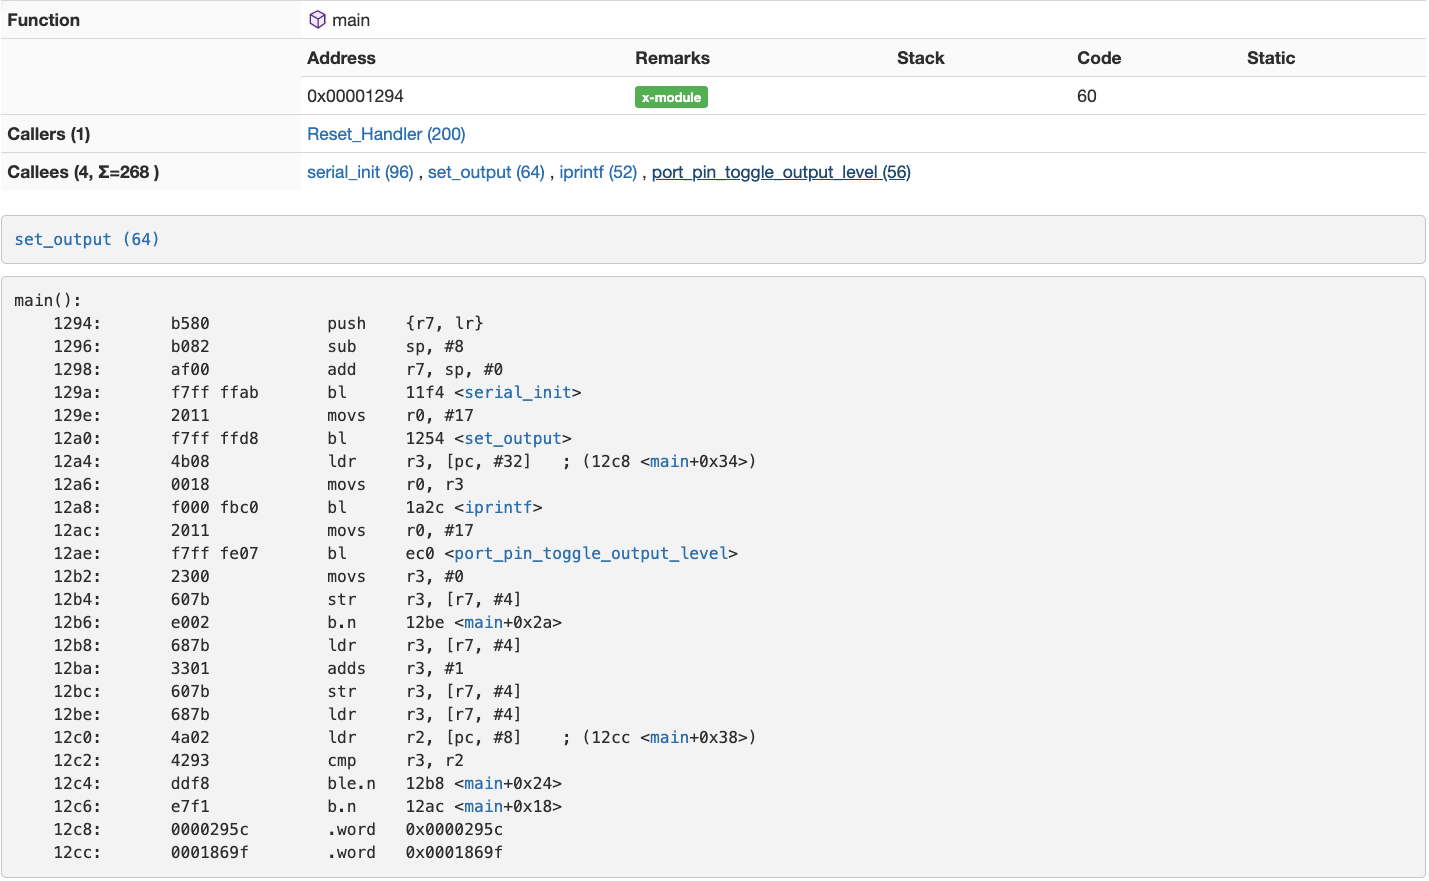
Truly, it is a firmware analysis swiss army knife!
Using puncover is relatively straightforward. You’ll need to lightly prepare your codebase, setup the tool itself, and run it.
Preparing our codebase
In order to for puncover to work, our elf file needs to contain the requisite information. As such, you’ll need to make sure you’ve got the following CFLAGS set:
-
-g: this generates debug information which puncover requires for analysis -
-fdebug-prefix-map=/=: this flag forces gcc to collect full paths for filenames. This allows puncover to create the hierarchical view of the code. Even better would be to use your repository’s root (usually found by runninggit rev-parse --show-toplevel).
I typically add those two to my CFLAGS for every project directly in my Makefile.
Setting up puncover
Puncover is relatively straightforward to setup: you simply need to clone it, setup a virtualenv, and install the dependencies.
# Clone
$ git clone git@github.com:memfault/puncover.git
Cloning into 'puncover'...
remote: Enumerating objects: 1, done.
remote: Counting objects: 100% (1/1), done.
remote: Total 609 (delta 0), reused 0 (delta 0), pack-reused 608
Receiving objects: 100% (609/609), 1.22 MiB | 1.39 MiB/s, done.
Resolving deltas: 100% (325/325), done.
$ cd puncover

# Setup venv
$ python2.7 -m virtualenv venv
New python executable in /Users/francois/code/puncover/venv/bin/python2.7
Also creating executable in /Users/francois/code/puncover/venv/bin/python
Installing setuptools, pip, wheel...
done.

# Install dependencies
$ source venv/bin/activate
(venv) $ pip install -r requirements.txt
[...]
Successfully installed Flask-0.10.1 Jinja2-2.10.1 MarkupSafe-1.1.1
Werkzeug-0.15.2 argparse-1.4.0 certifi-2019.3.9 chardet-3.0.4 codecov-2.0.5
cov-core-1.15.0 coverage-4.5.3 funcsigs-1.0.2 idna-2.8 itsdangerous-1.1.0
mock-1.3.0 nose-1.3.7 nose-cov-1.6 pbr-5.2.0 requests-2.21.0 six-1.12.0
urllib3-1.24.3
Running puncover
While you can install puncover as an executable, I typically just run the
runner.py script directly. All it requires is the path to your GNU ARM
toolchain:
python runner.py --arm_tools_dir=<path-to-arm-tools-folder> --elf_file <path-to-elf-file>
Note that puncover needs the top level folder for your arm tools, not the bin
file. For me that’s /usr/local/Cellar/arm-none-eabi-gcc/8-2018-q4-major/.
If all goes well, you should see that puncover has spun up a webserver:
(venv) $ python runner.py
--arm_tools_dir=/usr/local/Cellar/arm-none-eabi-gcc/8-2018-q4-major/ --e_file
~/code/zero-to-main/with-libc/build/with-libc.elf
DEPRECATED: argument --arm_tools_dir will be removed, use --gcc_tools_base
instead.
parsing ELF at /Users/francois/code/zero-to-main/with-libc/build/with-libc.elf
enhancing function sizes
deriving folders
enhancing file elements
enhancing assembly
enhancing call tree
enhancing siblings
unmangling c++ symbols
 * Running on http://127.0.0.1:5000/ (Press CTRL+C to quit
Now open your favorite web browser at localhost:5000, and enjoy!
Note: You may notice that some code size will be attributed to symbols under
<Unknown>. If you dig into those, you will see that they are all symbols
provided by the compiler or libc, such as __aeabi_idiv0 or _printf_i. These
symbols do not come with file information as newlib is not compiled with -g in
most distributions. If you built your own newlib from source, you could fix
that!
Puncover in Zephyr
The Zephyr RTOS project has the ability to run puncover directly within West. It’s slick!
You can do so by running the following:
# Build as normal
west build ...

# After installing puncover with 'pip install puncover'
west build -t puncover
Epilogue
Upon reviewing this blog post, a friend suggested I look at Bloaty by Google. You can check it out on Github or just download it from brew.
Bloaty is a nifty tool that wraps all the objdump analysis into a nice CLI client, and can even tell you what sections, symbols, and files grew or shrunk between two ELFs which would be very useful for a CI system.
What tools and techniques do you use to debug code size? Let us know in the comments!
Next in the series, we’ll talk about compiler settings you can use to optimize for code size.
 François Baldassari has worked on the embedded software teams at Sun, Pebble, and Oculus. He is currently the CEO of Memfault.